Mechanical Properties
Influence of Stabilizing Elements on Ductile-Brittle Transition Temperature (DBTT) of 18Cr Ferritic Stainless Steels
2022 Volume 62 Issue 4 Pages 788-798

Details
2022 Volume 62 Issue 4 Pages 788-798
The influence of different stabilizing elements (Nb, Ti and Zr) which are added to stabilize interstitial elements in the ferrite matrix on the ductile-brittle transition temperature (DBTT) of 18Cr ferritic stainless steels was systematically investigated at different temperatures ranging from −25°C to 75°C. Hot-rolled sheets of 18 mass% Cr ferritic stainless steels containing a trace amount (0.1 atomic%) of Nb, Ti or Zr were studied. The added stabilizing elements formed precipitates of carbides/nitrides in all the steels tested in the present study. The particle diameter of the precipitates observed in the Nb-added steel was much smaller than those in the other steels. The measured DBTTs of the Base steel and the Nb-added, Ti-added and Zr-added steels were 39°C, −3°C, 39°C and 11°C, respectively. Although initiation of cleavage cracks in each steel occurred independent of the kind of stabilizing element, the Nb-added steel exhibited a relatively higher Charpy impact value due to ductile plastic deformation following cleavage crack initiation, resulting in a lower DBTT (superior impact toughness). The occurrence of plastic deformation in the Nb-added steel is considered to be due to the fine carbide and/or nitride precipitates which were homogenously distributed in the material. Detailed analyses of the fracture surfaces were also performed for the other steels, and the results were used as a basis for discussing the effects of each stabilizing element on the DBTT of 18Cr ferritic stainless steels in terms of the precipitation morphologies observed in the ferrite matrix.
Ferritic stainless steels have high thermal conductivity, a low thermal expansion coefficient and low stress corrosion cracking sensitivity compared to austenitic stainless steels. Ferritic stainless steels containing trace amounts of added Ti or Nb are widely used, for instance, in automotive exhaust system parts such as exhaust manifolds in which an anti-thermal fatigue property is required1,2,3,4,5) and in building roofs. Addition of Nb or Ti as stabilizing elements can stabilize interstitial elements (C and/or N) in the ferrite matrix by forming carbides or nitrides, thereby suppressing the formation of Cr-depleted zones.6,7) Addition of these stabilizing elements significantly improves the corrosion resistance and corrosion stress cracking resistance of these ferritic stainless steels,8) which are generally denoted as “stabilized ferritic stainless steels.” However, the toughness of ferritic stainless steels is inferior to that of austenitic stainless steels. Low toughness, especially a high ductile-brittle transition temperature (DBTT), limits the applications of ferritic stainless steels to various structural components because toughness at ambient temperature is an important mechanical property for the reliability of structural parts. Although it is generally accepted that low toughness is mainly due to {100} cleavage fracture occurring in the ferrite (bcc structure) matrix, it is intriguing that the toughness of stabilized ferritic stainless steels varies depending on the stabilizing element. For instance, it is generally known that Ti-added (Ti-stabilized) ferritic stainless steels exhibit higher DBTTs than Nb-stabilized steels.9) Therefore, the selection of stabilizing elements could be key to improving the DBTT of stabilized ferritic stainless steels.
Various reports have investigated the influence of the chemical composition and precipitates (carbides or nitrides) on the toughness of ferritic stainless steels.10,11,12,13,14,15) Krivobok10) investigated the impact absorbed energies of iron-based alloys with various C and Cr contents. The measured absorbed energies appeared to be independent of the Cr content below approximately 16% Cr, but decreased with an increase in the C content above that level. A similar tendency was reported by Binder and Spendelow, who investigated the absorbed energies of steels with various contents of Cr and C + N.11) Redmond12) systematically investigated the DBTT of stabilized ferritic stainless steels with different Nb or Ti contents, and demonstrated that Nb-stabilized steels exhibited a lower DBTT value than Ti-stabilized steel. It has been reported that the DBTT of stabilized steels containing both the elements Nb and Ti was located at an intermediate temperature between those of Nb-stabilized and Ti-stabilized steels. Yamamoto et al.13) reported that although DBTT decreased in Nb-stabilized steels with higher Nb contents, DBTT increased significantly when the Nb content exceeded 0.3%. There have also been reports concerning the influence of added Zr, which is one of the stabilizing elements used to form carbide/nitride in ferritic stainless steels.14,15) Kawano et al.14) reported that the DBTT of a 20Cr-5Al alloy clearly decreased when Zr/(C + N) (in atomic%) became approximately one. Yan et al.15) investigated the influence of the Zr content on the Charpy impact values of 16Cr-2.5Mo-0.003C steels and found that the Charpy impact value was obviously increased by adding a certain amount of Zr to 16Cr-2.5Mo-0.003C steels, whereas it decreased when a large amount of Zr was added.
As mentioned above, the toughness of Ti-stabilized stainless steels tends to be inferior to that of Nb-stabilized steels. At the same time, it is clear that DBTT decreases, indicating improved toughness, when an optimized amount of Nb or Zr is added to Nb- or Zr-stabilized steels. However, there have been no reports on the effect of a fixed amount of added stabilizing elements on the precipitation morphology of carbide/nitride and their associated DBTT in ferritic stainless steels treated by the same thermo-mechanical process (equivalent to the industrial production process of hot-rolled steel sheets). Thus, the role which each stabilizing element can play in improving DBTT remains unclear. In order to better understand the effect of the different stabilizing elements on the DBTT of ferritic stainless steels, in the present study, we systematically examined the impact toughness of 18%Cr ferritic stainless steels with the same amount of interstitial solute elements (0.1 at% C + N) and added stabilizing elements (0.1 at% Nb, Ti or Zr) for controlling the maximum fraction of carbide/nitride formed in the ferrite matrix. The fracture surfaces of the tested specimens were analyzed in detail, and these results were used as a basis for discussing the roles of each stabilizing element in improving the DBTT of stabilized ferritic stainless steels.
The present study was conducted using 18 mass% Cr ferritic stainless steels, which are a major type of ferritic stainless steel. The chemical compositions of the steels are listed in Table 1. The sample steels prepared here were 18 mass% Cr ferritic stainless steel (denoted as Base steel) and samples of the same composition containing a trace amount of added Nb, Ti or Zr (denoted as Nb-added, Ti-added and Zr-added steels). The content of these added stabilizing elements was aimed to be equal to C + N in atomic%. It should be noted that no solid-phase transformation, such as the austenite to ferrite or martensite transformation, occurs with the studied compositions.
| Steel | Fe | Cr | C | Si | Mn | P | S | Al | N | Nb | Ti | Zr |
|---|---|---|---|---|---|---|---|---|---|---|---|---|
| Base | Bal. | 18.0 | 0.010 | 0.01 | < 0.01 | 0.004 | 0.0003 | 0.021 | 0.010 | < 0.001 | 0.005 | < 0.001 |
| Nb-added | Bal. | 18.2 | 0.011 | 0.01 | < 0.01 | 0.004 | 0.0005 | 0.025 | 0.010 | 0.14 | 0.007 | < 0.001 |
| Ti-added | Bal. | 18.3 | 0.011 | 0.03 | < 0.01 | 0.004 | 0.0004 | 0.013 | 0.010 | < 0.001 | 0.066 | < 0.001 |
| Zr-added | Bal. | 18.2 | 0.012 | 0.02 | < 0.01 | 0.004 | 0.0003 | 0.043 | 0.010 | 0.001 | 0.005 | 0.11 |
In preparing the sample materials, a 50 kg ingot of each of the steels was prepared by vacuum induction melting. The thermo-mechanical history of the steels is shown in Fig. 1. The ingots were heated and held at 1150°C for 1 h, followed by hot-rolling to intermediate materials with a thickness of 35 mm, then air-cooled to room temperature. Thereafter, in order to remove the oxide scale, the thickness of the hot-rolled steels was reduced from 35 to 30 mm by double-side machining, after which a laboratory slab for finishing hot-rolling was taken from the machined material. The laboratory slab was heated and held at 1250°C for 1 h, which was followed by finishing hot-rolling to a sheet with a thickness of 4.0 mm. The sheets were air-cooled to 750°C and held at 750°C for 2 h, followed by furnace cooling to room temperature to obtain sufficient precipitation. The present thermo-mechanical process simulated an industrial manufacturing process for ferritic stainless steel sheets.
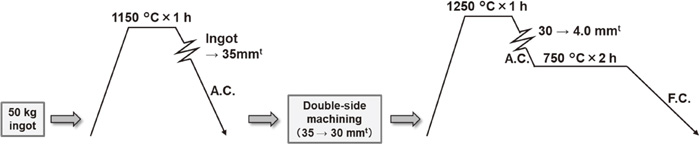
Thermo-mechanical history of the steels.
A tensile test using JIS 13B test pieces16) was conducted with the tensile axis parallel to the sheet rolling direction at the strain rate of 3.3 × 10⁻³ s−1. The dimensions of the test pieces at the gauge portion were 50 mmL × 12.5 mmW × thickness of the sheet (approximately 4.0 mm). The tensile strain was measured by a contact type extensometer at all test temperatures. A Charpy impact test based on JIS Z 2242:202017) was conducted in the temperature range from −25 to 75°C using 2 mm V-notched L-T test pieces whose dimensions were 55 mmL × 10 mmW × thickness of the sheet (approximately 4.0 mm), which are referred to hereinafter as “standard test piece.” The load-displacement curves of each steel were obtained by an instrumented Charpy impact test using the above standard test piece and test pieces with 1 mm V-notches added on both sides of the standard test piece (hereinafter referred to as “side-grooved test piece”) at the temperatures of each steel corresponding to a measured brittle zone ratio ranging from approximately 70 to 90%. Microstructure observation and analysis were conducted by optical microscopy (OM), scanning electron microscopy (SEM) and electron backscattered diffraction analysis (EBSD). Phase identification was carried out by an electron probe micro-analyzer (EPMA) and X-ray diffraction analysis (XRD) of the electrolytically extracted residue,18) which was obtained by constant current electrolysis in a 10 vol% acetylacetone-1 mass% tetramethylammonium chloride-methanol electrolyte, followed by filtering with a mesh of 0.2 μmϕ. The extraction residue obtained by electrolysis was about 10 mm3 and about 0.08 g per specimen. Quantitative analyses of the amount and size distribution of the precipitates in the hot-rolled steels were also conducted using the extracted residue. The amount of precipitates was measured by ion coupling plasma analysis (ICP) of the residue dissolved in acid. The distribution of the particle diameter of the precipitates was measured by the laser diffraction scattering method19) using the residue sonicated in ethanol.
Figure 2 shows OM micrographs of the hot-rolled steels, together with the average grain size measured by the SEM/EBSD method. All steels exhibited a single-phase microstructure of ferrite containing deformation bands introduced by hot-rolling. A number of elongated grains along the rolling direction (corresponding to the horizontal direction in the observed images) were also observed. However, the Zr-added steel had a relatively equiaxial microstructure (Fig. 2(d)). Except for the Nb-added steel, the average grain size of the steels was approximately 130 μm to 150 μm; however, the average grain size of the Nb-added steel was 67 μm, which is significantly finer than those of the other steels.
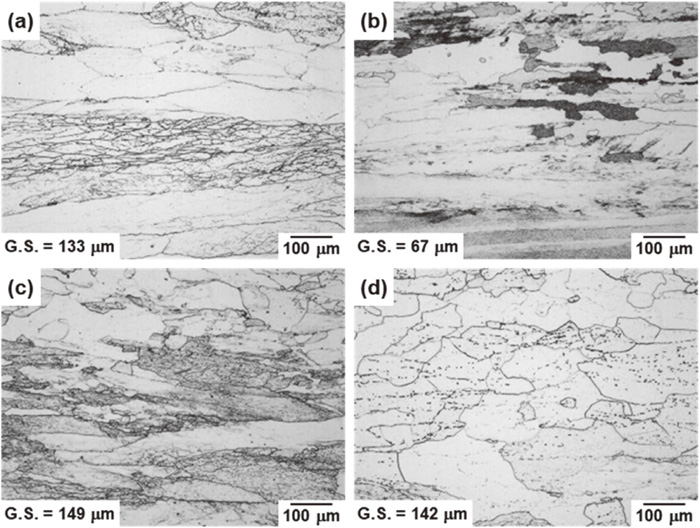
Optical micrographs of the steels after hot-rolling: (a) Base steel, (b) Nb-added steel, (c) Ti-added steel and (d) Zr-added steel.
Figure 3 shows SEM micrographs of the steels after hot-rolling. A number of precipitates within the grains or along the grain boundaries were observed in all steels. Some coarse precipitates were observed in the Base steel (Fig. 3(a)) and the Ti-added steel (Fig. 3(c)), but the typical coarse Ti-rich precipitates with a cubic morphology20,21) were not observed in the present Ti-added steel. Such coarse precipitates were also not observed in the Nb-added steel (Fig. 3(b)). On the other hand, the Zr-added steel contained a small number of intermetallic compounds, which appeared as areas of bright contrast when observed in the backscattered electron image (Fig. 3 (e)). The intermetallic compound was identified as the Laves phase (Fe2Zr) by EPMA analysis, even though such intermetallic compounds were not detected by XRD using the electrolytically extracted residue.

SEM micrographs of the steels after hot-rolling: (a) Base steel, (b) Nb-added steel, (c) Ti-added steel, (d) Zr-added steel and (e) BSE image of the Zr-added steel obtained from the same view as (d).
The quantitative analysis results of the precipitates in the hot-rolled steels obtained from the electrolytically extracted residue are listed in Table 2. The amount of precipitated C was calculated by the following procedure. First, the amount of the metallic elements (Cr, Nb, Ti and Zr) in nitrides, which were detected by XRD using the electrolytically extracted residue, was calculated stoichiometrically from the amount of precipitated N. The following phases were detected in each steel by XRD. Base steel: Cr2N, Cr23C6, Nb-added steel: NbN, NbC, Ti-added steel: TiN, Cr23C6, Zr-added steel: ZrN, ZrC, Cr23C6. Second, the amount of C precipitated as other carbides, which were also detected by XRD using the electrolytically extracted residue, was calculated from the stoichiometric relationship with the metallic elements that were not consumed as nitrides. Note that although the Laves phase was observed in the SEM microstructure, as shown in Fig. 3, the existence of the Laves phase in the Zr-added steel was not considered when calculating the amount of precipitated C because the amount was below the detection limit by XRD. It was found that the total contents of the stabilizing elements Nb, Ti and Zr in the precipitates were almost the same as the added amounts in the stabilized steels (Table 1), indicating that almost all of the added Nb, Ti and Zr in the stabilized steels was consumed for the formation of precipitates. This result suggests that the amount of solute stabilizing elements in the ferrite matrix of the steels is negligible. It was also found that most of the C and N formed precipitates in each steel, except for the C in the Base steel, in which approximately 40 ppm of C remained.
| Steel | Fe | Cr | Al | Nb | Ti | Zr | C | N |
|---|---|---|---|---|---|---|---|---|
| Base | 0.033 | 0.185 | 0.002 | < 0.001 | < 0.001 | < 0.001 | 0.0062 | 0.0111 |
| Nb-added | 0.001 | 0.018 | 0.002 | 0.136 | < 0.001 | < 0.001 | 0.0096 | 0.0106 |
| Ti-added | 0.024 | 0.071 | 0.004 | < 0.001 | 0.050 | < 0.001 | 0.0087 | 0.0095 |
| Zr-added | 0.032 | 0.095 | 0.001 | < 0.001 | < 0.001 | 0.100 | 0.0102 | 0.0101 |
Figure 4 shows the distribution of the particle diameter of the precipitates in each steel obtained by the laser diffraction scattering method using the electrolytically extracted residue sonicated in ethanol. Although the three steels except the Nb-added steel showed somewhat broad size distributions, the Nb-added steel showed a sharp distribution centering on a smaller particle size range. Table 3 lists the particle diameters of the precipitates based on various indices obtained from Fig. 4. While the particle diameter of the precipitates in the Base steel was obviously larger than those in the other steels, it was clearly smaller in the Nb-added steel than in the other steels. The average particle diameter of the precipitates in the Ti-added and Zr-added steels were positioned between those in the Base and Nb-added steels. Although the distributions in the Ti-added and Zr-added steels were similar, the maximum particle diameter of the precipitates in the Ti-added steel was slightly larger than in the Zr-added steel. The volume fraction of the precipitates was estimated to be almost the same in the three steels containing the added stabilizing elements Nb, Ti or Zr because the amounts of precipitated C and N were almost the same in the three steels. Therefore, it is considered that a larger amount of fine precipitates exists in the Nb-added steel than in the other steels.
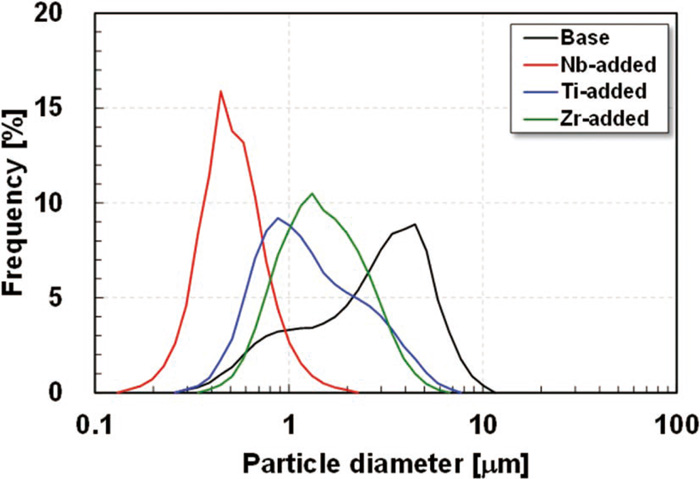
Distributions of the particle diameter of the precipitates.
| Steel | Average [μm] | Median [μm] | Mode [μm] | Min. [μm] | Max. [μm] |
|---|---|---|---|---|---|
| Base | 2.88 | 2.69 | 4.14 | 0.30 | 10.1 |
| Nb-added | 0.51 | 0.47 | 0.42 | 0.15 | 1.98 |
| Ti-added | 1.46 | 1.10 | 0.82 | 0.30 | 6.72 |
| Zr-added | 1.56 | 1.36 | 1.23 | 0.39 | 5.87 |
Figure 5 shows the stress-strain curves of the steels obtained from tensile tests at room temperature (24°C) and −30°C. The stress-strain curves of the steels exhibited continuous yielding at both temperatures. The Nb-added steel showed the highest strength, probably due to the fine precipitation morphology of the ferrite matrix (Figs. 3(b) and 4). The Ti-added steel also showed higher strength than the Base steel, whereas the Zr-added steel showed lower strength than the Base steel. Here, it should be noted that ductile rupture with large reduction occurred in all specimens, even at −30°C. The fracture morphology in the Charpy impact test will be described later.
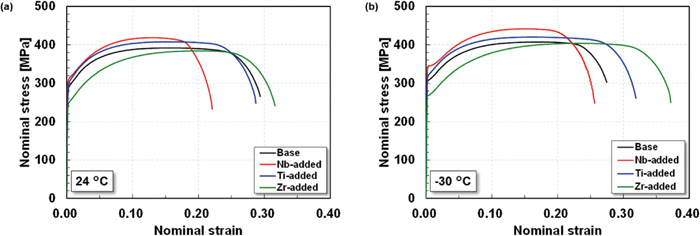
Stress-strain curves of the steels in the tensile tests at (a) room temperature and (b) −30°C.
Figure 6 shows the temperature dependence of the 0.2% proof stress and total elongation of the steels. The 0.2% proof stress increased linearly with decreasing test temperature in all the steels; however, no obvious temperature dependence of total elongation was observed in any of the steels. The temperature dependence of 0.2% proof stress did not differ significantly depending on the stabilizing element added. The Nb-added and Ti-added steels exhibited higher 0.2% proof stress than the Base steel, whereas the Zr-added steel exhibited lower stress than the Base steel. The magnitude relationship of 0.2% proof stress among the steels was independent of the test temperature. Elongation showed a contradictory tendency in the Nb-added steel and Zr-added steel, as elongation was lowest in the Nb-added steel, which had the highest 0.2% proof stress, and highest in the Zr-added steel, which had the lowest 0.2% proof stress. The Nb-added steel showed obviously lower total elongation than the Ti-added steel, even though the 0.2% proof stresses of the Nb-added steel and Ti-added steel were relatively similar.
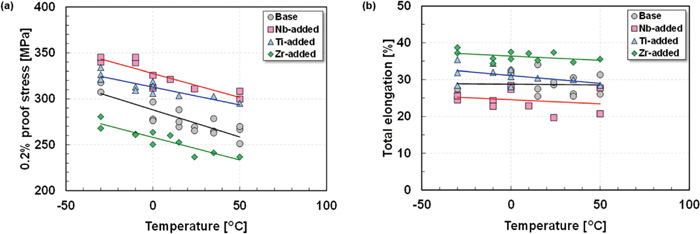
Temperature dependence of (a) 0.2% proof stress and (b) total elongation of the steels.
Figure 7 shows SEM micrographs of the fracture surfaces of the steels after the tensile test at room temperature. All specimens displayed numerous spherical dimples over the entire fracture surface, which is the typical morphology of ductile fracture. A similar fracture morphology was also observed in the specimens tested at −30°C. Relatively large dimples were uniformly observed on the fracture surface of the Base steel (Fig. 7(a)), whereas the Ti-added and Zr-added steels exhibited finer dimples (Figs. 7(c), 7(d)) in comparison with the Base steel, and the distribution of the dimples was not uniform in the Ti-added and Zr-added steels. Finer dimples and/or void sheets were homogenously distributed on the fracture surface of the Nb-added steel (Fig. 7(b)), which was distinct from the features observed in the Ti-added and Zr-added steels. The fracture of the Nb-added steel was similar to that of the other steels in terms of microvoid coalescence. However, the fine dimples on the fracture surface of the Nb-added steel suggest that the density of void initiation sites in the Nb-added steel was higher than in the other steels.

SEM micrographs of the fracture surfaces of the steels after the tensile test at room temperature: (a) Base steel, (b) Nb-added steel, (c) Ti-added steel, (d) Zr-added steel.
Figure 8 shows the temperature dependence of the Charpy impact value (CIV) of each steel when using the standard test piece. More than three impact tests were performed at each temperature. In this graph, the plotted symbols and error bars indicate average values and the variation of the measured values, respectively.

Temperature dependence of the Charpy impact value of the steels.
The temperature dependence of CIV was clearly different among the steels, even though the steels displayed similar temperature dependence of 0.2% proof stress, as shown in Fig. 6. First, a clear upper shelf did not appear in the Base steel even at 75°C, while in contrast, a clear upper shelf was observed in the steels stabilized by addition of Nb, Ti or Zr, and the upper shelf CIVs of these stabilized steels were almost identical. Note here that it was unclear in this study whether the upper shelf CIV of the Base steel was also identical. Second, the energy transition in the Base steel was gradual and its transition temperature region was broad, whereas the energy transitions in the stabilized steels were steep and the transition temperature regions were narrow. In addition, critical temperatures for changing CIV were also observed in the stabilized steels, which was distinguished from the temperature dependence of CIV in the Base steel. It is noteworthy that the critical temperature obviously varied depending on the added stabilizing element. In particular, the critical temperature of the Nb-added steel showed the lowest value of around 0°C, while the Ti-added steel showed the highest temperature of approximately 40°C. Besides, the reason why the Base steel indicated different behavior with the stabilized steels could not be clarified in this study. As probable causes, in addition to the fact that the content of solute C of the Base steel was slightly higher than that of stabilized steels as previously stated in Chapter 3.1, it is considered that the grain size uniformity and dislocation density after hot-rolling were different from those of the stabilized steels. In order to clarify the cause, it seems to be necessary to carry out the investigation such as comparing by recrystallization microstructure with the similar grain size in future.
Figure 9 shows the varied brittle zone ratios of the specimens after the Charpy impact test as a function of the test temperature, together with low-magnification SEM images showing representative surface appearances for the brittle zone ratios of 0% (Fig. 9(b)) and 100% (Fig. 9(c)) in the Base steel. The brittle zone ratio was quantified according to JIS Z 2242. The brittle zone ratio (measured area fraction of the brittle fractured region) in the Base steel gradually deceased with increasing test temperature and then became approximately 15% at 75°C. The gradual change in the brittle zone ratio showed a good correspondence with the temperature dependence of CIV observed in the Base steel (Fig. 7). The brittle zone ratio of the Nb-added steel decreased drastically at around 0°C and then reached 0%. This result indicated a clear transition temperature from the brittle fracture mode to the ductile fracture mode in the Nb-added steel. The brittle zone ratio decreased greatly at test temperatures of 0 to 25°C in the Zr-added steel and 25 to 50°C in the Ti-added steel. As in the Nb-added steel, both of these steels exhibited an obvious transition from the brittle to the ductile fracture mode. The brittle zone ratio of the Ti-added steel did not reach 0% even at test temperatures above 50°C. These results provide approximate DBTTs of the steels as follows: Nb-added (−3°C) < Zr-added (11°C) < Ti-added (39°C) = Base (39°C). It is generally known that DBTT strongly depends on the grain size. The Nb-added steel exhibited a relatively fine microstructure in the ferrite matrix (Fig. 2), whereby it can be assumed that the Nb-added steel might exhibit a lower DBTT (superior impact ductility around ambient temperature). However, even when considering the grain size dependence of DBTT of ferritic stainless steels,22) it was estimated that Nb-added steel would have a lower DBTT than the other steels. Thus, the superior impact ductility of the Nb-added steel would be a result of not only the relatively fine microstructure, but also the added Nb element. The fine microstructure would be due to the pinning effect of the fine precipitates in the Nb-added steel (Fig. 4 and Table 3). Thus, it was found that DBTT can be improved (lower DBTT) by adding Nb or Zr, but the DBTT of the Ti-added steel was substantially the same as that of the Base steel. Furthermore, the Nb-added steel exhibited a lower DBTT (superior impact toughness at around ambient temperature) than the Ti-added steel, indicating that DBTT is affected by the selection of stabilizing elements, even if the atomic content of the added stabilizing elements is the same.
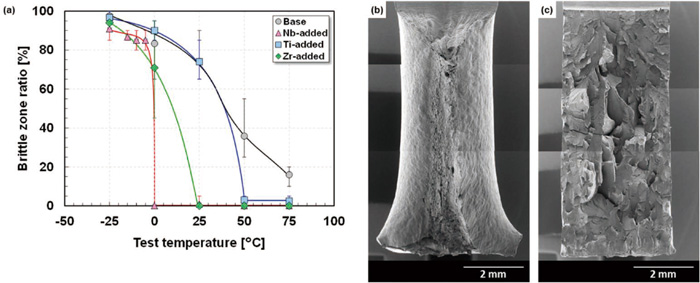
(a) Temperature dependence of the brittle zone ratio of the steels. (b) and (c) are the typical fracture appearance mainly based on ductile fracture (Base steel tested at 50°C) and brittle fracture (Base steel tested at 0°C), respectively.
The present tensile tests revealed a similar temperature dependence of the 0.2% proof stress in all the steels, although the Nb-added steel showed the highest 0.2% proof stresses (Figs. 5 and 6), which appeared independent of the test temperature. It is noteworthy that the DBTT of the Nb-added steel was the lowest among the steels (Figs. 8 and 9). These results demonstrated that the Nb-added steel possesses both high strength and superior impact toughness at around ambient temperature. It is generally known that toughness is influenced by various microstructural factors including the grain size,22) the content of solute elements and the size and morphology of precipitates. Since the Nb-added steel has an average grain size of approximately 70 μm (Fig. 2), which is relatively finer than those of the other steels, the possibility that the Nb-added steel displayed a lower DBTT due to the contribution of grain size cannot be completely denied even if the DBTT of Nb-added steel after correcting the effect of grain size was superior. However, the DBTTs of the Ti-added and Zr-added steels were clearly different, even though these two steels had almost the same average grain size. Furthermore, the contents of precipitated C and N in the Ti-added and Zr-added steels were almost the same, as shown in Table 2; that is, the contents of solute C and N in the ferrite matrix were considered to be essentially the same. This means the different of DBTTs of the Ti-added and Zr-added steels cannot be explained by the grain size or the contents of solute C and N in the ferrite matrix. Considering these facts, the difference of DBTT among the steels is presumed to be caused by differences in the size and/or morphology of carbides or nitrides.
In order to identify the cleavage trigger point of the steels in impact deformation, microscopic fractographic analyses of the Charpy impact-tested specimens were performed. The representative results are shown in Fig. 10. In general, a fracture surface often exhibits a small smooth spot at the fracture origin (crack initiation site), which originates from internal inclusions or micron-size defects.23) In this study, such inclusions (corresponding to relatively coarsened precipitates with sizes of a few microns) were often observed at the fracture origin of the Ti-added and Zr-added steels (Figs. 10(c), 10(d)), while similar inclusions or precipitates were rarely observed at the fracture origin of the Base and Nb-added steels (Figs. 10(a), 10(b)).
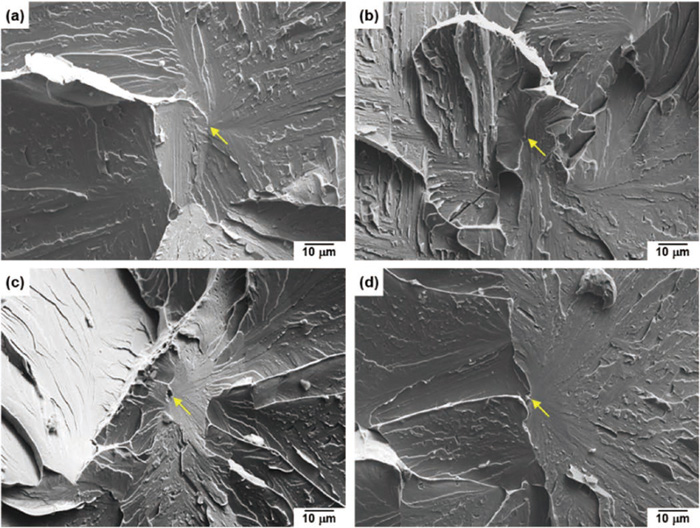
SEM micrographs on the fracture surface of the steels after the Charpy impact test at −25°C: (a) Base steel, (b) Nb-added steel, (c) Ti-added steel, (d) Zr-added steel. The arrows in the images indicate the fracture origin.
The representative results of the EDS composition analyses of the precipitates observed at the fracture origin in the Ti-added and Zr-added steels are summarized in Fig. 11. In the Ti-added steel, the EDS analyses revealed enrichment of not only Ti and N (Fig. 11(a-1)) but also Al and O (Fig. 11(a-2)) in the precipitates at the fracture origin. Therefore, these precipitates are assumed to be complexes of Ti carbonitride and Al oxide. The complex form was considered to be Ti carbonitride formed on an Al oxide, which is an inclusion formed by deoxidation, as reported in the literature.24,25,26,27) Figure 11(b) shows the matching position of Fig. 11(a) on another fracture surface. The same precipitates were also observed at the counterpart position, indicating that the fragmented complex precipitates at the fracture origin. A similar phenomenon was also observed on the fracture surfaces of the other Ti-contained steels including fine TiN particles.24,27,28,29) In the Zr-added steel, the precipitates at the fracture origin (Fig. 11(c)) were identified as Zr carbonitride rather than the Fe2Zr Laves phase (Fig. 11(c-1)). The Zr carbonitride is considered to form independently in the matrix, since there are no detectable characteristic X-rays derived from the elements Al and O (Fig. 11(c-1)). These results indicated that the fracture initiated at relatively coarsened particles of carbonitride in the Ti-added and Zr-added steels.

(Top) SEM micrographs of the fracture initiation point of the steels after the Charpy impact test at −25°C and (bottom) EDS profiles obtained from the fracture initiation points indicated by the arrows in the micrographs: (a) Ti-added steel, (b) matching position of (a) on another fracture surface and (c) Zr-added steel.
As mentioned above, even though all the steels displayed cleavage fracture, no coarse inclusions or precipitates were observed at the fracture origin in the Base steel or the Nb-added steel, while coarse inclusions/precipitates were observed at the fracture origin in the Ti-added and Zr-added steels. Since the DBTTs of each steel were clearly different, these results suggest that the initiation and propagation behavior of the cleavage cracks were different in each steel. Because the temperature dependence of CIV shown in Fig. 8, namely, the energy transition curve, is the sum of the energy until cleavage fracture initiation and the propagation energy after cleavage fracture, the energy before fracture initiation and the propagation energy after initiation were separated by instrumented Charpy impact tests and compared, as described below.
Figure 12 shows the representative load-displacement curves of the steels obtained by the instrumented Charpy impact test using side-grooved test pieces. Side-grooved test pieces were used here because clear load-displacement curves could not be obtained with the standard test piece, as the curves were greatly affected by shear lips when the standard test piece was used. The test temperature of each steel corresponds to the measured brittle zone ratio ranging from approximately 70 to 90% (as shown in Fig. 9). A test of the Base steel was also conducted at −5°C to clarify the influence of the test temperature on the toughness of the ferrite matrix itself. It is generally known that the CIV is affected by the specimen size. In the present study, it was confirmed that the area fraction of brittle zone on the fracture surface appeared independent of the specimen size under the present test conditions, indicating a negligible effect of the specimen size on the crack initiation and propagation in the steels studied here. Cleavage fracture occurred in all the tested specimens, their brittle zone ratios were more than 95%, and all steels showed a similar maximum load of approximately 2000 N. These results indicate that the resistance to crack initiation to failure of the steels was almost the same and was independent of the kind of added stabilizing element. In the Base and Zr-added steels tested at −5°C and the Ti-added steel tested at 25°C, the load rapidly dropped to approximately 200 N after reaching the maximum load. Although the Base steel tested at 25°C showed a significant load drop after reaching the maximum load, as was also observed in the steels tested at −5°C, this load drop stopped at approximately 500 N, which was relatively higher than in the steels tested at −5°C. The observed load drop appeared less pronounced in the Nb-added steel, in that a load of more than 1200 N was maintained until displacement of 1 mm.
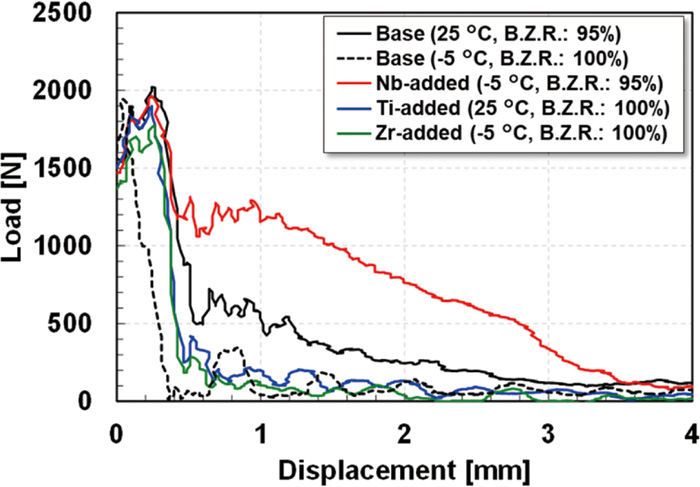
Load-displacement curves of the hot-rolled steels obtained from the instrumented Charpy impact test using side-grooved test pieces.
Figure 13 shows the calculated absorbed energies of each steel measured by the load-displacement curves shown in Fig. 12. The ratio of the absorbed energy to the total absorbed energy to maximum load was small in all steels. That is, most of the absorbed energy was the energy after reaching the maximum load, and the energy until reaching the maximum load was similar in the respective steels, independent of the test temperature. The absorbed energies after reaching the maximum loads were relatively higher in the Base steel tested at 25°C and the Nb-added steel tested at −5°C than in the other steels. The absorbed energies after reaching the maximum load were almost the same for the Base steel and the Zr-added steels tested at −5°C and the Ti-added steel tested at 25°C. It should be noted that the maximum loads and the absorbed energy of the Ti-added steel tested at −5°C were almost the same as those of the Ti-added steel tested at 25°C. The reason why the absorbed energy after reaching the maximum load of the Base steel tested at 25°C was larger than that at −5°C is considered to be the improved toughness of the ferrite matrix itself due to the higher temperature. Even when the Ti-added steel was tested at 25°C, its absorbed energy was almost the same as those of the Base and Zr-added steels tested at −5°C. Considering the facts that the absorbed energy of the Ti-added steel tested at 25°C was almost the same as that at −5°C, coarse precipitates were the cleavage trigger point in the Ti-added steel and the precipitate itself was broken, as shown in Fig. 11, it is considered that the absorbed energy value of the Ti-added steel decreased because the toughness deterioration due to the precipitates was more dominant than the toughness improvement of the ferrite matrix at the higher temperature. In addition, the effect of the precipitates is presumably attributable not only to the coarseness of the precipitates, but also to the inherent tendency of the precipitates to break upon impact. In contrast, the Nb-added steel tested at −5°C showed the largest absorbed energy in spite having the highest 0.2% proof stress among the tested steels (Fig. 6), which is disadvantageous in terms of toughness. This suggests that the toughness of the ferrite matrix of the Nb-added steel was relatively high, resulting in high resistance to crack propagation after cleavage initiation.
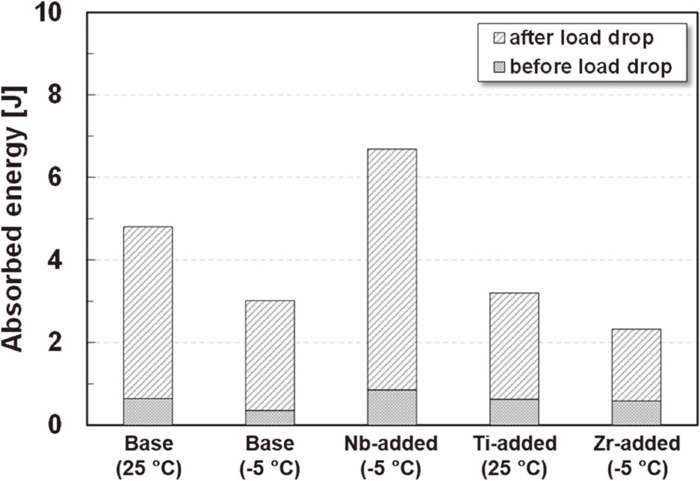
Absorbed energy measured by the Charpy impact test shown in Fig. 12.
Figure 14 shows the fracture appearance of the Nb-added steel tested by using the side-grooved test piece and SEM images of the fracture surface. Even though the steel was tested with the side-grooved test piece, shear lips were observed near the side-grooves and the impacted plane without a notch (Fig. 14(a)). Although the fracture morphology of the major part of the specimen was cleavage (Fig. 14(c)), fine dimples localized at the edge portion of flat planes and slip lines on the flat plane near the edge were also observed (Fig. 14(d)). Such fracture morphology has been reported, for example, in weld metal.30)

Appearance and SEM images on the fracture surface of the Nb-added steel after the Charpy impact test using the side-grooved test piece at −5°C. (b), (c) and (d) are high magnification images of the squares in (a) and (b), respectively.
The present fractographic analyses (Figs. 10 and 11) revealed that crack initiation occurring at relatively coarsened particles of carbonitride in the Ti-added and Zr-added steels. The observed coarsened precipitates show a good correspondence with the quantified size distributions of the precipitates in these steels (Fig. 4). It is generally known that cracks or voids often nucleate on the interface between the matrix and precipitates (or inclusions).31,32,33,34,35) Since the resistance to crack initiation of the steels was substantially the same, as shown in Fig. 12, the influence of the size and kind of precipitates on crack initiation was considered to be small in the present study. On the other hand, the absorbed energy after cleavage initiation was different among the steels. The absorbed energy after cleavage initiation of the Base steel tested at 25°C was clearly larger in comparison with that at −5°C. However, absorbed energy after cleavage initiation of the Ti-added steel tested at 25°C was as small as that of the Base and Zr-added steels tested at −5°C. Furthermore, the absorbed energy after cleavage initiation of the Nb-added steel tested at −5°C was obviously larger than those of the other steels, even when tested at −25°C. As noted above, the difference in the absorbed energy after cleavage initiation at −5°C and 25°C in the Base steel can be understood to be due to temperature dependence of the toughness of the ferrite matrix itself. In contrast, the large absorbed energy after cleavage initiation of the Nb-added steel tested at −5°C implies relatively high toughness of the ferrite matrix itself and high resistance to crack propagation. In fact, dimples and slip lines, which imply the occurrence of local ductile plastic deformation, were observed in the Nb-added steel tested at −5°C. As shown in Fig. 14(d), a slip line was observed on a smooth surface which seems to be a cleaved fracture surface. It is generally unlikely that cleavage fracture and ductile fracture with dimples proceed simultaneously. This suggests that the slip deformation occurred after the cleavage fracture surface was formed. The reason why cleavage cracks stopped in Nb-added steel tested at −5°C could not be identified in this study, but it is presumed that after cleavage occurred, a part of cleavage cracks stopped to form ligaments, from which ductile fracture occurred.
It is noteworthy that the Nb-added steel exhibited a finer precipitation morphology of carbide/nitride in the ferrite matrix than the other steels (Fig. 3). The average particle diameter of the precipitates in the Nb-added steel was quantified as 0.56 μm (Table 3), and was much smaller than the diameters of the other three steels. In addition, the total contents of the stabilizing elements Nb, Ti and Zr in the precipitates were almost the same as the amounts of those elements added to the stabilized steels (Tables 1 and 2), indicating a constant volume fraction of the precipitates in each steel. The results of the quantitative analyses were in good agreement with the observed precipitation morphology (Fig. 3). The aforementioned results lead to the conclusion that, in the Nb-added steel, homogenously dispersed fine precipitates could suppress intensive stress concentration (as is considered to occur in Ti-added and Zr added steels), resulting in enhanced plastic deformation in the ferrite matrix near propagated cracks, and this enhanced plastic deformation contributed to high absorption energy in the Nb-added steel. It should be noted that only small amounts of solute stabilizing elements (Nb, Ti and Zr) were detected in the ferrite matrix in all steels (Tables 1 and 2), indicating that solute stabilizing elements had a minimal effect on mechanical properties in the present study.
In the present study, the steel sheets were treated by a simulated production process. Although a different size distribution of fine Nb-rich carbides/nitrides was found in ferrite matrix of the Nb-added steel (Fig. 3), at present, the detailed mechanisms of deformation and fracture associated with the size distribution and precipitation morphologies of carbides/nitrides still remains unclear. In order to fully understand the varied DBTTs of ferritic stainless steels depending on the types of added stabilizing elements, it will be necessary to address the varied deformation modes occurring in ferrite matrix containing fine precipitates with different sizes and distributions. An effective approach for clarifying the deformation mechanism might involve the use of a micropillar compression test focused on micron-scale single-crystals36) fabricated on the surface of the studied steel sheets with different stabilizing elements. Our future work awaits a fundamental investigation of the strength and its strain rate sensitivity of ferritic single-crystals containing fine precipitates of carbides/nitrides in terms of the thermal activation process of plastic deformation.37,38,39)
The influence of the stabilizing elements Nb, Zr and Ti on the fracture toughness of 18Cr ferritic stainless steel sheets was investigated. The important results and findings can be summarized as follows:
(1) DBTT decreased in the order of Nb-added (−3°C) > Zr-added (11°C) > Ti-added (39°C) = Base (39°C), indicating that the toughness of the steel differs depending on the stabilizing element used, even if the atomic amount of the stabilizing element is identical.
(2) Resistance to cleavage crack initiation was nearly equal in all the steels and was independent of the stabilizing element.
(3) The superior toughness of the Nb-added steel was attributed to the fact that ductile plastic deformation can occur after initiation of a cleavage crack. Because the precipitates in the Nb-added steel were fine, this ductile plastic deformation is thought to be due to strain dispersion resulting from the formation of fine and uniform voids during deformation.