Abstract
The pitting corrosion behavior of SBHS500 steel in boric-borate buffer solutions containing chloride ions was investigated by macroscale and microscale polarization, immersion tests, optical microscopy, and scanning electron microscopy. Calcium sulfide inclusions (CaS) existed in the SBHS500 steel. When the specimen was immersed in a boric-borate buffer solution (pH 8.0) containing 10 mM NaCl for 24 h at 25°C, the steel matrix was not corroded. However, partial dissolution of the CaS inclusions was observed. Pitting occurred after the wet-dry corrosion test, and calcium and sulfur were detected near the center of the pit. From the results of the microscale polarization measurements, the pitting initiation sites for the SBHS500 steel were determined to be CaS inclusions. No pitting was observed at the microscale electrode area without inclusions. In a boric-borate buffer solution containing 10 mM NaCl, the depassivation pH at the microscale electrode area without inclusions was 6.0. The depassivation at the microscale electrode area with the CaS inclusions occurred at an approximate pH of 6.6. The CaS inclusions in the SBHS500 steel were found to trigger the depassivation of the steel matrix surrounding the inclusions.
1. Introduction
Carbon steels are widely used as components in infrastructures due to their superior strength, ductility, and weldability. The practical application of high-performance steels with complicated microstructure control is currently underway. However, steel structures are exposed to the risks of corrosion damage. Proper maintenance and upkeeping of steel components necessitate elucidating the corrosion behavior in aqueous chloride solutions and atmospheric environments. The corrosion resistance of carbon steels in outdoor environments is generally evaluated by atmospheric exposure tests. This is because an accurate method of atmospheric corrosion acceleration testing for carbon steels has yet to be developed. It is also difficult to predict the corrosion behavior of carbon steels using mathematical models. It is important to systematically analyze the relationship between the microstructure and corrosion behavior for commercializing high-performance steels.
The corrosion behavior of steels is generally analyzed as average information obtained from specimen surfaces of 1 cm × 1 cm to 10 cm × 10 cm. However, in recent years, the electrochemical properties of nonmetallic inclusions, grain boundaries, and other heterogeneous parts on steel surfaces have been investigated using electrode areas of approximately 100 μm × 100 μm.1,2,3) Particularly in stainless steel, this technique has been used to elucidate the pitting corrosion mechanism at MnS inclusions and the effects of alloying elements on the corrosion process.1,2,3,4,5,6,7,8,9) The application of electrochemical measurements for microscale electrode areas is also advancing in carbon steel.10,11,12,13,14,15) For example, Kadowaki et al. analyzed the electrochemical properties of individual microstructures such as primary ferrite and pearlite in carbon steel, and they clarified the order of pitting corrosion resistance for each microstructure.14)
Sulfide inclusions, such as MnS and CaS, readily act as pitting initiation sites for carbon steels in chloride environments.16,17,18,19,20,21,22,23,24,25) Pitting corrosion resistance at sulfide inclusions tends to be lower as the inclusions become more soluble in aqueous solutions.26,27,28) This is because the dissolution of the inclusions exposes bare steel surfaces and releases sulfur species that are harmful to the corrosion resistance of the steel matrix.3,29,30,31,32,33) Even in high-performance steel, nonmetallic inclusions may be involved in the initiation of pitting corrosion. Finding the pitting initiation sites and analyzing the electrochemical properties of those sites are expected to lead to further improvements in the reliability and safety of the steels.
In this study, the pitting initiation behavior of high-performance steel for bridges SBHS500 was investigated in solutions with various pH and Cl– concentrations to find useful factors for mathematical modeling of the pitting initiation behavior. Electrochemical measurements and immersion tests on macro- and micro-scale specimen surfaces were carried out to identify the inclusions that are considered pitting initiation sites and analyze their electrochemical properties.
2. Experimental
2.1. Specimens
High-performance steel for bridges SBHS500 and pure Fe (99.99% purity) were used. The chemical composition of the SBHS500 steel is listed in Table 1. The specimen surfaces were ground using a series of SiC papers up to 1500 grit and polished by 6-μm and 1-μm diamond pastes. The specimens were finally rinsed with ethanol.
Table 1. Chemical composition of the SBHS500 steel specimens (mass%).
| C | Si | Mn | P | S | Nb | N |
|---|
| 0.10 | 0.27 | 1.47 | 0.005 | 0.002 | 0.02 | 0.003 |
Potentiodynamic anodic polarization was conducted in naturally aerated boric-borate buffer solutions (pH 8.0) at 25°C. The solutions were prepared by mixing 0.35 M H3BO3 and 75 mM Na2B4O7. To analyze pitting corrosion behavior in chloride environments, boric-borate buffer solutions with NaCl addition were prepared by mixing NaCl-added 0.35 M H3BO3 and NaCl-added 75 mM Na2B4O7. The NaCl concentrations were set at 1, 5, and 10 mM. The measurements were carried out on macroscale electrode areas of approximately 100 mm2 (approximately 1 cm × 1 cm) and microscale electrode areas of approximately 0.02 mm2 (approximately 150 μm × 150 μm). In the case of fabricating the microscale electrode area, the specimen surface was masked with resin, leaving a targeted area of approximately 0.02 mm2. The details of the electrochemical setup have been published elsewhere.5) An acrylic cell was placed on the masked specimen to preserve the solution. A small Ag/AgCl reference electrode and a Pt wire counter electrode were fixed to the acrylic cell. All of the potentials reported in this paper refer to Ag/AgCl (3.33 M KCl) electrode (0.206 V vs. standard hydrogen electrode at 25°C). The scan rate was 3.8 × 10⁻⁴ V s−1 (23 mV min−1). In the case of removing an air-formed oxide film on the specimens, the potential was swept in the anodic direction after the cathodic treatment (applying a constant potential at −1.2 V for 300 s).
2.3. Immersion Tests
The specimens were immersed in boric-borate buffer solutions containing 10 mM NaCl at 25°C for 24 h. The pH values of the solutions were set at 8.0, 7.0, and 6.5. The area exposed to the solution was approximately 100 mm2.
To analyze the effect of drying the specimen surfaces on the corrosion behavior, the specimens were immersed in a boric-borate buffer solution (pH 8.0) containing 10 mM NaCl for 24 h. Then, the specimens were removed from the solution and stored in air (25°C and 50% relative humidity) for 24 h to dry the specimen surfaces. The specimens were again immersed in the solution for 24 h.
2.4. Measurement of Depassivation pH
The open-circuit potentials were measured in a boric-borate buffer solution containing 10 mM NaCl to analyze the depassivation pH of the SBHS500 steel. The initial pH value of the solution was 8.0, and 0.1 M HCl was added for the stepwise lowering of the pH. The open-circuit potential was monitored at each pH for 600 s. The measurements were performed at 25°C under naturally aerated conditions. The electrode area was approximately 0.02 mm2.
2.5. Observation of Specimen Surfaces
An optical microscope and a field-emission scanning electron microscope (FE-SEM) equipped with an energy-dispersive X-ray spectroscopy (EDS) system were used to capture images of the specimen surfaces. The secondary electron images and the EDS maps were collected at an accelerating voltage of 20 kV. After immersion tests, photographs of the appearance of the specimen surfaces were taken by a charge-coupled device (CCD) camera.
3. Results and Discussion
3.1. Specimen Characterization
The microstructure of the SBHS500 steel was characterized by optical microscopy. Figure 1 shows optical micrographs of the specimen surfaces in the as-polished condition and after nital etching. In Fig. 1(a), the small black and gray spots are nonmetallic inclusions. Most of the inclusions were less than 5 μm in diameter. Because the inclusions are darker in color under an optical microscope than in the steel matrix, they can be discerned in the as-polished condition without etching. In Fig. 1(b), a fine-grained microstructure of SBHS500 was confirmed.

The chemical compositions of the nonmetallic inclusions were analyzed by FE-SEM/EDS. Figure 2 shows an optical micrograph, an SEM image, and the corresponding EDS maps of the inclusion. Table 2 shows the results of the quantitative analysis at points 1 and 2 in Fig. 2. The inclusion was darker than the steel matrix in the optical micrograph. In the SEM image, the inclusion consisted of a dark area (point 1) and a relatively bright area (point 2). As seen in the EDS maps, the dark part (point 1) was enriched in Ca and S, while the bright part (point 2) was enriched in Ca, Al, and O. The relative atomic ratio at point 1 was Ca:Al:S:O:Fe = 29:3:32:15:21. The relative atomic ratio at point 2 was Ca:Al:S:O:Fe = 12:19:7:50:12. Thus, the inclusions in the SBHS500 steel were determined to be mixed inclusions of Ca sulfides and Ca–Al oxides. These inclusions are referred to simply as CaS inclusions in this paper.

Table 2. Relative compositions (at.%) at points 1 and 2 in
Fig. 2 and point 3 in
Fig. 8.
| Point | S | Ca | O | Al | Mg | Fe |
|---|
| 1 | 32 | 29 | 15 | 3 | <1 | 21 |
| 2 | 7 | 12 | 50 | 19 | <1 | 12 |
| 3 | 2 | 2 | 63 | 11 | <1 | 22 |
The electrochemical properties of SBHS500 and pure Fe were compared by measuring polarization curves in a boric-borate buffer solution without NaCl addition (pH 8.0). The electrode area was approximately 100 mm2. The specimens were polarized at −1.2 V for 300 s, and then scanning in the anodic direction was started at −1.0 V. Figure 3 shows the polarization curves of SBHS500 (the red curve) and pure Fe (the black curve). The anodic current and cathodic current are shown as solid and dashed lines, respectively. In the case of pure Fe, the active region appeared from −0.44 V to 0 V, and the passive region was observed until approximately 1.5 V. For SBHS500, the active region appeared from −0.7 V to −0.44 V, and the passive region was observed until 1.0 V. The current increase near 1.0 V was attributed to oxygen evolution. At approximately −1.0 V, SBHS500 was more prone to the hydrogen evolution reaction than pure Fe. In addition, the polarization behavior in the active region from −0.7 V to 0 V is different between the two. Therefore, the effects of alloying elements and microstructure should be considered for mathematical modeling of the active dissolution rate and atmospheric corrosion behavior from the polarization curves.

Anodic polarization curves were measured using the macroscale electrode area (approximately 100 mm2) to analyze the effect of chloride ion concentration on the pitting corrosion resistance of the SBHS500 steel. Polarization was carried out in boric-borate buffer solutions with NaCl addition (pH 8.0), and the NaCl concentrations were set at 1, 5, and 10 mM. No cathodic treatment was conducted in the measurements. Figure 4 shows polarization curves and optical micrographs after polarization. Polarization was started at −0.2 V. The cathodic current flowed at the beginning of the polarization, and the anodic current was measured above approximately −0.17 V. In the boric-borate buffer solution containing 1 mM NaCl, the current gradually increased above the corrosion potential. The passive region with an almost constant current density was observed until approximately 1.0 V. The small oscillations of the current were likely attributed to metastable pitting events, and the current increase above 1.0 V was due to oxygen evolution. As shown in Figs. 4(b)–4(d), pits were observed after polarization, but the NaCl concentration of 1 mM was insufficient for the growth of pitting corrosion. In boric borate buffer solutions containing 5 mM and 10 mM NaCl, the current increased rapidly at approximately −0.1 V, and the pitting corrosion occurred.

The effect of pH on the corrosion behavior of SBHS500 steel was investigated by immersion in boric-borate buffer solutions containing 10 mM NaCl (pH values: 8.0, 7.0, and 6.5). Figure 5 shows optical micrographs of the specimens after 24 h of immersion. The inserted images are the full view of the specimen surfaces after the immersion tests. In the case of immersion in the solution with a pH of 8.0, no noticeable change was observed on the specimen surface after immersion compared to that in the as-polished condition. In the case of the solution with a pH of 7.0, pitting corrosion occurred, and the steel matrix appeared to be slightly etched. When the specimen was immersed in the solution with a pH of 6.5, the entire surface of the specimen was corroded. It was found that the SBHS500 steel immersed in boric-borate buffer solutions containing 10 mM NaCl showed good corrosion resistance at a pH of 8.0, while corrosion occurred for pH below 7.0. Therefore, the depassivation pH of the SBHS500 steel was estimated to be approximately 7.0.

Figure 6 shows an optical micrograph and an SEM image of the CaS inclusion after 24 h of immersion in boric-borate buffer solution (pH 8.0) containing 10 mM NaCl. As shown in Fig. 6(a), the color of the inclusions changed to brown after the immersion test, even though the inclusions in the as-polished condition were dark gray (see Fig. 2). The FE-SEM observation showed the partial dissolution of the inclusion, and a trench with a width of less than 0.3 μm was formed at the boundary with the steel matrix. The 24 h of immersion of the SBHS500 steel in a boric-borate buffer solution containing 10 mM NaCl at a pH of 8.0 resulted in the partial dissolution of the CaS inclusions, although no corrosion damage of the steel matrix was observed.
3.3. Pitting Initiation Caused by Drying of the Specimen Surface
To investigate the effect of specimen surface drying on the corrosion behavior of SBHS500 steel, the specimen was immersed in boric-borate buffer solution (pH 8.0) containing 10 mM NaCl for 24 h. The specimen was then dried in air at 25°C and 50% relative humidity for 24 h and subsequently immersed again in boric-borate buffer solution (pH 8.0) containing 10 mM NaCl for 24 h. Figure 7 shows an optical micrograph taken after the wet-dry corrosion test, and a full view of the specimen surface was inserted. Pitting corrosion occurred even at a pH of 8.0 by drying the specimen surface. The chloride ion concentration likely increased during the drying process of the solution, which caused the initiation of pitting corrosion. No noticeable change was observed in the other areas where pitting did not occur compared to the as-polished condition. This observation indicated that the drying of the specimen surface caused local depassivation but not the entire surface. Figure 8 shows an optical micrograph, an SEM image, and the corresponding EDS maps of the pitting initiation site. Table 2 shows the results of the quantitative analysis at point 3 in Fig. 8. In the EDS maps, O was enriched in the pitting initiation site, and small amounts of Ca, Al, and S were detected near the center of the images. The relative atomic ratio at point 3 was Ca:Al:S:O:Fe = 2:11:2:63:22. Therefore, the CaS inclusions were likely the initiation site of pitting corrosion of the SBHS500 steel in boric-borate buffer solution (pH 8.0) containing 10 mM NaCl.

Anodic polarization curves were measured using the microscale electrode area (approximately 0.02 mm2) to determine whether the CaS inclusions act as the initiation site of pitting. The solution was boric-borate buffer solution (pH 8.0) containing 10 mM NaCl. Figure 9 shows a polarization curve of the area without large inclusions and optical micrographs of the electrode area before and after polarization. No inclusions larger than 1 μm in diameter were observed in the electrode area, but small inclusions of less than 1 μm in diameter might exist. Polarization was started at −0.1 V without cathodic treatment. The cathodic current flowed at the beginning of the polarization, and the anodic current was measured above 0 V. Several current spikes measured at approximately 0.3 V were attributed to the metastable pitting events. The passive current density was measured until 1.0 V, and then the current increased due to the oxygen evolution reaction. A small pit was observed in the electrode area, implying a metastable pit. As shown in Fig. 4, the pitting potential of the SBHS500 steel was approximately −0.1 V when the macroscale electrode area (approximately 100 mm2) was used. However, in the area without large CaS inclusions, the SBHS500 steel exhibited excellent pitting corrosion resistance even in a solution containing 10 mM NaCl.

Figure 10 shows polarization curves of the area with a CaS inclusion and optical micrographs of the electrode areas before and after polarization. The black curve is the measurement in boric-borate buffer solution (pH 8.0) without NaCl addition. Although no cathodic treatment was performed, the corrosion potential was −0.3 V, and the peak anodic current, which may be the active region, was measured. After that, the current decreased to the level of the passive current density of the steel, and the current increased due to the oxygen evolution above 1.0 V. As shown in Figs. 10(b), 10(c), no pits were observed in the electrode area. Therefore, it was found that no pitting was generated in the solution without NaCl addition, even if CaS inclusions existed in the electrode area. The blue curve (Specimen 1) and the red curve (Specimen 2) in Fig. 10(a) were measured in boric-borate buffer solution (pH 8.0) containing 10 mM NaCl. In both cases, oscillations of the current were measured. For specimen 1, polarization was stopped after the rapid increase in the current at 0.2 V. For specimen 2, the current increased sharply at 0.63 V, and then the polarization was stopped. As seen in the optical micrographs after polarization, pitting corrosion was initiated at the inclusions. It is therefore determined that the CaS inclusions act as the initiation site of pitting corrosion of the SBHS500 steel in boric-borate buffer solution (pH 8.0) containing 10 mM NaCl.

Sulfide inclusions, such as MnS and CaS, readily act as pitting initiation sites for carbon steels and stainless steels.16,17,21,28) This is because the dissolution of the inclusions exposes bare steel surfaces and releases sulfur species that are harmful to the corrosion resistance of the steel matrix.2,3,29,30,31,32) As shown in Fig. 6(b), preferential dissolution at the boundary between the CaS inclusion and the steel matrix was observed. The dissolution of the inclusions resulted in the release of metal ions from the exposed bare steel surface, and the hydrolysis reaction of metal ions is thought to cause a decrease in pH. In addition, the inside of the trench (less than 0.3 μm in width) at the CaS/steel matrix boundary is occluded and thus not easily diluted by the bulk solution.2,5) Even in boric-borate buffer solutions, the pH decreases due to the hydrolysis reaction of metal ions, and sulfur species also accumulate. This is thought to cause the depassivation of the steel around the inclusions. To verify this speculation, the depassivation pH of the steel was measured.
3.5. Effect of the CaS Inclusions on Depassivation pH
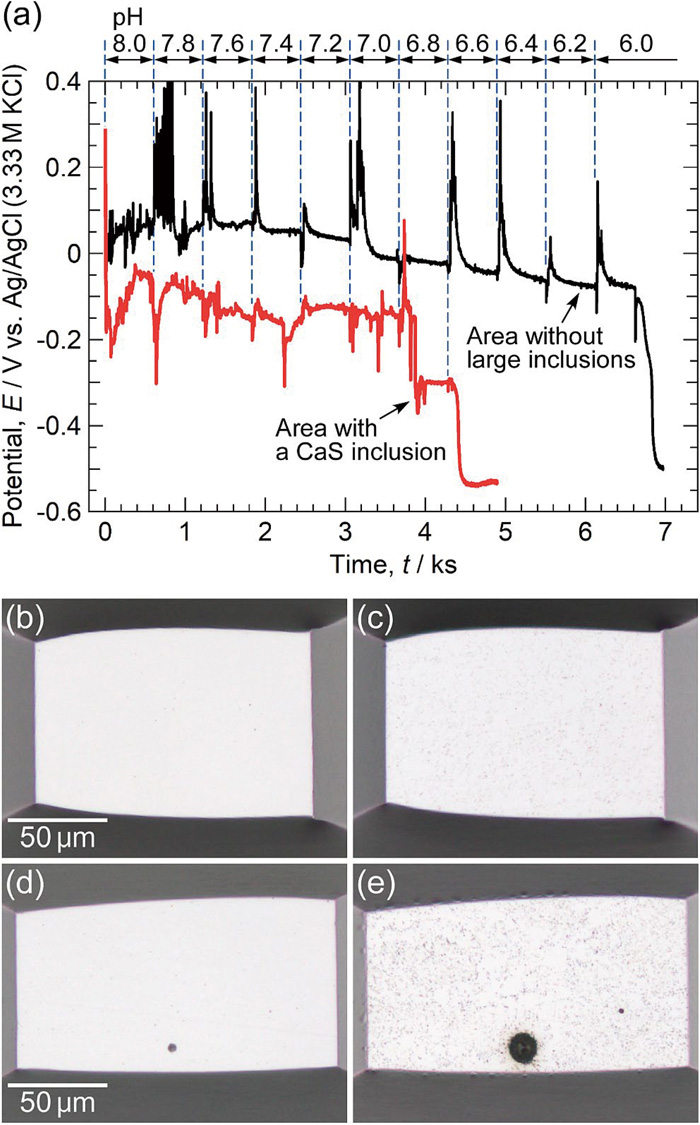
The open-circuit potential (OCP) was measured using a microscale electrode area (approximately 0.02 mm2) to analyze the effect of the CaS inclusions on the depassivation pH of the SBHS500 steel. The solution was a boric-borate buffer containing 10 mM NaCl. The initial pH value of the solution was 8.0, and 0.1 M HCl was added for the stepwise lowering of the pH. The chloride ion concentration in the solution gradually increased with the addition of 0.1 M HCl, and it became approximately 40 mM at pH 6.0. Figure 11 shows temporal variations of the OCP and optical micrographs of the electrode areas before and after the measurements. The black and red curves were measured using the electrode area without and with the CaS inclusions, respectively. The instant when the specimen was immersed in the solution was defined as 0 s. In the case of the area without large inclusions (the black curve), the OCP was approximately 0.05 V at a pH of 8.0. When HCl was added to lower the pH, the OCP oscillated significantly, but the oscillation disappeared approximately 100 s after HCl addition. The OCP was approximately 0.05 V until a pH of 7.4, and it gradually decreased below a pH of 7.2. At a pH of 6.0, the OCP dropped to −0.5 V, indicating the depassivation of the steel. As displayed in Fig. 11(c), the specimen surface after the measurement of the depassivation pH was slightly etched. As shown in the immersion test in Fig. 5 (exposed area: 100 mm2), the depassivation pH of the SBHS500 steel was estimated to be approximately 7.0. However, it was found that no depassivation occurred until a pH of 6.0 in the area without large inclusions. In the case of the area with a CaS inclusion (the red curve), the OCP between pH values of 8.0 and 7.0 was approximately −0.1 V. The oscillation of the OCP tended to continue compared to that in the area without large inclusions. The OCP dropped to −0.3 V at a pH of 6.8 and then decreased further to −0.5 V at a pH of 6.6, indicating that steel depassivation occurred. In Fig. 11(e), the area around the inclusion was deeply corroded, and the steel matrix was also etched. The depassivation pH in the area with CaS inclusions was between 6.8 and 6.6, which was higher than that in the area without inclusions. This value was close to the depassivation pH estimated from the immersion test in Fig. 5 (pH 7.0). It was suggested that the corrosion initiation behavior on the macroscale electrode area was related to the electrochemical properties of the CaS inclusions on the specimen surface.
As described above, the CaS inclusions in SBHS500 steel act as pit initiation sites in boric-borate buffer solution (pH 8.0) containing 10 mM NaCl. In the area without inclusions, no pitting corrosion occurred even in the solutions containing chloride ions. The dissolution of the CaS inclusions leads to exposure of the bare steel surface. Metal ions are released near the inclusions, resulting in a decrease in pH. Therefore, the depassivation of the steel matrix is likely to occur in the area with CaS inclusions. The sulfur species released from the inclusions are also considered to be one of the factors that induce steel depassivation. Predicting the pitting initiation behavior of carbon steel necessitates the analysis of the corrosion properties at the pitting initiation sites and the systematic investigation of the effects of alloying elements and thermomechanical processing on those properties. In this study, it is suggested that the depassivation pH at the inclusion/steel matrix boundary is a useful parameter to predict the pitting initiation behavior of carbon steels.
4. Conclusions
(1) Mixed inclusions of Ca-based sulfides and Ca–Al oxides were observed in high-performance steel for bridges SBHS500 used in this study. The SBHS500 steel and pure Fe (99.99% purity) showed different polarization behaviors near the corrosion potential in a boric-borate buffer solution (pH 8.0) without NaCl addition.
(2) The 24-h immersion of the SBHS500 steel (exposed area: 100 mm2) in a boric-borate buffer solution containing 10 mM NaCl at a pH of 8.0 resulted in the partial dissolution of the CaS inclusions, although no corrosion damage of the steel matrix was observed. Pitting corrosion occurred at a pH of 7.0, and the entire surface was corroded at a pH of 6.5. Pitting corrosion also occurred at a pH of 8.0 after drying the specimen surface and reimmersion in the solution.
(3) In the boric-borate buffer solution (pH 8.0) containing 10 mM NaCl, pitting corrosion of the SBHS500 steel was initiated at the CaS inclusions. No pitting was observed in the area without large inclusions, even in the boric-borate buffer solution (pH 8.0) containing 10 mM NaCl.
(4) The depassivation of the SBHS500 steel occurred at a pH of approximately 6.0 in the area without large inclusions. However, when CaS inclusions were present in the electrode area, the depassivation pH was between 6.8 and 6.6. The CaS inclusions in the SBHS500 steel were found to trigger the depassivation of the steel matrix surrounding the inclusions.
Acknowledgments
This work was supported by the research group for the “Optimization of Maintenance for Aging Infrastructures” at the Iron and Steel Institute of Japan.
References
- 1) T. Suter and H. Böhni: Electrochim. Acta, 47 (2001), 191. https://doi.org/10.1016/S0013-4686(01)00551-5
- 2) E. G. Webb, T. Suter and R. C. Alkire: J. Electrochem. Soc., 148 (2001), B186. https://doi.org/10.1149/1.1360205
- 3) I. Muto, A. Chiba, M. Tohjoh, Y. Sugawara and N. Hara: Tetsu-to-Hagané, 105 (2019), 207 (in Japanese). https://doi.org/10.2355/tetsutohagane.TETSU-2018-068
- 4) H. Krawiec, V. Vignal, E. Finot, O. Heintz, R. Oltra and J. M. Olive: Metall. Mater. Trans. A, 35 (2004), 3515. https://doi.org/10.1007/s11661-004-0188-3
- 5) A. Chiba, I. Muto, Y. Sugawara and N. Hara: J. Electrochem. Soc., 159 (2012), C341. https://doi.org/10.1149/2.054208jes
- 6) A. Chiba, I. Muto, Y. Sugawara and N. Hara: Mater. Trans., 55 (2014), 857. https://doi.org/10.2320/matertrans.M2014028
- 7) M. Nishimoto, I. Muto, Y. Sugawara and N. Hara: J. Electrochem. Soc., 164 (2017), C901. https://doi.org/10.1149/2.0051714jes
- 8) M. Nishimoto, I. Muto, Y. Sugawara and N. Hara: ISIJ Int., 60 (2020), 196. https://doi.org/10.2355/isijinternational.ISIJINT-2019-408
- 9) S. Tokuda, I. Muto, Y. Sugawara and N. Hara: Corros. Sci., 167 (2020), 108506. https://doi.org/10.1016/j.corsci.2020.108506
- 10) J. Shinozaki, I. Muto, T. Omura, M. Numata and N. Hara: J. Electrochem. Soc., 158 (2011), C302. https://doi.org/10.1149/1.3611405
- 11) K. Fushimi, K. Yanagisawa, T. Nakanishi, Y. Hasegawa, T. Kawano and M. Kimura: Electrochim. Acta, 114 (2013), 83. https://doi.org/10.1016/j.electacta.2013.09.162
- 12) K. Fushimi, R. Nakagawa, Y. Kitagawa and Y. Hasegawa: J. Electrochem. Soc., 166 (2019), C3409. https://doi.org/10.1149/2.0461911jes
- 13) M. Kadowaki, I. Muto, Y. Sugawara, T. Doi, K. Kawano and N. Hara: J. Electrochem. Soc., 164 (2017), C261. https://doi.org/10.1149/2.0801706jes
- 14) M. Kadowaki, I. Muto, Y. Sugawara, T. Doi, K. Kawano and N. Hara: J. Electrochem. Soc., 164 (2017), C962. https://doi.org/10.1149/2.0541714jes
- 15) Z. Lai, P. Bi, L. Wen, Y. Xue and Y. Jin: Corros. Sci., 155 (2019), 75. https://doi.org/10.1016/j.corsci.2019.04.021
- 16) S. C. Srivastava and M. B. Ives: Corrosion, 43 (1987), 687. https://doi.org/10.5006/1.3583850
- 17) I. I. Reformatskaya, I. G. Rodionova, Y. A. Beilin, L. A. Nisel’son and A. N. Podobaev: Prot. Met., 40 (2004), 447. https://doi.org/10.1023/B:PROM.0000043062.19272.c5
- 18) R. Avci, B. H. Davis, M. L. Wolfenden, I. B. Beech, K. Lucas and D. Paul: Corros. Sci., 76 (2013), 267. https://doi.org/10.1016/j.corsci.2013.06.049
- 19) T. V. Shibaeva, V. K. Laurinavichyute, G. A. Tsirlina, A. M. Arsenkin and K. V. Grigorovich: Corros. Sci., 80 (2014), 299. https://doi.org/10.1016/j.corsci.2013.11.038
- 20) I.-J. Park, S.-M. Lee, M. Kang, S. Lee and Y.-K. Lee: J. Alloy. Compd., 619 (2015), 205. https://doi.org/10.1016/j.jallcom.2014.08.243
- 21) M. Kadowaki, I. Muto, Y. Sugawara, T. Doi, K. Kawano and N. Hara: J. Electrochem. Soc., 165 (2018), C711. https://doi.org/10.1149/2.0071811jes
- 22) L. Wang, J. Xin, L. Cheng, K. Zhao, B. Sun, J. Li, X. Wang and Z. Cui: Corros. Sci., 147 (2019), 108. https://doi.org/10.1016/j.corsci.2018.11.007
- 23) M. Kadowaki, I. Muto, H. Katayama, H. Masuda, Y. Sugawara and N. Hara: Corros. Sci., 154 (2019), 159. https://doi.org/10.1016/j.corsci.2019.04.019
- 24) G. Li, L. Wang, H. Wu, C. Liu, X. Wang and Z. Cui: Corros. Sci., 174 (2020), 108815. https://doi.org/10.1016/j.corsci.2020.108815
- 25) C. Liu, X. Li, R. I. Revilla, T. Sun, J. Zhao, D. Zhang, S. Yang, Z. Liu, X. Cheng, H. Terryn and X. Li: Corros. Sci., 179 (2021), 109150. https://doi.org/10.1016/j.corsci.2020.109150
- 26) M. Nishimoto, I. Muto, Y. Sugawara and N. Hara: Zairyo-to-Kankyo, 69 (2020), 194. https://doi.org/10.3323/jcorr.69.194
- 27) M. Nishimoto, I. Muto, Y. Sugawara and N. Hara: Corros. Sci., 176 (2020), 109060. https://doi.org/10.1016/j.corsci.2020.109060
- 28) M. Nishimoto, I. Muto, Y. Sugawara and N. Hara: Corros. Sci., 180 (2021), 109222. https://doi.org/10.1016/j.corsci.2020.109222
- 29) M. Kappes, G. S. Frankel, N. Sridhar and R. M. Carranza: Corrosion, 68 (2012), 872. https://doi.org/10.5006/0610
- 30) A. Chiba, I. Muto, Y. Sugawara and N. Hara: J. Electrochem. Soc., 160 (2013), C511. https://doi.org/10.1149/2.081310jes
- 31) J.-S. Lee, Y. Kitagawa, T. Nakanishi, Y. Hasegawa and K. Fushimi: J. Electrochem. Soc., 162 (2015), C685. https://doi.org/10.1149/2.0861512jes
- 32) H. Tian, X. Wang, Z. Cui, Q. Lu, L. Wang, L. Lei, Y. Li and D. Zhang: Corros. Sci., 144 (2018), 145. https://doi.org/10.1016/j.corsci.2018.08.048
- 33) M. Nishimoto, I. Muto, Y. Sugawara and N. Hara: J. Electrochem. Soc., 166 (2019), C3081. https://doi.org/10.1149/2.0131911jes


