1. Introduction
High nitrogen martensitic stainless steel Cronidur 30 is the third-generation high performance bearing steel that successfully used in aerospace field, such as aviation turbine spindle bearing.1,2,3,4) Nitrogen makes great contribution to the excellent corrosion resistance and mechanical properties of high nitrogen martensitic stainless steel,5,6,7,8,9,10,11) and thus the nitrogen alloying is crucial in the manufacturing process.12,13) The conventional nitrogen alloying method by adding nitrided alloy would contaminate the molten steel and induce the inhomogeneous distribution of nitrogen in the ingot. Recently, the pressurized gas nitriding is considered as an advanced method with low cost, high cleanliness and nitriding rate.14) However, the precise control of nitrogen content during the pressurized gas nitriding process is still a technical challenge. It is of great significance to investigate the nitrogen solubility and gas nitriding kinetics under pressure to realize the precise control of nitrogen content in melt during the gas nitriding process under pressurized atmosphere.
A lot of studies indicated that the nitrogen solubility of metal melt under nitrogen pressure not higher than 0.1 MPa conformed well to Sieverts’ law, which described the dissolution equilibrium of diatomic gas molecules in melt. Under high pressure, the nitrogen solubility was significantly increased, but showed a negative deviation from Sieverts’ law.15) At present, only a few studies have explained or corrected the deviation.16,17,18,19,20,21) Rawers et al.17) investigated the nitrogen solubility of Fe–Cr and Fe–Cr–Ni alloy melts under high nitrogen pressure, and developed a new term to describe the combined effect of pressure and alloy composition on nitrogen solubility. However, the parameter of pressure-composition effect term
[%X]ln
P
N
2
that applied for model modification varied with the alloy system. Satir-Kolorz and Feichtinger19) conducted researches regarding the nitrogen solubility of Fe–Cr, Fe–Mn, Fe–Mo and other alloy systems under the nitrogen pressure up to 10 MPa. They pointed out that nitrogen atoms in melts with high nitrogen content exerted a mutual repressive force, and thereby the term
e
N
N
[%N]
that represented the nitrogen self-interaction was introduced to modify the nitrogen solubility model under high pressure. Jiang et al.20) further defined a new parameter
δ
N
P
to correct the deviation of nitrogen solubility from Sieverts’ law under high nitrogen pressure. Nonetheless, the experimental data of nitrogen solubility under high pressure and the studied alloy systems are not sufficient and comprehensive up to now, and the corresponding correction method is not uniform.
The researches concerning the gas nitriding kinetics of melts mainly focused on the range of low nitrogen pressure, and rarely on high pressure.22,23,24,25,26,27,28,29,30,31,32,33,34,35,36,37) Choh et al.31) conducted the study on nitrogen absorption kinetics of molten iron with low surface active element contents under atmospheric pressure. The nitrogen absorption rate was found to be determined by the nitrogen mass transfer in liquid iron boundary layer, and the nitrogen pressure hardly affected the apparent mass transfer coefficient of nitrogen in liquid phase (kN). Furthermore, the nitrogen absorption behaviors of Fe–Cr and Fe–Cr–Ni alloy melts were also investigated,32) and showed that the alloying elements Cr, Ni, Si, V and Mn had little influence on kN. Ito et al.35) determined that the nitrogen mass transfer rate constant (km) in molten iron increased with the increase of temperature, and the value of logkm had a linear relationship with the reciprocal of temperature. Besides, Takahashi et al.37) investigated the pressurized gas nitriding kinetics of high chromium steel under nitrogen partial pressure up to 0.5 MPa, and found that the value of kN was independent of nitrogen pressure. However, the effects of nitrogen pressure, temperature and alloying elements on the gas nitriding kinetics of alloy melt under pressurized atmosphere still need to be investigated in depth.
In this study, the effects of nitrogen pressure, temperature and alloy composition on the thermodynamics and kinetics of pressurized gas nitriding were systemically investigated through the gas-liquid metal nitriding equilibrium experiments of high nitrogen martensitic stainless steel Fe–Cr–Mo–C system. The nitrogen solubility model under high nitrogen pressure and the kinetic model of pressurized gas nitriding with considering pressure change in the pressurization stage were established for the accurate prediction of nitrogen content.
3. Results and Discussion
3.1. Nitrogen Solubility under Nitrogen Pressure
Figure 3 shows the variation of nitrogen content in Fe-15Cr-1Mo-0.3C alloy melts at 1853 K with time under nitrogen pressure of 0.02, 0.1, 0.41 and 2.14 MPa, respectively, and the alloy melts finally reached the nitrogen solubility under various experimental conditions. The equilibrium nitrogen content was significantly enhanced, and the nitriding rate of melt was apparently fastened under higher pressure. Furthermore, the nitrogen contents in various Fe–Cr–Mo–C alloy melts equilibrated with gas phase at different temperatures and nitrogen pressures were all obtained as listed in Table 1. It is worth mentioning that the measured oxygen and sulfur contents of the alloys in all heats are approximately 20–30 ppm, which is regarded as a low level that scarcely influenced the nitrogen dissolution behavior.

Table 1. Experimental conditions and equilibrium nitrogen contents.
| Experimental Variables | Alloy Composition (wt%) | Temperature (K) | PN2 (MPa) | Nitrogen Content (wt%) |
|---|
| Cr | Mo | C | Fe |
|---|
| PN2 | 14.98 | 1.02 | 0.31 | bal. | 1853 | 0.02 | 0.104 |
| 14.97 | 1.01 | 0.31 | bal. | 1853 | 0.05 | 0.152 |
| 15.02 | 1.02 | 0.30 | bal. | 1853 | 0.07 | 0.182 |
| 15.01 | 1.03 | 0.30 | bal. | 1853 | 0.10 | 0.213 |
| 15.00 | 1.00 | 0.30 | bal. | 1853 | 0.21 | 0.291 |
| 15.03 | 0.98 | 0.31 | bal. | 1853 | 0.30 | 0.349 |
| 14.99 | 0.99 | 0.29 | bal. | 1853 | 0.41 | 0.392 |
| 14.98 | 1.00 | 0.30 | bal. | 1853 | 0.52 | 0.430 |
| 14.98 | 1.00 | 0.30 | bal. | 1853 | 1.17 | 0.603 |
| 15.02 | 1.01 | 0.31 | bal. | 1853 | 2.14 | 0.762 |
| Temperature | 15.00 | 0.99 | 0.31 | bal. | 1823 | 0.41 | 0.405 |
| 14.99 | 0.99 | 0.29 | bal. | 1853 | 0.41 | 0.392 |
| 15.00 | 1.02 | 0.30 | bal. | 1893 | 0.41 | 0.372 |
| 15.01 | 1.01 | 0.31 | bal. | 1933 | 0.41 | 0.362 |
| [%Cr] | 12.00 | 1.00 | 0.31 | bal. | 1853 | 0.41 | 0.304 |
| 14.99 | 0.99 | 0.29 | bal. | 1853 | 0.41 | 0.392 |
| 18.02 | 1.00 | 0.32 | bal. | 1853 | 0.41 | 0.491 |
| 12.01 | 1.01 | 0.29 | bal. | 1853 | 1.17 | 0.472 |
| 14.98 | 1.00 | 0.30 | bal. | 1853 | 1.17 | 0.603 |
| 17.99 | 0.97 | 0.30 | bal. | 1853 | 1.17 | 0.745 |
| 12.03 | 1.00 | 0.29 | bal. | 1853 | 2.14 | 0.604 |
| 15.00 | 1.01 | 0.31 | bal. | 1853 | 2.14 | 0.762 |
| 18.01 | 1.01 | 0.31 | bal. | 1853 | 2.14 | 0.931 |
| [%Mo] | 15.02 | 0.00 | 0.30 | bal. | 1853 | 0.41 | 0.387 |
| 14.99 | 0.99 | 0.29 | bal. | 1853 | 0.41 | 0.392 |
| 14.98 | 2.98 | 0.30 | bal. | 1853 | 0.41 | 0.413 |
| 15.01 | 0.00 | 0.31 | bal. | 1853 | 1.17 | 0.593 |
| 14.98 | 1.00 | 0.29 | bal. | 1853 | 1.17 | 0.603 |
| 15.01 | 3.02 | 0.30 | bal. | 1853 | 1.17 | 0.632 |
| 14.98 | 0.00 | 0.30 | bal. | 1853 | 2.14 | 0.750 |
| 14.99 | 1.03 | 0.30 | bal. | 1853 | 2.14 | 0.762 |
| 15.00 | 3.01 | 0.30 | bal. | 1853 | 2.14 | 0.799 |
| [%C] | 14.97 | 1.02 | 0.00 | bal. | 1853 | 0.41 | 0.430 |
| 14.99 | 0.99 | 0.29 | bal. | 1853 | 0.41 | 0.392 |
| 15.02 | 1.01 | 1.01 | bal. | 1853 | 0.41 | 0.335 |
| 14.98 | 0.98 | 0.00 | bal. | 1853 | 1.17 | 0.652 |
| 15.00 | 1.02 | 0.32 | bal. | 1853 | 1.17 | 0.603 |
| 15.02 | 1.01 | 1.00 | bal. | 1853 | 1.17 | 0.518 |
| 14.99 | 1.00 | 0.00 | bal. | 1853 | 2.14 | 0.823 |
| 14.98 | 0.99 | 0.31 | bal. | 1853 | 2.14 | 0.762 |
| 15.00 | 1.02 | 1.01 | bal. | 1853 | 2.14 | 0.659 |
The dissolution reaction of nitrogen in metal melt is generally expressed as:
Under the experimental conditions of this study, the fugacity is equal to the nitrogen pressure.17,19,21) The equilibrium constant KN of the nitrogen dissolution reaction can be described as:
|
K
N
=
a
N
P
N
2
/
P
0
=
f
N
[%N]
P
N
2
/
P
0
| (2) |
where
KN is the equilibrium constant of
Eq. (1);
aN and
fN are the activity and Henrian activity coefficient of nitrogen, respectively, for which the reference state is the hypothetical 1 wt% N solution; [%N] is the weight percentage of dissolved nitrogen;
PN2 and
P0 are the nitrogen partial pressure in the gas phase and standard atmospheric pressure, MPa.
The nitrogen solubility of alloy melt can be expressed as:
|
log[%N]=
1
2
log
P
N
2
/
P
0
+log
K
N
-log
f
N
| (3) |
For the Fe-15Cr-1Mo-0.3C alloy melt at 1853 K, the variation of nitrogen solubility with nitrogen pressure is plotted in Fig. 4(a). The measured nitrogen solubility increased significantly with the increase of nitrogen pressure from zero to 2.14 MPa. Within the pressure range of lower than 0.1 MPa, the values of [%N] and
P
N
2
/
P
0
have an evident linear relationship, i.e. follows Sieverts’ law. However, for pressure level exceeding 0.1 MPa, the experimentally measured values exhibits an substantial negative deviation from Sieverts’ law; furthermore, the ‘deviation zone’ gets larger under higher pressure. As shown in Figs. 4(b) to 4(d), the nitrogen solubility of Fe–Cr, Fe–Mn, Fe–Cr–Ni and Fe–Cr–Mn alloy melts under high nitrogen pressure also has a negative deviation from Sieverts’ law.19)

To modify the deviation of nitrogen solubility that brought by high nitrogen pressure, considering that KN is a constant and
P
N
2
/
P
0
is the experimental condition in Eq. (3), the activity coefficient fN is what needs to be modified. In addition to the first- and second-order interaction parameters of alloying elements on nitrogen, the second-order cross-interaction parameters of alloying elements were also considered. It should be emphasized that due to the high nitrogen content, the interaction parameters of nitrogen on itself and nitrogen with alloying elements on nitrogen were also necessary to correct the deviation of nitrogen solubility under high nitrogen pressure.
Hence, the nitrogen activity coefficient can be expressed as:21)
|
log
f
N
=
e
N
N
[%N]+
r
N
N
[%N]
2
+∑
e
N
i
[%i]+
∑
r
N
i
[%i]
2
+
∑
i≠j
r
N
i,j
[%i][%j]+
∑
r
N
N,i
[%N][%i]
| (4) |
where
e
N
N
and
r
N
N
represent the first- and second-order interaction parameters of nitrogen on itself;
e
N
i
and
r
N
i
represent the first and second-order interaction parameters of alloying element
i on nitrogen;
r
N
i,j
represents the second-order cross-interaction parameter of alloying element
i with
j on nitrogen;
r
N
N,i
represents the second-order cross-interaction parameter of nitrogen with alloying element
i on nitrogen; [%
i] and [%
j] represent the weight percentages of alloying element
i and
j, respectively.
According to Eqs. (3) and (4), the nitrogen solubility of alloy melt under nitrogen pressure can be expressed as:
|
log[%N]=
1
2
log
P
N
2
/
P
0
+log
K
N
-(
e
N
N
[%N]+
r
N
N
[%N]
2
+∑
e
N
i
[%i]
+∑
r
N
i
[%i]
2
+
∑
i≠j
r
N
i,j
[%i][%j]
+∑
r
N
N,i
[%N][%i]
)
| (5) |
The temperature-dependent constant KN is:20)
|
log
K
N
=-
188
T
-1.17
| (6) |
where
T is the absolute temperature, K.
For the alloy system of this study,
log
f
N
*
can be defined as:
|
log
f
N
*
=
e
N
Cr
[%Cr]+
r
N
Cr
[%Cr]
2
+
e
N
Mo
[%Mo]+
r
N
Mo
[%Mo]
2
+
e
N
C
[%C]+
r
N
C
[%C]
2
+
r
N
Cr,C
[%Cr][%C]+
r
N
Cr,Mo
[%Cr][%Mo]
+
r
N
N,Cr
[%N][%Cr]+
r
N
N,Mo
[%N][%Mo]
| (7) |
Combining Eqs. (5) and (7), an equation regarding
e
N
N
and
r
N
N
can be obtained as:
|
log
K
N
+
1
2
log
P
N
2
/
P
0
-log[%N]-log
f
N
*
=
e
N
N
[%N]+
r
N
N
[%N]
2
| (8) |
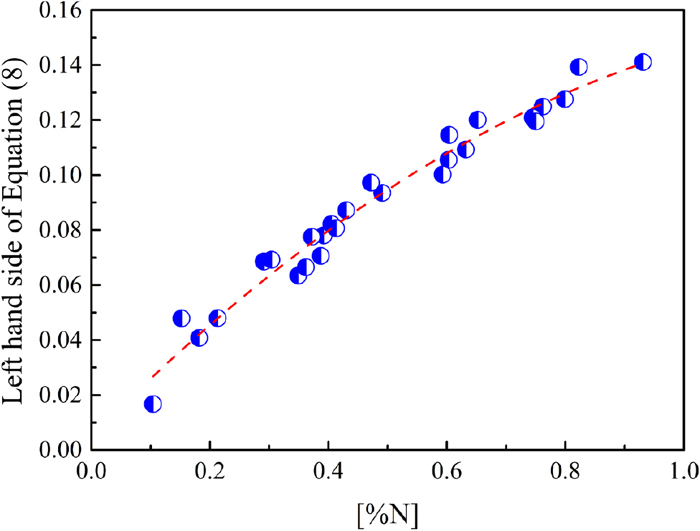
The equilibrium nitrogen content, equilibrium constant, nitrogen pressure, alloy composition, temperature, and the interaction parameters of elements on nitrogen are substituted into Eq. (8). The interaction parameters of elements on nitrogen in the Fe–Cr–Mo–C alloy system are shown in Table 2. Thus, the curves of logKN + 1/2logPN2/P0 – log[%N] –
log
f
N
*
versus [%N] for different alloy melts under nitrogen pressure from 0.02 to 2.14 MPa are obtained as depicted in Fig. 5. Therefore, the interaction parameters of nitrogen on itself were determined as
e
N
N
= 0.219 and
r
N
N
= −0.079 through regression analysis to modify the nitrogen solubility model under high nitrogen pressure. Besides, they are regarded as constants under the temperature and nitrogen pressure conditions of this study. Satir-Kolorz and Feichtinger19) obtained the first-order interaction parameter of nitrogen on itself as
e
N,1 873 K
N
= 0.13, and Takajashi et al.37) obtained the interaction parameters of nitrogen on itself as
e
N,1 873 K
N
= 0.042 and
r
N
N
= 0.0004. This work considered the second-order cross-interaction parameters to reveal the influence of high alloy contents on the nitrogen dissolution behavior, which might induce the different interaction parameters of nitrogen on itself from the literatures.
Table 2. The interaction parameters of elements on nitrogen.
| Elements |
e
N
i
|
r
N
i
|
r
N
i,j
|
r
N
N,i
|
|---|
| Cr21) | –171/T+0.043 | 0.7/T–0.0002 | – | – |
| Mo21) | –77/T+0.0257 | 0.32/T–0.000136 | – | – |
| C21) | 280/T–0.053 | –74/T+0.047 | – | – |
| Cr, C40) | – | – | 0.0024* | – |
| Cr, Mo21) | – | – | 0.6/T–0.00019 | – |
| N, Cr21) | – | – | – | 9.7/T–0.00109 |
| N, Mo21) | – | – | – | 10.7/T–0.0047 |
* Constant within 1823–1923 K
Based on Eq. (3), the nitrogen solubility of metal melt under given nitrogen pressure can be expressed as a function of temperature:
More specifically, for Fe-15Cr-1Mo-0.3C melt under nitrogen pressure of 0.41 MPa, the nitrogen pressure, alloy composition, and the interaction parameters of elements on nitrogen are substituted into Eq. (5). The parameters a and b can be expressed as follows:
|
a=-2 209.8+156.2[%N]
| (10) |
|
b=-1.486-0.198[%N]+0.079
[%N]
2
| (11) |
Meanwhile, based on the hypothetical 1 wt% N solution as reference state, the free energy of nitrogen dissolution reaction can be expressed as:42)
|
Δ
G
N
=-RTln
[%N]
P
N
2
/
P
0
=Δ
H
N
-TΔ
S
N
| (12) |
where Δ
HN is the enthalpy change of the reaction, kJ·mol
−1; Δ
SN is the entropy change of the reaction, kJ·mol
−1·K
−1;
R is the universal gas constant, 8.314 J·mol
−1·K
−1.
Then the nitrogen solubility can be re-written as:
|
log[%N]=0.434(
-
Δ
H
N
RT
+
Δ
S
N
R
+ln
P
N
2
/
P
0
)
| (13) |
It can be seen that the positive or negative sign of nitrogen dissolution enthalpy change in Eq. (13) determines that of a in Eq. (9). If the enthalpy change is negative, the nitrogen solubility would decrease as the temperature increases, which is in agreement with the thermodynamic equilibrium of exothermic reaction (Eq. (1)). At a certain nitrogen pressure, the value of a is determined by the interactions of elements on nitrogen, indicating that the influence trend of temperature on nitrogen solubility is determined by the melt composition. According to Eq. (10), the value of enthalpy change maintains negative in this study. Thus, the elevation of temperature led to the reduction in nitrogen solubility of the alloy melts.
In addition, it is worth noting that the temperature and nitrogen content related terms both exert influence on nitrogen solubility as shown in Eqs. (5) and (9), (10), (11). When the solubility of nitrogen is relatively low, the nitrogen content related terms have no significant effect on the parameters a and b. Thus, the relationship between log[%N] and 1/T still can be described as linearity as displayed in Fig. 6.
3.1.3. Alloy Composition Dependence of Nitrogen Solubility
Figure 7 demonstrates the effect of Cr, Mo and C contents on the nitrogen solubility of Fe–Cr–Mo–C alloy melt under high nitrogen pressure, and the abscissa represents the difference of element content between the studied alloys and Fe-15Cr-1Mo-0.3C alloy. It shows that the nitrogen solubility increases with the increase of Cr and Mo contents, and sharply decreases with the increase of C content. In addition, the influencing degree of these elements are in the order of C > Cr > Mo. For example, the nitrogen solubility under 2.14 MPa was increased only by 0.049 wt% through adding 3 wt% Mo, while was reduced by 0.164 wt% through adding just 1 wt% C. It is noteworthy that the values of interaction parameters of elements on nitrogen in Table 2 correspond to the experimental rules, i.e. a negative interaction parameter causes the reduction of nitrogen activity coefficient and thereby the higher nitrogen solubility, and vice versa.

The interaction parameters of elements are closely relevant to the atomic structures, which are associated with their positions in the element periodic table.43,44,45) For alloying elements (such as Cr and Mo) that locate on the left side of Fe Group, there is a strong attraction between Cr/Mo and N, which is characterized by the negative interaction parameter. The movement of N atoms towards Cr/Mo atoms could provide more space for additional N atoms, resulting in a higher nitrogen solubility.19) On the contrary, for elements like C that locate on the right side of Fe Group, there is a strong repulsive force between C and N,46,47) and thus the parameter is positive and reduces the nitrogen solubility of alloy melt.
3.1.4. Establishment of Nitrogen Solubility Model under High Pressure
On the basis of Eq. (5), the nitrogen dissolution equilibrium constant, interaction parameters of elements on nitrogen are combined to establish the nitrogen solubility model of Fe–Cr–Mo–C alloy melt under nitrogen pressure:
|
log[%N]=
1
2
log
P
N
2
/
P
0
-
188
T
-1.17
-{0.219[%N]-0.079
[%N]
2
+(-171/T+0.043)[%Cr]
+(0.7/T-0.0002)
[%Cr]
2
+(-77/T+0.0257)[%Mo]
+(0.32/T-0.000136)
[%Mo]
2
+(280/T-0.053)[%C]
+(-74/T+0.047)
[%C]
2
+0.0024[%Cr][%C]
+(0.6/T-0.00019)[%Cr][%Mo]
+(9.7/T-0.00109)[%N][%Cr]
+(10.7/T-0.0047)[%N][%Mo]}
| (14) |
Figure 8 presents the comparison between the predicted values of the model and the measured values of the Fe–Cr–Mo–C alloy systems under different temperature and nitrogen pressure conditions. The comparison proves that the values determined by the newly established model coincide well with the experimental results. Therefore, it is essential to modify the nitrogen activity coefficient by the parameters
e
N
N
and
r
N
N
to achieve higher prediction accuracy of the nitrogen solubility under high nitrogen pressure.

The correlation between the calculated and measured nitrogen solubility in various Fe–Cr–Mo–C alloy melts are summarily presented in Fig. 9. In addition to the experimental results in this work, the predicted values obtained by the current model are also consistent with the measured values of the liquid Fe–Cr binary alloys with a Cr content of 9–18 wt% and a nitrogen pressure of less than 10 MPa.19) Simultaneously, the predicted values of nitrogen solubility at low nitrogen pressure are also consistent with the measured values of liquid Fe–Cr alloys with a Cr content of less than 30 wt%.38) Therefore, it is considered that the established nitrogen solubility model of Fe–Cr–Mo–C alloy melt have the extensive applicability within a certain range of alloy composition and nitrogen pressure.
3.2. Gas Nitriding Kinetics under High Pressure
According to previous studies,22,23,24,25,26,27,28,29,30,31,32,33,34,35,36,37) the mass transfer of nitrogen in liquid phase was generally considered as the rate-determining step in the gas nitriding of metal melt, and the nitriding rate tended to obey the first-order rate equation. Assuming that the nitriding under the current experimental conditions conforms to the rule as well, the nitriding rate of melt can be expressed as:
|
d[%N]
dt
=
k
N
A
V
(
[%N]
e
-
[%N]
t
)
| (15) |
where
t is the nitriding time, s;
kN is the apparent mass transfer coefficient of nitrogen in liquid phase, cm·s
−1;
A is the gas phase-melt interface area, cm
2;
V is the volume of alloy melt, cm
3; [%N]
e is the equilibrium nitrogen content of alloy melt; and [%N]
t is the nitrogen content of alloy melt at
t.
Through integrating Eq. (15), the change of nitrogen content in the alloy melt over time during the gas nitriding process can be expressed as:
|
ln(
[%N]
e
-
[%N]
0
[%N]
e
-
[%N]
t
)
=
k
N
A
V
t
| (16) |
where [%N]
0 is the initial nitrogen content of alloy melt.
The pressurized gas nitriding process consists of two stages in practice, as presented in Fig. 10. The first stage is the pressurization stage (0–t1) characterized by a linear increase in nitrogen pressure at the rate of approximately 7–8 kPa·s−1 until the target value is reached. The second stage is the constant pressure stage (t1–t2). The variation of nitrogen pressure and duration in the pressurization stage undoubtedly create difference in the calculation of nitriding kinetics, which would be a critical consideration for the establishment of kinetic model.
3.2.1. Nitriding Rate-determining Step and Effect of Nitrogen Pressure on Nitrogen Mass Transfer
Considering that the pressurization stage of nitriding process under relatively low pressure (below 0.52 MPa) was basically accomplished within a short period of about 10–60 sec, and no obvious increase in nitrogen content was observed (Fig. 3). In this case, the difference between variable and constant pressure nitriding was not remarkable, and thereby the whole process can be regarded as constant pressure nitriding. Figure 11(a) presents the relation curves between
ln(
[%N]
e
-
[%N]
0
[%N]
e
-
[%N]
t
)
and
A
V
t
of Fe-15Cr-1Mo-0.3C alloy melt at 1853 K and nitrogen pressure from 0.02 to 0.52 MPa. The linear correlation under the above pressures can be observed, revealing that the gas nitriding rate follows Eq. (16), and is indeed dominated by the nitrogen mass transfer in liquid phase.

Furthermore, the values of kN at various nitrogen pressures by regression analysis are summarized in Fig. 11(b), where the dotted lines represent their upper and lower limits. It shows that values of kN under pressure of 0.02 to 0.52 MPa are approximately 0.0218 to 0.0230 cm·s−1, which shows a weak dependence with nitrogen pressure. Choh et al.31,32) and Takahashi et al.37) also reported that there was no dependence between the value of kN and pressure under low and high nitrogen pressure, respectively. Therefore, it can be speculated that the result may bear general applicability in the range of low pressure to even higher pressure.
3.2.2. Effect of Temperature on Nitrogen Mass Transfer
In the experiments, the power of the induction furnace was adjusted to reach the target temperature. Therefore, when the temperature was increased, the electromagnetic stirring on the alloy melt were strengthened simultaneously. The change of the apparent mass transfer rate constant should be attributed to their combined effect. The relationship between
ln(
[%N]
e
-
[%N]
0
[%N]
e
-
[%N]
t
)
and
A
V
t
of Fe-15Cr-1Mo-0.3C alloy melt within 1823 to 1933 K under electromagnetic stirring is displayed in Fig. 12. The value of kN increases with the increase of temperature and electromagnetic stirring, indicating that the elevation of temperature and electromagnetic stirring promote the apparent mass transfer coefficient of nitrogen.
3.2.3. Effect of Alloy Composition on Nitrogen Mass Transfer
Figure 13(a) describes the relationship between
ln(
[%N]
e
-
[%N]
0
[%N]
e
-
[%N]
t
)
and
A
V
t
of different Fe–Cr–Mo–C alloy melts at 1853 K and nitrogen pressure of 0.41 MPa. The addition of Cr, Mo, and C alloying elements has no significant effect on the corresponding slope of each curve. The kN obtained by regression analysis are shown in Fig. 13(b), indicating that the contents of Cr, Mo and C have little effect on apparent mass transfer coefficient of nitrogen.
3.2.4. Model Establishment of Pressurized Gas Nitriding Kinetics
For gas nitriding process with short pressurization stage, the routine kinetic model of gas nitriding expressed as Eq. (16) (named Model 1) can be directly used to predict the change of nitrogen content in alloy melt with time. But for the process with high target nitrogen pressure and long pressurization time, the effect of pressure change on nitriding rate in the pressurization stage could not be ignored. In this case, the pressurization stage and constant pressure stage should be combined in the kinetics analysis of pressurized gas nitriding.
As mentioned before, the value of kN has little dependence on nitrogen pressure. Assuming that this result is still valid under high pressure, the kN in the two nitriding stages can be regarded as a fixed value equal to that obtained from the experiments under pressure below 0.52 MPa. On the other hand, the increasing nitrogen pressure in the pressurization stage would gradually increase nitrogen solubility, thus leading to the dynamical change in the driving force of gas nitriding (i.e. the gradient in nitrogen concentration [%N]e−[%N]t). Therefore, a new model (named Model 2) considering the influence of pressurization stage was elaborated to predict the change of nitrogen content in alloy melt with time under high target nitrogen pressure.
The calculation program of Model 2 is developed according to the flow chart presented in Fig. 14. The whole nitriding process is divided into n time units (in sec). In the two nitriding stages, the function between nitrogen pressure (Pt) and time is firstly determined, and the equilibrium nitrogen content ([%N]e) at each unit time is estimated by Eq. (17). Then the nitrogen content ([%N]t) at the end of each unit time is calculated step-by-step from the starting of nitriding to the end in accordance to Eq. (18).
According to Eq. (3), the nitrogen solubility under different nitrogen pressures is expressed as:
|
log
[%N]
e
=
1
2
log
P
t
/
P
0
+log
K
N
-log
f
N
| (17) |
Besides, according to Eq. (16), the nitrogen content of alloy melt at the end of each unit time can be expressed as:
|
[%N]
t
=(
[%N]
e
(
e
k
N
At/V
-1)+
[%N]
t-1
)/
e
k
N
At/V
| (18) |
As displayed in Fig. 15, the variation of nitrogen content with time under different nitrogen pressures are obtained according to Model 1 and Model 2, respectively. Under the pressure below 0.52 MPa, the predicted results of two models both differ little from the measured ones (Fig. 15(a)). Under 1.17 MPa, the predicted results of Model 1 are higher than those measured (Fig. 15(b)). When the pressure is elevated to 2.14 MPa, the pressurization time is substantially lengthened, and the difference between predicted values by Model 1 and the measured values gets much larger. By comparison, Model 2 can more accurately predict the change of nitrogen content over time for high pressure nitriding process. Especially during the pressurization stage (i.e. the first 300 sec) in Fig. 15(c), the measured points show visible negative deviation (maximum over 0.1 wt%) from the prediction curves of Model 1, while are broadly in line with the calculated results of Model 2. The longer the pressurization stage, the greater the impact is on the gas nitriding kinetics. This result indicates that it is quite necessary and efficient to consider the change of nitrogen pressure in the pressurization stage for the kinetics calculation of high pressure gas nitriding over 0.52 MPa in practice. Moreover, the accurate prediction on the change of nitrogen content by Model 2 also proves the previous assumption that the nitrogen pressure still has no obvious effect on kN under much higher pressure.

Based on the above two models, the variation of predicted nitriding rate and nitrogen content with time in the two stages is described, as shown in Fig. 16. The value of [%N]e−[%N]t in Eq. (15) that acts as the driving force of nitrogen mass transfer is undergoing a dynamic change throughout. The [%N]e is a function of nitrogen pressure, and the value of [%N]t increases with time. In the pressurization stage, [%N]e in Model 1 is taken as a fixed value, thus the nitriding rate has a high initial value and then gradually decreases. In Model 2, [%N]e rises synchronously with nitrogen pressure, as a result, the nitriding rate increases rapidly (Fig. 16(a)). Since the nitriding rate of Model 1 at this stage is far higher than that of Model 2, the predicted nitrogen contents situate above the experimental result (Fig. 16(b)). This is the major source of the prediction errors, while is effectively avoided in Model 2. In the constant pressure stage, the nitriding rate of Model 1 and Model 2 are both gradually reduced due to the stable nitrogen pressure (Fig. 16(a)). Thus, the difference of predicted nitrogen contents between the two models gradually decreases until the thermodynamic equilibrium is achieved.