Abstract
In the present work, the dephosphorization experiments by using new double slag converter steelmaking process (NDSP) has been carried out in a 180 ton top-bottom combined blowing converter under the low temperature range of 1345–1450°C and low basicity of about 1.50. With increasing dephosphorization endpoint temperature, the dephosphorization ratio, the P2O5 content and phosphorus distribution ratio logLP first increase and then decrease. The apparent equilibrium constant  of dephosphorization reaction first increases and then decreases, and the viscosity of dephosphorization slag decreases. The average area fraction of the P-rich phase first increases and then decreases, and those of the matrix phase and the Fe-rich phase increase and decrease, respectively. The morphologies of P-rich phase change from small oval shapes to long strips, then to massive shape, and further to irregular small blocks. The value of the coefficient n in nC2S–C3P of P-rich phase first decreases from 4.8–6 to 2–4.8, then increases to 6–20. Based on ion-molecule coexistence theory (IMCT), C2S and C3P have the strongest affinities in the calcium silicate and calcium phosphate in the dephosphorization slag, respectively. Increasing the enrichment degree of C2S–C3P in the dephosphorization slag is conducive to improving the phosphorus enrichment capacity of the dephosphorization slag and dephosphorization ratio of hot metal. The changing trends of phosphorus enrichment degree in dephosphorization slag characterized by the measurement results of slag phases and the calculation results of IMCT are well consistent, indicating that the IMCT calculation results can correctly express the phosphorus enrichment degree of dephosphorization slag.
1. Introduction
In New Double Slag Converter Steelmaking Process (NDSP), desilication and dephosphorization are firstly carried out in the converter under the conditions of low temperature and low basicity. Then the dephosphorization slag with higher phosphorus content is poured out through inclining converter. After intermediate deslagging, decarburization is conducted in the same converter, and the decarburization slag is further reused for dephosphorization in the subsequent heat, which can greatly reduce the lime consumption and slag emission. The typical NDSP was developed in 2001, which was named as the multi-refining converter (MURC process).1)
Ogawa et al.1,2) carried out dephosphorization experiments in 8 ton converter for MURC process, showing that the deslagging ratio increases and the ratio of (P)/[P] decreases with increasing dephosphorization endpoint temperature (DET) in the range of 1250–1450°C when the basicity of dephosphorization slag is 1.0–1.7, with the maximum dephosphorization ratio of 86.67%. The optimization of the operation parameters was conducted in many iron and steel companies to develop the NDSP in the past twenty years.1,2,3,4,5,6,7,8,9,10,11) From a thermodynamic point of view, the lower DET between 1300–1450°C in the dephosphorization stage of NDSP is more favorable to the dephosphorization compared to the temperature range of 1600–1700°C at the end of decarburization. On the other hand, the higher DET is conductive to the intermediate deslagging. Therefore, it is necessary to study the optimal DET of NDSP.
The effect of temperature on dephosphorization of hot metal was investigated in the lower temperature range in the dephosphorization stage of NDSP in the previous works. Wang et al.3) carried out dephosphorization industrial experiment with 150 ton converter and found that when the DET is between 1387°C and 1450°C, the average dephosphorization ratio reaches 57.3%. Tian et al.9) conducted a 210 ton converter dephosphorization industrial experiment for NDSP, indicating that when the basicity of dephosphorization slag is 1.72–3.14, and the endpoint temperature of dephosphorization is 1327–1427°C, the dephosphorization ratio shows a downward trend with increasing temperature. Wu et al.10) obtained that an average dephosphorization ratio is 59% when the DET is lower than 1400°C, and the overall phosphorus distribution ratio and phosphorus capacity are increased with increasing temperature in the temperature range between 1300°C and 1700°C at hot metal dephosphorization stage in NDSP. Zhou et al.11) found that with increasing DET, dephosphorization ratio first increases and then decreases, and the optimal DET is 1400°C.
Some laboratorial researches have also been carried out on dephosphorization of hot metal at lower temperature and lower basicity. At the temperatures of 1300°C, 1350°C and 1400°C, and basicity of 0.8–1.3, Li et al.12) studied the phosphorus distribution ratio between CaO–SiO2–FeO–(Al2O3/Na2O/TiO2) slag and iron foil. With increasing temperature, the phosphorus distribution ratio decreases, and the influence of slag basicity on hot metal dephosphorization is greater than those of temperature and oxygen potential. Simeonov and Sano13) studied the equilibrium phosphorus distribution ratio between CaO–SiO2–MnO–CaF2–(BaO/Na2O) slag and carbon-saturated hot metal with high manganese content in the temperature range of 1250–1350°C. The value of (P)/[P] decreases with increasing temperature, and the value of logLP linearly decreases with increasing temperature.
In our previous works, the effect of basicity on the dephosphorization of hot metal was conducted with high temperature laboratorial experiments with the CaO–FeO–SiO2–MgO–MnO–Al2O3–P2O5 slag.14) With increasing basicity, both of dephosphorization ratio and phosphorus distribution ratio increase. At the temperature of 1380°C and the basicities of 1.73 and 1.83, the dephosphorization ratios are as high as 77.3% and 80.7%, respectively. Furthermore, effect of temperature on hot metal dephosphorization was also studied.15) With increasing temperature, dephosphorization ratio and phosphorus distribution ratio first increase and then decrease. In the temperature range of 1350–1400°C, the phosphorus in the P-rich phase mainly exists in the form of phosphorus containing solid solution (6(2CaO·SiO2)-3CaO·P2O5) (6C2S-C3P). When the temperature is increased to the range of 1425–1450°C, the phosphorus in the slag mainly exists in the form of 3CaO·P2O5 (C3P).
A lot of previous works5,6,14,15,16,17,18,19,20,21) showed that the phosphorus in hot metal is firstly oxidized to form P2O5, and reacts with CaO in slag to form C3P. Then C3P combines with C2S to form nC2S–C3P solid solution, which is stable in the slag. Our previous work6) indicated that the dephosphorization slag of NDSP is mainly composed of P-rich phase, matrix phase and Fe-rich phase. The P-rich phase mainly contains C2S–C3P solid solution, the matrix phase is mainly composed of silicate and the Fe-rich phase mainly contains Ca2Fe2O5. The enrichment path of phosphorus in dephosphorization process is inferred as the hot metal → matrix phase → Fe-rich phase → P-rich phase.
In recent years, the ion molecule coexistence theory (IMCT) has been successfully applied to the thermodynamic calculation of dephosphorization process in converter.22,23,24,25,26,27,28,29,30) Yang et al.23,24) established CaO–SiO2–MgO–MnO–FeO–Fe2O3–Al2O3–P2O5 slag thermodynamic prediction models of phosphorus distribution ratio IMCT-LP and phosphorus capacity IMCT-
C
P
O
4
3-
, respectively. The results showed that the IMCT thermodynamic model can not only accurately predict the phosphorus distribution ratio and phosphorus capacity of steelmaking slag, but also accurately predict the phosphorus distribution ratio and phosphorus capacity of each phosphorus containing component in slag, without introducing new fitting parameters. The phosphate capacity prediction model of CaO–FeO–SiO2–MgO–MnO–Al2O3–P2O5 converter slag established by Sun et al.26) and the phosphorus distribution ratio prediction model of CaO–FeO–SiO2–MgO–Fe2O3 slag established by Li et al.27) both can accurately calculate the phosphorus capacity and phosphorus distribution ratio, which can provide theoretical guidance for industrial production. The mass action concentrations of P2O5 containing components and calcium silicate were further processed mathematically, so that the enrichment contribution ratio of calcium silicate RCi and the enrichment degree of P2O5 containing components RCi-Pj were obtained.28,29,30) Xie et al.28) clarified the effects of basicity, FeO content, FeO/Fe2O3 and P2O5 content on the phosphorus enrichment contribution ratio of four kinds of calcium silicate in multiphase slag through RCi at 1350°C. Li et al.29) discussed the enrichment behavior of phosphorus in steelmaking slag of CaO–FeO–Fe2O3–SiO2–MgO at 1450–1600°C. They demonstrated that the calculated enrichment degree of P2O5 containing solid solution RC2S-C3P is in good agreement with the enrichment ratio of phosphorus from the laboratorial SEM-EDS analysis results.
According to the above literature review, the optimal temperature of dephosphorization stage in NDSP needs to be studied under the conditions of low temperature and low basicity, and the effect of temperature on dephosphorization slag mineral phase still needs to be clarified in the low temperature range. Few studies on the enrichment degree of phosphorus in the NDSP dephosphorization slag by IMCT were conducted based on the NDSP industrial experiments.
In the present work, the effect of DET on dephosphorization of hot metal was studied with the industrial experiments in 180 ton top-bottom combined blowing converter for NDSP, with the dephosphorization slag basicity of about 1.50 and the DET of 1345–1450°C. The influence of temperature on the viscosity of dephosphorization slag and the apparent equilibrium constant
K
IMCT
Θ
of dephosphorization reaction was analyzed. The morphology, area and compositions of the P-rich phase were observed and analyzed, and the coefficient n of nC2S–C3P in P-rich phase was determined in the different temperatures. Using our developed IMCT thermodynamic model,30) the effect of DET on the mass action concentration of calcium silicate and calcium phosphate, the phosphorus enrichment degree in dephosphorization slag and the phosphorus enrichment capacity of calcium silicate was studied, which was further compared with the analysis results of slag phases.
2. Industrial Experiments
The industrial experiments were carried out with a 180 ton top-bottom combined blowing converter in a steelmaking plant in China. The details of the basic operation parameters and the amount of auxiliary materials used in the industrial experiment for NDSP were described in our previous paper.30) The initial compositions of hot metals which are pre-desulfurized are shown in Table 1, and the heat numbers are T1345–T1450, which correspond to the end temperatures of dephosphorization as shown in Table 2.
Table 1. Initial compositions of hot metal (mass%).
| Heat | [C] | [Si] | [Mn] | [S] | [P] |
|---|
| T1345 | 4.65 | 0.30 | 0.20 | 0.04 | 0.149 |
| T1370 | 4.65 | 0.24 | 0.22 | 0.02 | 0.150 |
| T1380 | 4.65 | 0.30 | 0.28 | 0.01 | 0.157 |
| T1390 | 4.65 | 0.34 | 0.25 | 0.01 | 0.159 |
| T1400 | 4.65 | 0.37 | 0.33 | 0.01 | 0.138 |
| T1425 | 4.65 | 0.40 | 0.31 | 0.04 | 0.137 |
| T1450 | 4.65 | 0.39 | 0.29 | 0.03 | 0.158 |
Table 2. Chemical compositions of hot metal and dephosphorization slags at different dephosphorization endpoint temperatures (mass%).
| Heat | Chemical compositions of hot metal (mass%) | Chemical compositions of dephosphorization slags (mass%) | T (°C) |
|---|
| [C] | [Si] | [Mn] | [P] | [S] | CaO | SiO2 | MgO | MnO | FeO | P2O5 | Al2O3 |
|---|
| T1345 | 3.146 | 0.015 | 0.065 | 0.083 | 0.011 | 36.71 | 24.95 | 5.67 | 9.72 | 18.10 | 3.21 | 1.64 | 1345 |
| T1370 | 3.117 | 0.006 | 0.085 | 0.078 | 0.026 | 36.80 | 24.45 | 6.31 | 9.62 | 17.01 | 3.29 | 2.52 | 1370 |
| T1380 | 2.939 | 0.001 | 0.101 | 0.072 | 0.009 | 36.14 | 24.11 | 8.40 | 9.30 | 15.78 | 3.51 | 2.76 | 1380 |
| T1390 | 3.043 | 0.005 | 0.100 | 0.068 | 0.014 | 35.68 | 23.26 | 8.98 | 9.37 | 16.41 | 3.81 | 2.49 | 1390 |
| T1400 | 3.023 | 0.016 | 0.113 | 0.048 | 0.007 | 35.28 | 22.45 | 9.18 | 9.87 | 17.13 | 4.01 | 2.08 | 1400 |
| T1425 | 3.152 | 0.013 | 0.134 | 0.075 | 0.020 | 35.53 | 23.24 | 9.14 | 8.29 | 16.95 | 3.63 | 3.22 | 1425 |
| T1450 | 3.488 | 0.015 | 0.147 | 0.103 | 0.019 | 35.28 | 23.84 | 9.35 | 8.59 | 17.54 | 3.17 | 2.23 | 1450 |
The sampling and analysis methods of dephosphorization slag samples were also described in details in our previous papers.30,31) The chemical compositions of hot metal and dephosphorization slags at different dephosphorization endpoint temperatures are shown in Table 2. The dephosphorization slag basicity is calculated by binary basicity (B), which is expressed as Eq. (1). In order to study the effect of temperature on hot metal dephosphorization, the basicities of dephosphorization slags selected from the different heats of the NDSP experiment are as consistent as possible, with the basicities ranging from 1.47 to 1.57.
|
B=
(mass% CaO)
(mass% SiO2)
| (1) |
In our previous paper,30,31) the manufacturing processes of the slag samples were described in details. In the present work, D8 Advance X-ray powder diffractometer (XRD) of Bruker company in Germany was used to analyze the phase species of dephosphorization slags, and X-MaxN large area energy dispersive spectrometer (SEM-EDS) of Oxford Instruments Company in UK was used to analyze the different phase distributions and compositions of dephosphorization slag. The typical morphologies of the P-rich phases at the different dephosphorization endpoint temperatures were drawn, and the areas of P-rich phase at the different dephosphorization endpoint temperatures were counted with Image Pro Plus software at 1500 times.
3. Results and Discussion of Hot Metal Dephosphorization of Industrial Experiments
3.1. Effect of DET on Compositions of Hot Metal and Dephosphorization Slags
In the industrial production, it is impossible to adjust all the other parameters to be the same values to study the influence of DET on hot metal dephosphorization. In the present work, the FeO contents were between 15.78 mass% and 18.10 mass%, and the oxidation capacities of dephosphorization slags for different heats are close in values, which ensures that the FeO content has roughly the same impact on the result of hot metal dephosphorization. The MgO contents were in range of 5.67 mass% and 9.35 mass%, because increasing DET aggravated the corrosion of the converter wall so that more MgO in the furnace lining entered the slag. The contents of MnO and Al2O3 changed little, which had no obvious effect on dephosphorization. Under the above conditions, the effect of DET on the removal ratio of phosphorus, silicon and manganese in hot metal, and the phosphorus distribution ratio between dephosphorization slag and hot metal at the different dephosphorization endpoint temperatures from 1345°C to 1450°C were studied.
|
η
i
=
[mass%i]
0
-
[mass%i]
e
[mass%i]
0
×100%
| (2) |
Figure 1 shows the removal ratios of phosphorus, silicon and manganese in hot metal at different dephosphorization endpoint temperatures. The removal ratio ηi of element i in hot metal is calculated by Eq. (2). [mass%i]0 and [mass%i]e represent the mass percent of element i in the hot metal at the initial point and the endpoint of dephosphorization stage, respectively.

According to Fig. 1, with increasing DET, the dephosphorization ratio first increases and then decreases. Although the relatively low temperature is conducive to improving the thermodynamic conditions of dephosphorization, with increasing DET, the auxiliary materials gradually melt to form molten slag, and the kinetic condition is improved for dephosphorization. The dephosphorization ratio is increased by 21.1% when the temperature increased from 1345°C to 1400°C. Therefore, the dephosphorization ratio increases significantly with increasing DET before 1400°C. When the DET exceeds 1400°C, with increasing temperature, the equilibrium constant of the dephosphorization reaction is greatly reduced and the dephosphorization reaction is inhibited, resulting in a significant decrease in dephosphorization ratio. The dephosphorization ratio is decreased by 30.4% when the temperature increased from 1400°C to 1450°C.
It can be seen from Fig. 1 that with increasing DET, the demanganization ratio gradually decreases as a whole, while the desiliconization ratio does not change significantly and remains above 95%. In the temperature range of 1300–1400°C, the equilibrium constant of demanganization reaction is little affected by the temperature of hot metal.32) The oxidation ratios of other elements such as Si and C in the hot metal are greatly affected by the temperature. In the dephosphorization stage, the desiliconization reaction and the decarburization reaction proceed violently, consuming a large amount of oxidant, which inhibits the oxidation of manganese. At the same slag basicity, the higher is the temperature of hot metal, the lower is the oxidation ratio of manganese, and the higher is the manganese content in hot metal at the endpoint of dephosphorization. Therefore, the demanganization ratio gradually decreases with increasing temperature.
According to the Ellingham diagram,33) the combining affinity of Si and O is stronger than those of Mn, P and O, the desilication reaction is more likely to occur than those of the demanganization and dephosphorization reactions, so the desilication ratio always remains above 95%. At the end of dephosphorization stage, the silicon is usually removed to trace, and the DET has no obvious effect on the desilication ratio.
Figure 2 presents the effect of DET on phosphorus content in hot metal, P2O5 content in dephosphorization slag and phosphorus distribution ratio logLP. The phosphorus distribution ratio logLP is calculated with Eq. (3).
|
log
L
P
=log
(mass%P2O5)
[mass%P]
| (3) |
It can be seen from Fig. 2 that with increasing DET, the phosphorus content in hot metal firstly decreases and then increases, and both of the P2O5 content and the phosphorus distribution ratio logLP firstly increase and then decrease. This is because the gradually melting auxiliary materials in the temperature range of 1345–1400°C promote the rapid removal of phosphorus in hot metal, which leads to the increase in the P2O5 content in slag and the decrease in the phosphorus content in hot metal. Therefore, the phosphorus distribution ratio logLP between slag and hot metal increases at first. When the DET exceeds 1400°C, the dephosphorization equilibrium constant decreases rapidly to inhibit the dephosphorization reaction. The P2O5 content in slag decreases, the phosphorus content in hot metal increases, and the phosphorus distribution ratio between slag and hot metal decreases.
3.2. Effect of DET on the Viscosity of Dephosphorization Slag and the Apparent Equilibrium Constant of Dephosphorization Reaction
In dephosphorization reaction, the viscosity of dephosphorization slag can well represent the fluidity of dephosphorization slag in converter which reflects the kinetic condition of dephosphorization, and the apparent equilibrium constant K of dephosphorization reaction can represent the degree of dephosphorization reaction which reflects the thermodynamic condition of dephosphorization. Dephosphorization reaction of hot metal is expressed as Eq. (4).6,33) Because the concentration of Fe in hot metal is very high, the value of a[Fe] is assumed to be 1. According to the IMCT, the mass action concentration Ni and the activity ai both can represent the reaction ability of substances. Therefore, the Eq. (5) of the apparent equilibrium constant K of dephosphorization reaction is further obtained by using Ni instead of ai, and
K
IMCT
Θ
is used to express the apparent equilibrium constant of dephosphorization reaction calculated based on IMCT. The viscosities of dephosphorization slag at different dephosphorization endpoint temperatures were calculated by using the Viscosity part of FactSage8.0 thermodynamic calculation software.
|
2[P]+5(FeO)+3(CaO)=(3CaO⋅P2O5)+5[Fe]
| (4) |
|
K
IMCT
Θ
=
N
(3CaO⋅P2O5)
N
(CaO)
3
×
N
(FeO)
5
×
a
[P]
2
| (5) |
Figure 3 illustrates the effect of DET on the viscosity of dephosphorization slag and the apparent equilibrium constant
K
IMCT
Θ
of dephosphorization reaction. With increasing DET, the apparent equilibrium constant
K
IMCT
Θ
of dephosphorization reaction first increases and then decreases as a whole, while the viscosity of dephosphorization slag gradually decreases.

With the DET increased from 1345°C to 1400°C, the auxiliary materials such as lime are gradually melted, leading to the decrease in the viscosity of dephosphorization slag, and the overall increase in apparent equilibrium constant
K
IMCT
Θ
of dephosphorization reaction. The kinetic condition of dephosphorization in converter is improved in this temperature. Therefore, the phosphorus content in hot metal decreases, the dephosphorization ratio increases, and the P2O5 content in dephosphorization slag increases. When the DET is 1400°C, the apparent equilibrium constant of dephosphorization reaction is twice as high as that at 1345°C. The phosphorus content in hot metal decreases from 0.138 mass% to 0.048 mass%, and the dephosphorization ratio of hot metal reaches 65.2% with the phosphorus distribution ratio logLP of 1.92.
With the DET further increased to the temperature range of 1400–1450°C, although the viscosity of dephosphorization slag continues to decrease, the apparent equilibrium constant
K
IMCT
Θ
of dephosphorization reaction decreases rapidly. When the DET is 1450°C, the apparent equilibrium constant
K
IMCT
Θ
of the dephosphorization reaction is reduced by 9 times compared with that at 1400°C. The negative effect of dephosphorization caused by the deterioration of dephosphorization thermodynamic conditions is much greater than the positive effect of dephosphorization caused by the improvement of dephosphorization kinetic conditions. The dephosphorization ratio of hot metal decreases to 34.8%, the phosphorus content in hot metal increases to 0.103 mass%, and the phosphorus distribution ratio logLP between slag and hot metal decreases to 1.49. The above results indicate that the thermodynamic and kinetic conditions of dephosphorization in the converter jointly determine the result of hot metal dephosphorization.
3.3. XRD Results of the Dephosphorization Slag at Different Dephosphorization Endpoint Temperatures
Figure 4 is the XRD results of the dephosphorization slag at the dephosphorization endpoint temperatures of 1345–1450°C. As shown in Fig. 4, the dephosphorization slag mainly contains dicalcium silicate Ca2SiO4(C2S), tricalcium silicate Ca3SiO5(C3S), silicate phase Ca3Mg(SiO4)2, (Fe, Mg)2SiO4, calcium ferrite phase Ca2Fe2O5, metal oxide phase RO (including FeO, Fe2O3 and Mn3O4) and phosphorous containing solid solution nC2S-C3P(n = 20, 6), etc.

When the DET is in the range of 1345–1380°C, the phosphorus containing solid solution is 20C2S-C3P. With increasing DET, the (Fe, Mg)2SiO4 phase disappears and the intensities of C2S phase and Ca3Mg(SiO4)2 phase increases obviously. With the DET increased to 1380–1400°C, there are two kinds of phosphorus containing solid solutions of 20C2S-C3P and 6C2S-C3P in the dephosphorization slag. The coefficient n of phosphorus containing solid solution formed in this temperature range decreases, the phosphorus content in the dephosphorization slag increases, which is consistent with the actual dephosphorization results.
Between the temperatures of 1425°C and 1450°C, the phosphorus containing solid solution in dephosphorization slag turns back to be 20C2S-C3P, and the content of phosphorus in dephosphorization slag decreases. The peak intensities and the numbers of diffraction peaks of the silicate phase Ca3Mg(SiO4)2 and calcium ferrite phase Ca2Fe2O5 in the dephosphorization slag at 1450°C are increased compared to 1345–1425°C, which indicates that these two phases have the higher contents at 1450°C. Compared the XRD results at the different dephosphorization endpoint temperatures, it is found that the 20C2S-C3P always exists in the whole temperature range of 1345–1450°C, and its position locates on the left side of the highest peak, as shown in the light red shadow area in Fig. 4. The shape of the peak of 20C2S-C3P changes from the sharp peak at 1400°C to the bulging shape at 1450°C. The broadening degree of the peak increases, indicating that the particle size of 20C2S-C3P containing solid solution tends to decrease,34) and the dephosphorization capacity of dephosphorization slag decreases.
3.4. Change in Mineral Phases of Dephosphorization Slag at Different Dephosphorization Endpoint Temperatures
SEM images of dephosphorization slag at the different temperatures at 1500 times are shown in Figs. 5(a)–5(g). At each DET, five groups of phase composition data were obtained by SEM-EDS point analysis, and the results were averaged to reduce the errors caused by the element contents at the different positions in the same phase. Table 3 lists the element compositions of each phase in dephosphorization slag at different dephosphorization endpoint temperatures. Figure 5(h) shows the effect of DET on the phosphorus contents in the different phases.

Table 3. Element compositions of each phase in dephosphorization slag at different dephosphorization endpoint temperatures (mass%).
| T/(°C) | Phase | Ca | Si | Fe | P | Mg | Mn | Al | O |
|---|
| 1345 | Phase1 | 28.11 | 14.31 | 6.53 | 2.68 | 1.48 | 7.39 | 0.57 | 38.93 |
| Phase2-1 | 18.16 | 11.33 | 18.96 | 1.45 | 2.50 | 11.33 | 1.26 | 35.01 |
| Phase2-2 | 20.47 | 17.13 | 12.43 | 1.41 | 1.69 | 9.61 | 1.89 | 35.37 |
| Phase3 | 24.42 | 15.75 | 9.64 | 1.50 | 1.88 | 7.69 | 1.13 | 37.99 |
| 1370 | Phase1 | 28.46 | 14.83 | 4.04 | 2.77 | 3.04 | 5.74 | 1.39 | 39.73 |
| Phase2 | 18.00 | 14.52 | 8.06 | 1.24 | 3.58 | 10.23 | 4.61 | 39.76 |
| Phase3 | 28.09 | 14.54 | 4.87 | 1.43 | 3.84 | 4.96 | 0.46 | 41.81 |
| 1380 | Phase1 | 31.13 | 14.19 | 4.72 | 3.41 | 2.69 | 7.92 | 0.59 | 35.35 |
| Phase2 | 22.08 | 14.29 | 9.27 | 1.29 | 3.76 | 10.57 | 3.55 | 35.19 |
| Phase3 | 28.80 | 15.02 | 6.09 | 1.53 | 5.58 | 7.53 | 1.93 | 33.52 |
| 1390 | Phase1 | 36.34 | 13.00 | 0.92 | 4.27 | 2.04 | 3.84 | 0.13 | 39.46 |
| Phase2 | 21.36 | 15.73 | 7.49 | 1.33 | 4.23 | 9.21 | 2.33 | 38.32 |
| Phase3 | 27.98 | 14.78 | 3.70 | 2.02 | 3.82 | 6.49 | 1.34 | 39.87 |
| 1400 | Phase1 | 35.29 | 13.33 | 1.14 | 4.67 | 1.62 | 3.13 | 0.13 | 40.69 |
| Phase2 | 26.44 | 11.60 | 10.15 | 1.47 | 4.48 | 7.30 | 2.14 | 36.42 |
| Phase3 | 25.52 | 13.03 | 6.39 | 2.03 | 3.07 | 5.52 | 4.00 | 40.44 |
| 1425 | Phase1 | 38.83 | 13.88 | 2.11 | 3.98 | 1.50 | 3.59 | 0.14 | 35.97 |
| Phase2 | 21.90 | 10.76 | 16.65 | 0.74 | 6.74 | 7.96 | 0.62 | 34.63 |
| Phase3 | 27.31 | 15.02 | 7.60 | 0.89 | 4.04 | 5.37 | 1.49 | 38.28 |
| 1450 | Phase1 | 28.87 | 15.83 | 6.52 | 1.87 | 6.15 | 6.28 | 0.11 | 34.37 |
| Phase2 | 22.41 | 15.16 | 15.59 | 0.64 | 1.55 | 9.32 | 2.61 | 32.72 |
| Phase3-1 | 28.22 | 12.99 | 7.59 | 1.16 | 5.88 | 6.08 | 1.71 | 36.37 |
| Phase3-2 | 25.44 | 16.00 | 7.27 | 0.71 | 10.74 | 4.56 | 0.02 | 35.26 |
Combining Fig. 5(h) and Table 3, it can be seen that the gray phase 1 has the highest phosphorus content in different phases, so it is called P-rich phase 1. According to the XRD analysis results, the P-rich phase is mainly nC2S-C3P solid solution. There are bright white phase 2-1 and gray white phase 2-2 in the dephosphorization slag. SEM-EDS analysis results show that the bright white phase 2-1 and gray white phase 2-2 have the lowest phosphorus content, the content of Ca and Si is low, but the contents of Fe and Mn are relatively high. Among them, the Fe content of bright white phase 2-1 is higher than that of gray white phase 2-2. Therefore, the bright white phase 2-1 and gray white phase 2-2 are defined as Fe-rich phase 2. The corresponding phases in XRD results are mainly calcium ferrite phase Ca2Fe2O5 phase. The black phase 3 is defined as the matrix phase because of its high content of Ca and Si and small amount of phosphorus. At 1450°C, there are two matrix phases, black phase 3-1 and black gray phase 3-2, in the dephosphorization slag. The content of Mg in black gray phase 3-2 is higher than that in the black phase 3-1, because the higher temperature leads to the dissolution of MgO in the lining of BOF into the dephosphorization slag.
In Fig. 5(h), with increasing DET, the phosphorus contents in P-rich phase, Fe-rich phase and matrix phase all first increase and then decrease, among which the increased degree of phosphorus content in P-rich phase is the largest. The phosphorus contents in the different phases have the highest values in the temperature range of 1390–1400°C. When the DET is in the range of 1345–1390°C, the Fe-rich phase is in the form of thin ribbons and dendrite shape. With the DET increased to the range of 1400–1425°C, parts of the Fe-rich phases exist in petals surrounding the P-rich phase. The matrix phases exist between the P-rich phases and the Fe-rich phases in the shapes of long strips or irregular blocks. At 1450°C, the P-rich phases are scattered between the matrix phases and the Fe-rich phases.
The average areas of the different phases at the different dephosphorization endpoint temperatures were measured by Image Pro Plus software, and the errors of the ten measurements data were displayed by the error bars. Figure 6 gives the effect of DET on the average area fractions of the P-rich phase, Fe-rich phase and matrix phase. With increasing DET, the average area fraction of the P-rich phase first increases and then decreases, the average area fraction of Fe-rich phase decreases and the matrix phase increases. The rapid increase of the average area fraction of the P-rich phase from 1380°C to 1400°C can be reasonably attributed to the increase in the P2O5 content in the slag as shown in Table 2. At 1450°C, the average area fractions of the P-rich phase and Fe-rich phase are low. Because the slag melts well, the average area fraction of the matrix phase is high.
3.5. Analysis of P-rich Phase at Different Dephosphorization Endpoint Temperatures
Figure 7 shows the SEM images, typical morphologies, map scanning results and areas of P-rich phase in dephosphorization slag at different dephosphorization endpoint temperatures. When the DET is between 1345°C and 1380°C, most of the P-rich phases change from small oval shapes to long strips, with the areas between 1–91 μm2. When the DET increases to 1390–1425°C, the P-rich phases grow into blocks with smooth edges, the areas of the P-rich phases increase to between 260–1820 μm2, and the maximum area is 1820 μm2 at 1400°C. When the DET is 1450°C, no massive P-rich phases are found in the dephosphorization slag, and the P-rich phases are mostly irregular blocks, with the areas between 8–25 μm2.

At each DET, five groups of P-rich phase composition data were obtained by SEM-EDS point analysis, and the results were averaged to reduce the error caused by the element contents in the different positions of the P-rich phase. It is assumed that P2O5 in the P-rich phase exists in the form of C3P.20,35,36) According to the principle that the sum of CaO, SiO2 and P2O5 in the P-rich phase is equal to the sum of CiS and C3P in the P-rich phase, the average mass percents of CiS and C3P can be calculated. The average mass percentages of different components, CiS and C3P in P-rich phase at different dephosphorization endpoint temperatures are shown in Table 4.
Table 4. Average mass percentages of different components, C
iS and C
3P in P-rich phase at different dephosphorization endpoint temperatures (mass%).
| T/(°C) | CaO | SiO2 | FeO | P2O5 | MgO | MnO | Al2O3 | C3P | CiS(1<i<2) | C3P in CiS-C3P |
|---|
| 1345 | 39.57 | 26.38 | 7.76 | 8.97 | 2.97 | 10.77 | 3.58 | 19.58 | 55.34 | 0.261 |
| 1370 | 37.71 | 27.77 | 6.20 | 9.05 | 5.98 | 7.98 | 5.31 | 19.76 | 54.77 | 0.265 |
| 1380 | 37.69 | 26.99 | 9.38 | 11.09 | 1.54 | 9.39 | 3.92 | 24.21 | 51.56 | 0.320 |
| 1390 | 46.21 | 26.01 | 1.93 | 16.61 | 2.80 | 5.98 | 0.46 | 36.26 | 52.57 | 0.408 |
| 1400 | 45.32 | 27.22 | 2.78 | 18.80 | 2.90 | 2.87 | 0.11 | 41.04 | 50.30 | 0.449 |
| 1425 | 49.28 | 26.69 | 2.43 | 14.72 | 2.24 | 4.16 | 0.48 | 32.14 | 58.55 | 0.354 |
| 1450 | 38.07 | 28.63 | 7.66 | 5.26 | 11.30 | 7.66 | 1.42 | 11.48 | 60.48 | 0.160 |
Yang et al.15) found that phosphorus containing solid solution in dephosphorization slag may exist in the form of nC2S-C3P (n = 1, 2, 4.8, 6, 20). In the present work, the ratio of CaO/SiO2 in P-rich phase is between 1.33 and 1.85, so CiS can be approximately regarded as C2S for the further calculation. Therefore, according to the content of C3P and CiS in Table 4 , using the fitting line of nC2S-C3P (n = 1, 2, 4.8, 6, 20) as the judgment standard, the coefficient n in nC2S-C3P of P-rich phase at the different temperatures can be roughly calculated, and the enrichment degree of phosphorus in P-rich phase at the different temperatures can be further explained. Figure 8(a) is the values of coefficient n in nC2S-C3P of P-rich phase at different dephosphorization endpoint temperatures and Fig. 8(b) presents the effect of DET on the C3P content and the coefficient n of nC2S-C3P. In Fig. 8(a), the phosphorus containing solid solution at 1345–1370°C is (4.8~6)C2S-C3P. As the temperature is increased to 1380–1425°C, the phosphorus containing solid solution transforms into (2~4.8)C2S-C3P. When the temperature is further increased to 1450°C, the phosphorus containing solid solution exists in the form of (6~20)C2S-C3P.

It can be seen from Fig. 8(b) that with increasing DET, the content of C3P in P-rich phase first increases and then decreases, which is consistent with the actual dephosphorization result. The content of C3P increases to the maximum value of 41.0 mass% at 1400°C, and decreases to the minimum value of 11.5 mass% at 1450°C. With increasing DET, the coefficient n of nC2S-C3P shows a trend of first decreasing and then increasing, which indicates that the phosphorus content in the phosphorus containing solid solution first increases and then decreases. At 1400°C, the minimum value of the coefficient n of nC2S-C3P is 2.43.
4. Results, Discussion and Comparison of IMCT Thermodynamic Model
4.1. Effect of DET on Mass Action Concentration Ni of Calcium Silicate and Calcium Phosphate
Using our developed IMCT-Ni thermodynamic model,30) it is calculated that the mass action concentration of calcium silicate and calcium phosphate in dephosphorization slag under the conditions that the dephosphorization slag basicity is about 1.50 and the dephosphorization endpoint temperatures are 1345–1450°C. In the present work, four kinds of calcium silicate components CaO·SiO2(CS), C2S, 3CaO·SiO2(C3S), 3CaO·2SiO2(C3S2) and three kinds of P2O5 containing components 2CaO·P2O5(C2P), C3P and 4CaO·P2O5(C4P) are considered . For other P2O5 containing components formed in the dephosphorization slag, such as 2MgO·P2O5(M2P), 3FeO·P2O5(F3P), etc., since their mass action concentrations are less than 1×10⁻⁷, their effects on the phosphorus enrichment degree of the dephosphorization slag can be reasonably ignored.
Figure 9(a) illustrates the effect of DET on the mass action concentrations of calcium silicates NCS, NC2S, NC3S and NC3S2, and Fig. 9(b) is the effect of DET on the mass action concentrations of calcium phosphate NC2P, NC3P and NC4P. It can be seen from Fig. 9(a) that with increasing DET, NCS first decreases and then increases and NC3S first increases and then changes little. NC2S and NC3S2 decrease quickly in the temperature range of 1345–1400°C, then change little in the temperature range of 1400–1450°C. The values of NC3S and NC3S2 were 0.0014–0.0017 and 0.0031–0.0076, respectively. The values of NCS and NC2S were 1–2 orders of magnitude higher than those of NC3S and NC3S2, which were 0.041–0.062 and 0.110–0.135, respectively. Therefore, C2S is easier to be formed in dephosphorization slag than CS, C3S and C3S2.

As shown in Fig. 9(b), with increasing DET, NC2P gradually increases, while NC3P and NC4P both increase first and then decrease. The calculated value of NC2P varies from 1.938×10⁻⁶ to 3.286×10⁻⁶, the value of NC3P varies from 0.018 to 0.021, and the value of NC4P varies from 3.862×10⁻⁵ to 7.580×10⁻⁵, which indicates that C3P is the calcium phosphate with the strongest reactivity in the dephosphorization slag when the DET is between 1345°C and 1450°C.
4.2. Analysis of Phosphorus Enrichment Contribution Ratio RCi of Calcium Silicate at Different Dephosphorization Endpoint Temperatures
Phosphorus enrichment contribution ratio, RCi, is used to describe the phosphorus enrichment capacity of a certain calcium silicate in the dephosphorization slag, and the detailed derivation of RCi can be referred to in our previous article.30) Taking C2S as an example, the phosphorus enrichment contribution ratio, RC2S, can be expressed as Eq. (6):
|
R
C
2
S
=
R
C
2
S-
C
2
P
+
R
C
2
S-
C
3
P
+⋅⋅⋅⋅⋅⋅+
R
C
2
S-
M
3
P
=
∑
j=1-7
(
N
C
2
S-Pj
M
P
2
O
5
M
C
2
S-Pj
)
∑
i=1-4
j=1-7
(
N
Ci-Pj
M
P
2
O
5
M
Ci-Pj
)
| (6) |
Figure 10(a) shows the proportions of phosphorus enrichment contribution ratio RCi at different dephosphorization endpoint temperatures. From the values of different column heights in Fig. 10(a), it can be seen that the phosphorus enrichment contribution ratio of RC2S is the largest, the phosphorus enrichment contribution ratio remains above 0.63 in the temperature range of 1345–1450°C. The phosphorus enrichment contribution ratio of CS is the second largest, and the value of RCS is between 0.29 and 0.33. The sum of the phosphorus enrichment contribution ratios of CS and C2S is above 0.95, which indicates that phosphorus is mainly enriched and removed by CS and C2S. According to Fig. 10(a), the change trend of RC2S is the same as dephosphorization ratio, but the changing trend of RCS is opposite to dephosphorization ratio. Therefore, considering the proportions of RCi, it can be reasonably inferred that the increase of DET will make the phosphorus enrichment capacity of C2S first increase and then decrease. C2S is the main phosphorus enrichment calcium silicate in dephosphorization slag, so it will lead to the first increase and then decrease in hot metal dephosphorization ratio. Under the conditions that the basicity of the dephosphorization slag is about 1.50 and the dephosphorization endpoint temperatures are 1345–1450°C, the order of the phosphorus enrichment contribution ratio of the four kinds of calcium silicate is RC2S>RCS>RC3S2>RC3S.

Furthermore, the contents of P2O5 in nCS-CjP and nC2S-CjP based on IMCT and industrial measurement results were estimated. The mass fractions of CaO, SiO2 and P2O5 in the P-rich phase are analyzed by SEM-EDS, and the sum of the mass fractions of CaO, SiO2 and P2O5 represents the mass fraction of phosphorus containing components in the P-rich phase, which can be expressed as
∑
i=1-4
j=1-7
(mass%n
C
i
S-
C
j
P)
P-rich phase
. Therefore, the product of the mass fraction of phosphorus containing solid solutions
∑
i=1-4
j=1-7
(mass%n
C
i
S-
C
j
P)
P-rich phase
and the phosphorus enrichment contribution ratio of C2S is regarded as the mass fraction of
∑
j=1-7
(mass%n
C
2
S-CjP)
P-rich phase
solid solution in P-rich phase, which is calculated by Eq. (7).30)
|
∑
j=1-7
(mass%n
C
2
S-CjP)
P-rich phase
=
∑
i=1-4
j=1-7
(mass%nCiS-CjP)
P-rich phase
×
R
C
2
S
| (7) |
We assumed that CjP mainly exists as C3P. The value of coefficient n in nC2S-C3P at different temperatures is obtained according to Fig. 8(b), so that we can calculate the value of moles of nC2S-C3P in P-rich phase at different temperatures, and the calculation formula is Eq. (8). M is the relative molecular weight.
|
Mol
e
(n
C
2
S-
C
3
P)
=
(mass%n
C
2
S-
C
3
P)
P-rich phase
M
(n
C
2
S-
C
3
P)
| (8) |
Finally, the content of P2O5 in nC2S-C3P in P-rich phase can be calculated with Eq. (9). Since the sum of RCS and RC2S is greater than 0.96, the content of P2O5 in nCS-C3P can be roughly calculated by subtracting the content of P2O5 in C2S from the total content of P2O5 in P-rich phase, which is expressed as Eq. (10).
|
(mass%
P
2
O
5
)
(n
C
2
S-
C
3
P)
=Mol
e
(n
C
2
S-
C
3
P)
×
M
P
2
O
5
| (9) |
|
(mass%
P
2
O
5
)
(nCS-
C
3
P)
≈
(mass%
P
2
O
5
)
P-rich phase
-
(mass%
P
2
O
5
)
(n
C
2
S-
C
3
P)
| (10) |
In the temperature range of 1345–1450°C, the P2O5 contents in nCS-C3P and nC2S-C3P in P-rich phase are calculated to be 1.34–6.57 mass% and 3.92–12.23 mass% based on IMCT and industrial measurement results, respectively. This result indicates that the binding capacity of C2S and P2O5 is stronger than that of CS and P2O5. C2S is the calcium silicate with the strongest phosphorus enrichment capacity in dephosphorization slag.
In the previous research,37) two different forms of C2S phase have been identified from industrial converter slag, which are the crystallization of β-C2S grains, and the mixtures of β-C2S and CaO. Cédric et al.37) showed that phosphorus is incorporated into C2S structure by substituting [PO4]3− for [SiO4]4− tetrahedral group, and maintains charge compensation by forming calcium vacancy in C2S structure. When P2O5 is added to C2S, this substitution mechanism causes C2S to form a by-product of calcium silicate with a higher degree of polymerization, which leads to the higher phosphorus enrichment capacity of C2S than other calcium silicate.
The mathematical relationship between the DET and the phosphorus enrichment contribution ratios of calcium silicate is further studied by fitting lines in Figs. 10(b)–10(e). With increasing DET, RCS has a parabolic trend which first decreases and then increases, RC2S and RC3S are both parabolic relations rising first and then decreasing, while RC3S2 is in exponential decreasing. The fitting coefficients of the four trends are all greater than 0.90, and the mathematical equations between RCS, RC2S, RC3S, RC3S2 and the DET are further fitted, which are expressed as Eqs. (11), (12), (13), (14), respectively. It is worth noting that the units of T in Eqs. (11), (12), (13), (14) are °C.
|
R
CS
=-0.0418×exp(
-2×
(
(T-1 401.78)
41.99
)
2
)
+0.3314
| (11) |
|
R
C
2
S
=0.052×exp(
-2×
(
(T-1 405.33)
51.738
)
2
)
+0.633
| (12) |
|
R
C
3
S
=4.905×
10
-3
×exp(
-2×
(
(T-1 418.45)
94.82
)
2
)
+0.0044
| (13) |
|
R
C
3
S
2
=-0.01653×(
1-exp(
(T-1 348.157)
-46.764
)
)
+0.02835
| (14) |
With increasing DET from 1345°C to 1450°C, the value of RC2S increases from 0.63 at 1345°C to 0.69 at 1400°C, and then decreases to 0.65 at 1450°C. The value of RCS decreases from 0.33 at 1345°C to 0.29 at 1400°C, and then increases to 0.33 at 1450°C, while the proportions of RC3S and RC3S2 have very small values.
4.3. Effect of DET on the Phosphorus Enrichment Degree of P2O5 Containing Solid Solution
Based on the enrichment degree RCi−Pj of P2O5 containing solid solution defined by IMCT, the effect of DET on phosphorus enrichment degree of P2O5 containing solid solution in C2S in dephosphorization slag was analyzed under the conditions of low temperature range of 1345–1450°C and low basicity of 1.50.
Table 5 lists the chemical reactions for the formation of phosphorus containing components and their corresponding Gibbs free energy, including F3P, C3P and C4P theoretically generated by the reaction of FeO and CaO in slag with phosphorus in hot metal and P2O5 in dephosphorization slag, respectively. At the temperature range of dephosphorization endpoint, the presence of F3P in slag is unstable.20,28) CaO will replace FeO in F3P to form C3P. The above chemical reactions are expressed as Eqs. (15)-(21), respectively. Equation (22) is the actual Gibbs free energy of the reaction (21). Table 5 also shows the possibility of these chemical reactions in the temperature range of 1345–1450°C and their references.
|
Δ
G
F
3
P-
C
3
P
=-279 486-86.558T
+RTln(
(
N
FeO
)
3
×(
N
3CaO⋅
P
2
O
5
)
(
N
CaO
)
3
×(
N
3FeO⋅
P
2
O
5
)
)
(T/K)
| (22) |
Table 5. Chemical reactions for the formation of phosphorus containing components, their corresponding Gibbs free energy, and the possibility of these chemical reactions in the temperature range of 1345–1450°C and their references.
| No. | Reactions |
Δ
r
G
m,ci
Θ
(T/K) | Reaction Possibility | Ref. |
|---|
| (15) |
2[P]+5(FetO)+3(FeO)=(3FeO⋅P2O5)+5t[Fe]
| −552816+405.23T | × | 23 |
| (16) |
2[P]+5(FetO)+3(CaO)=(3CaO⋅P2O5)(s)+5t[Fe]
| −832302+318.67T | √ | 23 |
| (17) |
2[P]+5(FetO)+4(CaO)=(4CaO⋅P2O5)+5t[Fe]
| −783768+309.049T | √ | 23 |
| (18) |
3(FeO)+(P2O5)=(3FeO⋅P2O5)
| −430404+92.708T | √ | 23 |
| (19) |
3(CaO)+(P2O5)=(3CaO⋅P2O5)
| −709890+6.150T | √ | 23 |
| (20) |
4(CaO)+(P2O5)=(4CaO⋅P2O5)
| −661356−3.473T | √ | 23 |
| (21) |
3(CaO)+(3FeO⋅P2O5)=3(FeO)+(3CaO⋅P2O5)
| −279486−86.558T | √ | 30 |
According to Table 5, in the range of the DET from 1345°C to 1450°C, the formation of F3P through the direct reaction of phosphorus in hot metal with FeO can not occur, while C3P and C4P can be formed by the reaction of phosphorus in hot metal with CaO directly, or by the reaction of P2O5 in slag with CaO. In the DET range of NDSP, the value of
Δ
G
F
3
P-
C
3
P
is far less than 0, which indicates that F3P will spontaneously combine with free CaO in slag to form more stable C3P.
Enrichment degree RCi-Pj of solid solution containing P2O5 is used to qualitatively discuss the phosphorus enrichment degree of a certain solid solution containing P2O5 in the dephosphorization slag, and the detailed derivation of RCi-Pj can be referred to our previous article.30) Taking C2S-C3P as an example, the enrichment degree, RC2S-C3P, is expressed as Eq. (23):
|
R
C
2
S-
C
3
P
=
(
N
C
2
S-
C
3
P
M
P
2
O
5
M
C
2
S-
C
3
P
)
∑
i=1,2,3,4
j=1,2,3,4,5,6,7
(
N
Ci-Pj
M
P
2
O
5
M
Ci-Pj
)
| (23) |
Figure 11 shows the effect of DET on RC2S-C2P, RC2S-C3P, RC2S-C4P and RC2S-F3P. With increasing DET, RC2S-F3P first decreases and then increases, while RC2S-C3P first increases and then decreases. RC2S-C4P increases fastly at first then slowly, and RC2S-C2P increases fastly. The fitting coefficients of the four curves are all greater than 0.95. The changing trends of RC2S-C3P and RC2S-F3P are opposite, indicating that the increase of phosphorus enrichment degree of C2S–C3P in slag is accompanied by the decrease of phosphorus enrichment degree of C2S–F3P, because part of F3P will spontaneously change into C3P according to Eq. (22). The change trend of RC2S-C3P is consistent with the dephosphorization ratio, and the value of RC2S-C3P is two orders of magnitude larger than those of RC2S-C2P and RC2S-C4P, showing that the C2S–C3P is the main phosphorus containing solid solution in the dephosphorization slag with the largest phosphorus enrichment degree. From Fig. 11, in the dephosphorization endpoint stage of NDSP, when the dephosphorization slag basicity is about 1.50, the temperature of maximum phosphorus enrichment degree of C2S–C3P is 1400°C.

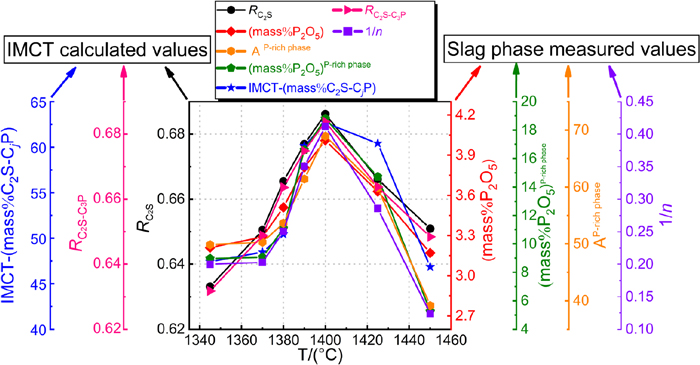
By combination of the mass fraction of C2S–CjP solid solution in P-rich phase defined by IMCT (IMCT-(mass%C2S-CjP)) in the previous study,30) the phosphorus enrichment contribution ratio RC2S of C2S and enrichment degree RC2S-C3P of C2S–C3P defined by IMCT were compared with the average area fraction of P-rich phase (AP-rich phase), reciprocal of coefficient n in nC2S–C3P of P-rich phase (1/n), P2O5 content in P-rich phase and P2O5 content in dephosphorization slag to verify the IMCT calculation results. It should be emphasized that the above expressions for the enrichment degree of phosphorus in dephosphorization slag can only be qualitatively compared, because their actual physical meaning and values are different.
Figure 12 shows the comparison between the calculation results of IMCT-(mass%C2S-CjP), RC2S and RC2S-C3P, and the measurement results of AP-rich phase, 1/n, (mass%P2O5) and (mass%P2O5)P-rich phase of the dephosphorization slags. With increasing DET, both of IMCT calculation results and experimental analysis results firstly increase and then decrease, and the changing trends of phosphorus enrichment degree in dephosphorization slag characterized by the different ways are well consistent, all reaching the maximum values at the temperature of 1400°C.
5. Conclusions
In the present work, the new double slag converter steelmaking process (NDSP) industrial experiments of dephosphorization have been carried out with a 180 ton top-bottom combined blowing converter under the conditions of low temperature range of 1345–1450°C and low basicity of about 1.50. Based on laboratory phase analysis and ion-molecule coexistence theory (IMCT), the effect of dephosphorization endpoint temperature (DET) on hot metal dephosphorization and phosphorus enrichment capacity of dephosphorization slag is studied, and the phosphorus enrichment contribution ratio of the different calcium silicates is calculated. The following conclusions are obtained:
(1) With increasing DET, the dephosphorization ratio, the P2O5 content and phosphorus distribution ratio logLP first increase and then decrease, while the phosphorus content in hot metal first decreases and then increases. The demanganization ratio gradually decreases as a whole, while the desiliconization ratio does not change significantly and remains above 95%. The a pparent equilibrium constant
K
IMCT
Θ
of dephosphorization reaction first increases and then decreases, and the viscosity of dephosphorization slag decreases. At 1400°C, the phosphorus content in hot metal decreases from 0.138 mass% to 0.048 mass%, the dephosphorization ratio of hot metal reaches 65.2%, and the phosphorus distribution ratio logLP between slag and hot metal reaches 1.92.
(2) With increasing DET, the average area fraction of the P-rich phase first increases and then decreases, and those of the matrix phase and the Fe-rich phase increase and decrease, respectively, with the phosphorus content in the different phases having the highest values in the temperature range of 1390–1400°C.
(3) With the temperature increasing from 1345°C to 1380°C, the morphologies of P-rich phase change from small oval shapes to long strips, and the areas increase from 1 to 91 μm2. In the temperature range of 1390°C–1425°C, the morphology has massive shape with the area of 260–1820 μm2. At the temperature of 1450°C, the morphology has the irregular small blocks with the area of about 15 μm2. The content of P2O5 in the P-rich phase first increases then decreases, and the value of the coefficient n in nC2S–C3P of P-rich phase first decreases from 4.8–6 to 2–4.8, then increases to 6–20.
(4) C2S and C3P have the strongest affinities of the calcium silicate and calcium phosphate in the dephosphorization slag, respectively. The phosphorus enrichment capacity in the dephosphorization slag is mainly determined by the phosphorus enrichment degree of C2S–C3P in the dephosphorization slag. When the dephosphorization slag basicity is about 1.50, the phosphorus enrichment degree of C2S–C3P has the maximum value at the temperature of 1400°C.
(5) In the temperature range of dephosphorization endpoint of NDSP, the changing trends of phosphorus enrichment degree in dephosphorization slag characterized by the measurement results of slag phases and the calculation results of IMCT are well consistent, indicating that the IMCT calculated results can correctly express the phosphorus enrichment degree of dephosphorization slag.
Acknowledgments
The work was financially supported by the National Natural Science Foundation of China (U1960202).
Nomenclatures
ηi: Removal ratio of element i in hot metal, (%);
LP: Phosphorus distribution ratio between dephosphorization slag and hot metal, (–);
a[i]: Activity of element i in hot metal, (–);
fi: Activity coefficient of element i in hot metal, (–);
K
IMCT
Θ
: Dephosphorization reaction apparent equilibrium constant K calculated based on IMCT, (–);
Ni: Mass action concentration of structural unit i or ion couple i in dephosphorization slag based on IMCT, (–);
NCi-Pj: Defined enrichment possibility of solid solution containing P2O5 based on the calculated mass action concentration Ni of complex molecule Ci and Pj, (–);
RCi-Pj: Enrichment degree of solid solution containing P2O5 based on IMCT, (–);
RCi: Phosphorus enrichment contribution ratio of calcium silicate based on IMCT, (–);
T: Temperature, (°C);
B: Binary basicity, (–);
r2: Fitting regression coefficient, (–);
ΔGA-B: Actual Gibbs free energy of A to B reaction, (J);
IMCT-(mass%C2S-CjP): Mass fraction of C2S–CiP solid solution in P-rich phase obtained by IMCT, (mass%);
AP-rich phase: Average area fraction of P-rich phase at 1500 times with 3 measurements, (%);
References
- 1) Y. Ogawa, M. Yano, S. Kitamura and H. Hirata: Tetsu-to-Hagané, 87 (2001), 21 (in Japanese). https://doi.org/10.2355/tetsutohagane1955.87.1_21
- 2) Y. Ogawa, M. Yano, S. Y. Kitamura and H. Hirata: Steel Res. Int., 74 (2003), 70. https://doi.org/10.1002/srin.200300163
- 3) Y. Wang, S. F. Yang, J. S. Li, J. Feng and F. Wang: High Temp. Mater. Process., 37 (2018), 625. https://doi.org/10.1515/htmp-2016-0250
- 4) Y. R. Fang, B. C. Huang, Z. Y. Lai, B. Y. Chen and X. F. Zeng: Steelmaking, 30 (2014), 1 (in Chinese).
- 5) G. F. Ye, J. Yang, X. W. Lu, H. Wang, W. S. Liu, R. H. Zhang and W. K. Yang: Steelmaking, 35 (2019), 16 (in Chinese).
- 6) G. F. Ye, J. Yang, R. H. Zhang, W. K. Yang and H. Sun: Int. J. Miner. Metall. Mater., 28 (2021), 66. https://doi.org/10.1007/s12613-020-2036-x
- 7) M. L. Wang and W. Y. Yang: Ironmaking Steelmaking, 47 (2020), 1127. https://doi.org/10.1080/03019233.2019.1673546
- 8) F. Y. Liu, G. C. Wang, Y. Zhao, J. W. Tan, C. M. Zhao and Q. Wang: Ironmaking Steelmaking, 46 (2019), 392. https://doi.org/10.1080/03019233.2017.1403134
- 9) Z. H. Tian, B. H. Li, X. M. Zhang and Z. H. Jiang: J. Iron Steel Res. Int., 16 (2009), 6. https://doi.org/10.1016/S1006-706X(09)60036-4
- 10) W. Wu, S. F. Dai and Y. Liu: J. Iron Steel Res. Int., 24 (2017), 908. https://doi.org/10.1016/S1006-706X(17)30133-4
- 11) C. G. Zhou, J. Li, C. B. Shi, W. T. Yu, Z. M. Zhang, Z. M. Liu and C. F. Deng: High Temp. Mater. Process., 35 (2016), 433. https://doi.org/10.1515/htmp-2014-0187
- 12) F. S. Li, X. P. Li, S. F. Yang and Y. L. Zhang: Metall. Mater. Trans. B, 48 (2017), 2367. https://doi.org/10.1007/s11663-017-1023-8
- 13) S. R. Simeonov and N. Sano: Trans. Iron Steel Inst. Jpn., 25 (1985), 1031. https://doi.org/10.2355/isijinternational1966.25.1031
- 14) W. K. Yang, J. Yang, Y. Q. Shi, Z. J. Yang, F. B. Gao, R. H. Zhang and G. F. Ye: Ironmaking Steelmaking, 48 (2021), 69. https://doi.org/10.1080/03019233.2020.1731256
- 15) W. K. Yang, J. Yang, Y. Q. Shi, Z. J. Yang, F. B. Gao, R. H. Zhang and G. F. Ye: Steel Res. Int., 92 (2021), 2000438. https://doi.org/10.1002/srin.202000438
- 16) X. Han, J. Li, C. G. Zhou, C. B. Shi, D. L. Zheng and Z. M. Zhang: Ironmaking Steelmaking, 44 (2017), 262. https://doi.org/10.1080/03019233.2016.1210371
- 17) S. Y. Kitamura, S. Saito, K. Utagawa, H. Shibata and D. G. C. Robertson: ISIJ Int., 49 (2009), 1838. https://doi.org/10.2355/isijinternational.49.1838
- 18) X. Yang, H. Matsuura and F. Tsukihashi: ISIJ Int., 49 (2009), 1298. https://doi.org/10.2355/isijinternational.49.1298
- 19) Q. F. Shu and Y. Liu: Ironmaking Steelmaking, 45 (2018), 363. https://doi.org/10.1080/03019233.2016.1274463
- 20) H. M. Zhou, Y. P. Bao and L. Lin: China Metall., 23 (2013), 45 (in Chinese).
- 21) K. I. Shimauchi, S. Y. Kitamura and H. Shibata: ISIJ Int., 49 (2009), 505. https://doi.org/10.2355/isijinternational.49.505
- 22) J. Y. Li, M. Zhang, M. Guo and X. M. Yang: Int. J. Miner. Metall. Mater., 23 (2016), 520. https://doi.org/10.1007/s12613-016-1263-7
- 23) X. M. Yang, J. P. Duan, C. B. Shi, M. Zhang, Y. L. Zhang and J. C. Wang: Metall. Mater. Trans. B, 42 (2011), 738. https://doi.org/10.1007/s11663-011-9491-8
- 24) X. M. Yang, C. B. Shi, M. Zhang, J. P. Duan and J. Zhang: Metall. Mater. Trans. B, 42 (2011), 951. https://doi.org/10.1007/s11663-011-9527-0
- 25) J. Zhang: Computational Thermodynamics of Metallurgical Melts and Solutions, Metallurgical Industry Press, Beijing, (2007), 241.
- 26) Y. H. Sun, C. L. Zhao, L. Luo and Z. C. Zhao: Chin. J. Eng., 38 (2016), 83 (in Chinese).
- 27) P. C. Li, X. M. Yang and J. Zhang: J. Univ. Sci. Technol. Beijing, 36 (2014), 1608 (in Chinese).
- 28) S. L. Xie, W. L. Wang, D. Y. Huang, H. C. Li and Y. Du: Steel Res. Int., 89 (2018), 1700317. https://doi.org/10.1002/srin.201700317
- 29) J. Y. Li, M. Zhang, M. Guo and X. M. Yang: Metall. Mater. Trans. B, 45 (2014), 1666. https://doi.org/10.1007/s11663-014-0085-0
- 30) H. Sun, J. Yang, R. H. Zhang and W. K. Yang: Metall. Mater. Trans. B, 52 (2021), 3403. https://doi.org/10.1007/s11663-021-02270-y
- 31) H. Sun, J. Yang, X. W. Lu, W. S. Liu, G. F. Ye, R. H. Zhang and W. K. Yang: Metals, 11 (2021), 1030. https://doi.org/10.3390/met11071030
- 32) C. Li, H. J. Guo and G. G. Cheng: Spec. Steel, 30 (2009), 4 (in Chinese).
- 33) X. H. Huang: Principal of Iron and Steel Metallurgy, Metallurgical Industry Press, Beijing, (2002), 513.
- 34) X. Fan: X-Ray Metallography, China Machine Press, Beijing, (1981), 141.
- 35) H. Suito and R. Inoue: ISIJ Int., 46 (2006), 180. https://doi.org/10.2355/isijinternational.46.180
- 36) R. Inoue and H. Suito: ISIJ Int., 46 (2006), 174. https://doi.org/10.2355/isijinternational.46.174
- 37) C. Duée, C. Bourgel, E. Véron, M. Allix, F. Fayon, F. Bodénan and J. Poirier: Cem. Concr. Res., 73 (2015), 207. https://doi.org/10.1016/j.cemconres.2015.03.012