1. Introduction
Since MgO–C bricks consist of simple materials, that is, periclase phase and graphite, phase transformation does not occur and the individual phases are relatively stable until high temperature. This type of brick has the advantages of excellent thermal shock resistance and high corrosion resistance to basic slag, which is particular to steelmaking slag. For this reason, MgO bricks have been applied to many facilities in the steelmaking process such as the wear lining of the converter, which is a main process in the steel works, and the wear lining at the slag line in the steelmaking ladle.1,2,3,4) In fact, MgO–C bricks have been in general use as a wear lining refractory in the steelmaking process in Japan for more than 30 years.5,6,7,8,9,10) It is known that the so-called MgO–C reaction, which is the reaction between MgO and carbon in the brick, occurs in a reducing atmosphere,11,12) and once the MgO–C reaction occurs, the pores inside the brick increase and the microstructure becomes rough, which causes a deterioration of durability. For this reason, it is important to control this reaction in order to improve the durability of the refractories and extend the life of the vessel.
The MgO–C reaction is considered to be affected by the purity of the MgO, additives, the carbon content, and the atmosphere and temperature, among other factors. Although many studies on the behaviour of the MgO–C reaction have been reported to date,13,14,15,16,17,18) this previous research could not explain the effects of all these factors on the MgO–C reaction. Therefore, the construction of a new reaction model that can comprehensively consider all the effects of factors on the reaction has been desired.
The authors investigated the effects of several factors, such as the temperature, gas flow rate and carbon content in the brick, on the MgO–C reaction rate and suggested and discussed a reaction model to explain their effects on the reaction behaviour.19) In our previous study, we constructed a MgO–C reaction model based on the unreacted core model that made it possible to explain the effects of the temperature and carbon content in the brick on the MgO–C reaction rate, and demonstrated that the MgO–C reaction behaviour could be predicted by using this model. We also found that some of the MgO–C reaction behaviour in other previous studies could be explained by applying this reaction model. However, since this reaction model could not consider the particle size distribution in the refractories, the calculation was carried out under the assumption that the brick had a homogeneous averaged particle diameter. In general, actual refractories are constituted by a wide particle size distribution from the millimetre order of aggregates to the micrometre order of fine particles according to a defining distribution formula such as Andreasen’s equation.20,21) Since these refractories, including MgO–C bricks, are characterized by this wide particle size distribution, the issue is that this reaction model should be improved in order to consider the particle size distribution. In addition, although the decrease of the particle size is predicted by this previous reaction model as a method of controlling the reaction, this prediction had not been demonstrated quantitatively.
In this study, samples of MgO–C bricks with various MgO and carbon particle size distributions were prepared, and the effects of the particle size distribution of these constituents on the MgO–C reaction were investigated in an experiment in which the bricks were heated in an inert gas atmosphere. The reaction behaviour was then discussed by using the improved reaction model based on the unreacted core model.
4. Discussion by Kinetic Reaction Model
4.1. Concept of MgO–C Reaction Model and Assumptions
Basically, the kinetic reaction model in this study was applied to the model proposed in our previous study.19) (Therefore, the detailed description of the assumptions, discussion and contents of the model have been omitted in this paper.)
The MgO–C reaction is expressed by Eq. (2).
|
MgO(s)+C(s)=CO(g)+Mg(g)
| (2) |
This reaction can be divided into the following two reactions, namely, the reduction of MgO by CO gas shown in Eq. (3) and the oxidation of carbon by CO2 gas in Eq. (4).
|
CO(g)+MgO(s)=Mg(g)+C
O
2
(g)
| (3) |
|
C
O
2
(g)+C(s)=2CO(g)
| (4) |
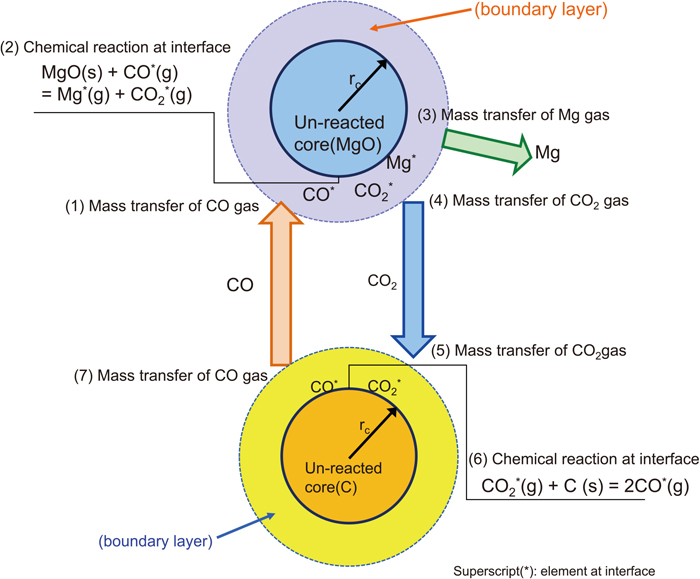
From the results of the investigation by L. Rongti et al.22,23) and other previous reports,19) the MgO–C reaction can be regarded as mainly comprising the above two reactions. In this study, the analysis of the MgO–C reaction behaviour was carried out by using the unreacted core model.24,25,26) A schematic illustration of the unreacted core model for Eqs. (3) and (4) is shown in Fig. 6. The shape of the MgO and carbon particles was assumed to be spherical. From the results of the discussion in the previous study,19) it was thought that the rate-determining step of Eqs. (3) and (4) should be regarded as the chemical reaction at the interface, and analyses of those reactions were carried out on that assumption in this study.
4.2. Formulation of Reaction Rate
Because the reduction rate of MgO and carbon was the same as in the previous study, only an outline of the reaction rate will be described here.
4.2.1. Reduction of MgO Particle Diameter
The rate of decrease of the MgO particle diameter by the reaction in Eq. (3) was considered. Equation (5) is materialized by considering the mass balance, in which the change of the molar amount accompanying the reaction is equal to the amount of the product.
|
Δ
n
MgO
=
4
3
π
r
Mg
3
C
MgO
|
t+Δt
-
4
3
π
r
Mg
3
C
MgO
|
t
=
γ
MgO
V
Mg
Δt
| (5) |
Where,
γMgO (mol/m
3/s) means the reaction rate of a MgO particle, V
Mg (m
3) means the volume of the unreacted core,
CMgO (Mol/m
3) means the molar amount of MgO and
rMg (m) means the radius of a MgO particle.
Equation (6) can be obtained by expansion of
Eq. (5), and
Eq. (7) can be obtained by a further expansion of
Eq. (6).
|
d
dt
(
4
3
π
r
Mg
3
C
MgO
)
=
γ
MgO
V
Mg
| (6) |
|
4π
r
Mg
2
C
MgO
d
r
Mg
dt
=
γ
MgO
V
Mg
| (7) |
The reaction at the surface of the unreacted core was formulated for each process according to the above-mentioned assumptions concerning the rate-determining steps. When the chemical reaction at the interface is the rate-determining step, the reaction rate can be expressed as Eq. (8).
|
-
γ
MgO
=
4π
r
Mg
2
V
Mg
⋅(
k
Mg
a
MgO
P
CO
-
k
Mg
'
P
Mg
P
C
O
2
)
| (8) |
Where,
PCO2,
PMg (atm) mean the partial pressures of CO
2 and Mg gas, respectively, and
aMgO means the activity of MgO, which is regarded as 1 in this study. Due to the assumption of a small value of the product of solubility between Mg and CO, the terms
PMgPCO2 can be considered negligible, and
Eq. (9) can be substituted for
Eq. (8).
|
-
γ
MgO
=
4π
r
Mg
2
V
Mg
⋅
k
Mg
a
MgO
P
CO
*
≅
4π
r
Mg
2
V
Mg
⋅
k
Mg
P
CO
| (9) |
Where,
kMg (m/s) means the rate constant of the reaction in
Eq. (3). Substituting
Eq. (9) into
Eq. (7) and integrating this result,
Eq. (10) can be obtained. Where,
RMg (m) means the initial radius of a MgO particle.
|
r
MgO
=
R
MgO
-
P
CO
C
MgO
k
Mg
⋅t
| (10) |
In this connection, the number of MgO particles in a refractory sample can be expressed by using RMg and the density ρ (kg/m3) and weight of the initial sample WMgO(initial) (kg).
|
W
MgO(initial)
=N⋅
ρ
MgO
⋅
4
3
π
R
MgO
3
| (11) |
Hence, the weight loss change after time Δt (s) can be calculated as shown in Eq. (12).
|
Δ
W
MgO
=N⋅
ρ
MgO
⋅
C
MgO
⋅
4
3
π(
r
MgO
3
|
t+Δt
-
r
MgO
3
|
t
)
=
W
MgO(initial)
R
MgO
3
⋅
C
MgO
⋅(
r
MgO
3
|
t+Δt
-
r
MgO
3
|
t
)
| (12) |
The cumulative weight loss change of MgO is calculated by simultaneous solution of Eqs. (10) and (12).
4.2.2. Oxidation Reaction of Carbon
The rate of decrease of the carbon particle diameter can also be considered in the same manner as that of the MgO particle diameter. Consequently, the weight loss change is calculated as shown in Eq. (13).
|
Δ
W
C
=
W
C(initial)
R
C
3
⋅
C
C
⋅(
r
C
3
|
t+Δt
-
r
C
3
|
t
)
| (13) |
Where,
|
W
C(initial)
=N⋅
ρ
C
⋅
4
3
π
R
C
3
| (14) |
Finally, the total weight loss change of the MgO–C brick can be calculated as shown in Eq. (15).
|
Δ
W
brick
=Δ
W
MgO
+Δ
W
C
| (15) |
The rate constant of the chemical reaction was derived from the Arrhenius type equation, which was written as Eq. (16). Where, k0 and E mean the rate constant and apparent activation energy, respectively. Table 3 shows the values of k0 and E used in this study. The results of the previous study shown in Table 3 were also applied in this study.
|
k=
k
0
⋅exp(
-
E
RT
)
| (16) |
Table 3. Values of parameters
kMg,
kc and E.
| kMg | kc |
|---|
| Constant | k0 (mol/m2/s/atm) | 483360 | 29502 |
| Apparent activation energy | E (kJ/mol) | 348 | 296 |
As described previously, the weight loss ratio is calculated under the conditions that all particles of MgO and carbon have a uniform size equal to the averaged diameter. However, actual refractories are characterized by a wide particle size distribution ranging from aggregates of the millimetre order to fine particles of the micrometre order according to a defining formula such as Andreasen’s equation.20,21) Therefore, in this study, the MgO–C reaction model was improved in order to consider the particle size distribution. In concrete terms, in the improved model, a statistical distribution function was combined with the unreacted core model.
P. K. Gbor et al.28) investigated the effect of the particle size distribution on the diffusion and reaction rate of particles such as Co-containing slag particles. They analysed the reaction behaviour by using a reaction model in which a Gamma distribution function is combined with the shrinkage core model to consider the particle size distribution. According to their analysis, the ratio of the unreacted substance is expressed as shown in Eq. (17).
|
X=
∑
D
{
f(
D,t
)
⋅(
%D
100
)
}
=
∫
0
∞
{
f(
D,t
)
⋅p(
D
)
}dD
| (17) |
Where, D is the particle diameter and f(D,t) is a function which represents the reaction ratio. In the present study, the MgO–C reaction model was improved referring to Gbor’s model. In the reaction rate of MgO in this study, f(D,t) is expressed as Eq. (18).
|
f(
D,t
)
=
(
1-
P
CO
C
MgO
⋅2
R
MgO
⋅
k
Mg
⋅t
)
3
| (18) |
Where, p(D) is the probability density function. Although Gbor et al. applied the Gamma function to this probability density function, Andreasen’s equation, as shown in Eq. (19), was applied to the reaction model in the present study. Where, P(D) is the cumulative probability function.
|
P(
D
)
=
(
D
D
max
)
q
| (19) |
However, since Eq. (19) represents the cumulative distribution, it is necessary to replace this equation with an equation for the incremental distribution. In this study, the incremental distribution is expressed as Eq. (20) by dividing the total distribution into n sections.
|
p(
R
)
=
(
R
n
R
max
)
q
-
(
R
n-1
R
max
)
q
| (20) |
Substituting Eqs. (18) and (20) into Eq. (17), Eq. (21) can be obtained.
|
X=
lim
n→∞
∑
l=1
n
[
(
R
l
R
max
)
q
-
(
R
l-1
R
max
)
q
f(
D,t
)
]
=
lim
n→∞
∑
l=1
n
[
(
R
l
R
max
)
q
-
(
R
l-1
R
max
)
q
{
(
1-
P
CO
C
MgO
⋅2
R
MgO
⋅
k
Mg
⋅t
)
3
}
]
| (21) |
Where, the reaction ratio function f(D,t) can be replaced as Eq. (22). Rave is the average particle diameter defined as shown in Eq. (23).
|
f(
D,t
)
=
(
1-
P
CO
C
MgO
⋅2
R
MgO
⋅
k
Mg
⋅t
)
3
=1-
Δ
W
MgO
/
W
MgO
=1-
1
R
ave
3
⋅
C
MgO
⋅
4
3
π(
R
ave
3
-
r
MgO
3
)
| (22) |
|
R
ave
=
R
l
+
R
l-1
2
| (23) |
Finally, the weight loss ratio of MgO can be expressed as Eq. (24)
|
1-X≈
∑
l=1
n
[
(
R
l
R
max
)
q
-
(
R
l-1
R
max
)
q
{
1
R
ave
3
⋅
C
MgO
⋅
4
3
π(
R
ave
3
-
r
MgO
3
)
}
]
| (24) |
A similar extraction was carried out for the oxidation rate of carbon shown in Eq. (4).
4.4. Calculation Result by Improved Reaction Model
The weight loss ratio was calculated by applying the above-mentioned experimental conditions and sample conditions to the improved reaction model, and the MgO–C reaction behaviour was analysed. The particle distribution of MgO was divided into 4 sections according to the actual distribution. Hence, number of sections n = 4. For the particle radius distribution of MgO in this study, the intermediate radius in each of these 4 sections was applied to the calculation (R1: 2.0 mm, R2: 1.0 mm, R3: 0.25 mm, R4: 0.0375 mm). However, if the calculation result did not correspond to experimental results under the condition of R4 = 0.0375 mm, R4 was changed as a fitting parameter. The particle radius of carbon was assumed as RC = 0.09 mm for Samples MC, CC and FC, and RC = 0.0025 mm was assumed for Sample MF. Here, from Eqs. (3) and (4), it can be thought that the reduction rate of MgO is equal to the consumption rate of CO, and it can also be thought that the consumption rate of CO is equal to the formation and consumption rate of CO2 and the consumption rate of CO2 is equal to the consumption rate of carbon. Therefore, it can be thought that the reduction rate of MgO is equal to the consumption rate of carbon.
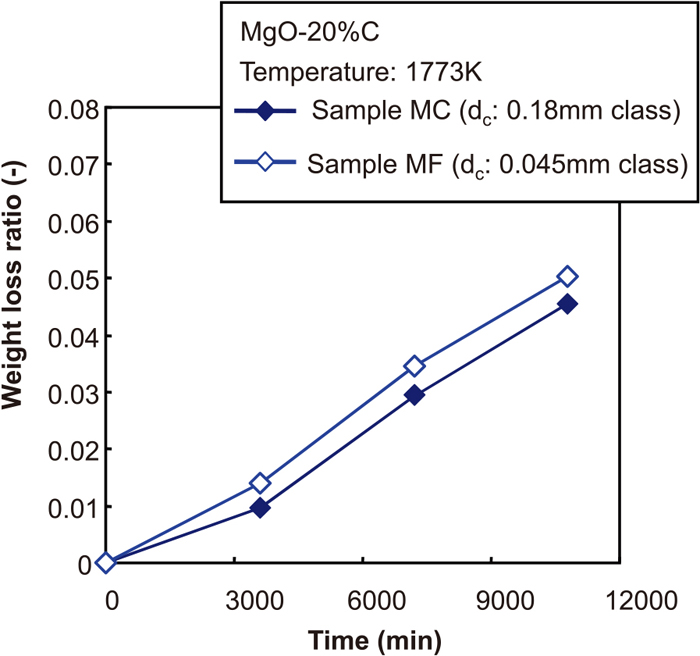
Furthermore, in this study, the overall reaction rates of both MgO and carbon can be expressed by the product of the reaction rate and probability distribution function, as discussed in Section 4.3, and the probability distribution is expressed by Andreasen’s equation. Since this probability distribution corresponds to the reaction rate, the reaction rate for each particle size follows the Andreasen distribution equation. For the above reasons, it was also assumed that the ratio of oxidation of carbon shown in Eq. (4) corresponds to the ratio of MgO in each section. The other calculation conditions were the same as in the previous model. As the result of applying the improved reaction model, Figs. 7 and 8 show the comparison of the weight loss ratio in the calculation results and experimental results for Samples MC and MF, respectively. The calculation results showed a good correspondence with the experimental results.
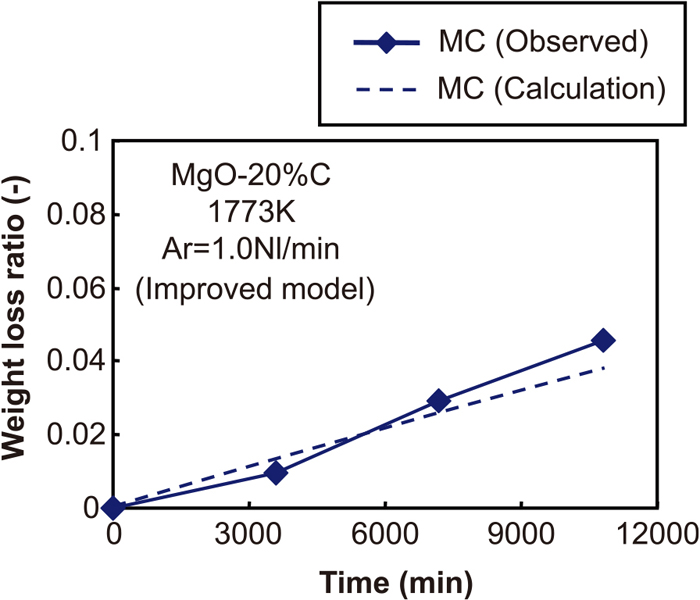

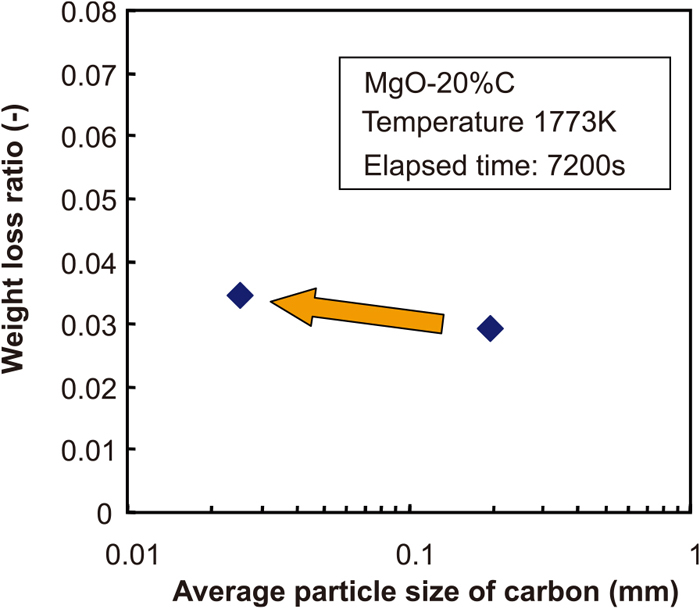
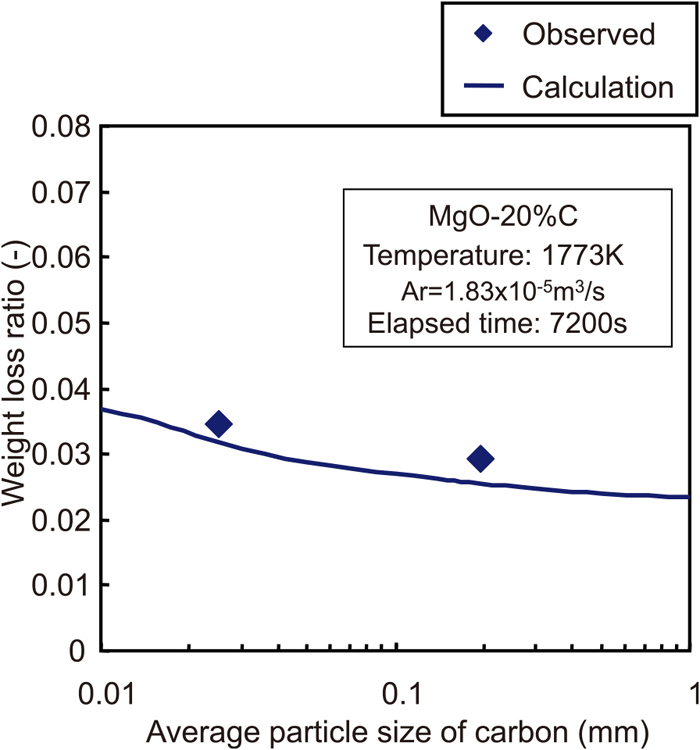
Figure 9 shows the relationship between the weight loss ratio and the average particle diameter of carbon. Although the calculation results showed a slightly lower value than the experimental results, the tendency of the change of the weight loss ratio to the change of the carbon particle diameter in the calculation results was quite similar to that in the experimental results, showing that the effect of the carbon particle diameter on the MgO–C reaction can be explained quantitatively by applying this improved model. In addition, from the result of the calculation by improved reaction model, the effect of the carbon particle diameter on the MgO–C reaction behaviour is predicted to be relatively small. For example, assuming that the carbon particle diameter decreases from 1 mm to 0.01 mm, the increment of the weight loss ratio will be at most 25% in the calculation. It could be said that this result was almost similar to the calculation result which was discussed in the previous paper.
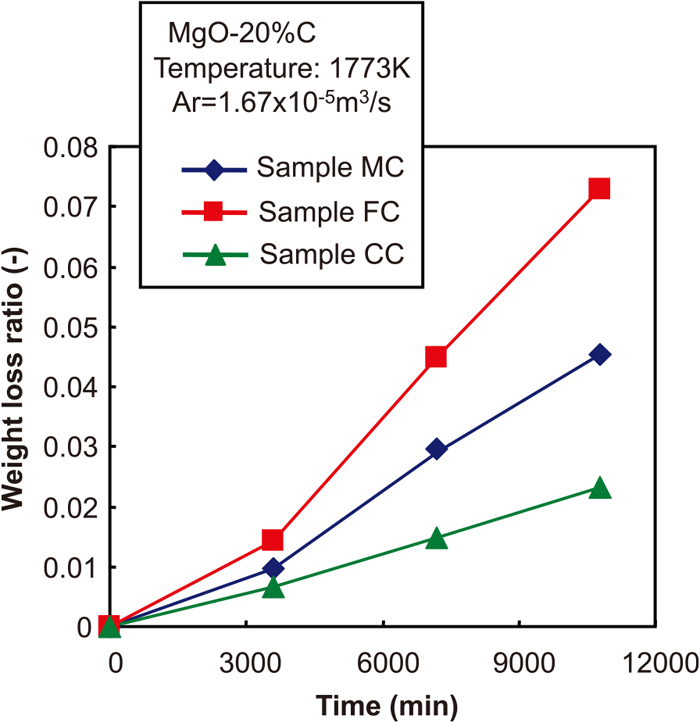
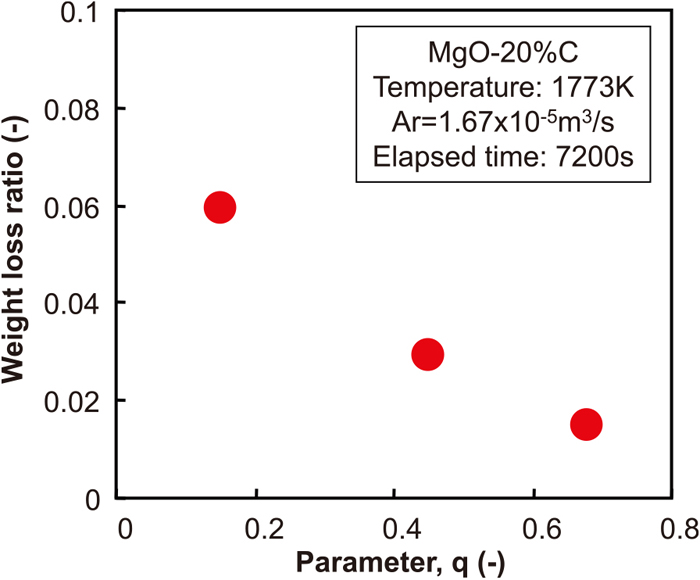
Figures 10 and 11 show the comparison of the weight loss ratio in the calculation results and experimental results for Samples CC and FC, respectively. Although the calculation results were similar to the experimental results for Sample CC (Fig. 10), the calculation results were much larger than the experimental results for Sample FC (Fig. 11). Therefore, parameter fitting was attempted by changing the value of the fine particle radius R4 as a parameter. As a result, it was found that the calculation results corresponded to the experimental results when the value of R4 was assumed as 0.0875 mm.

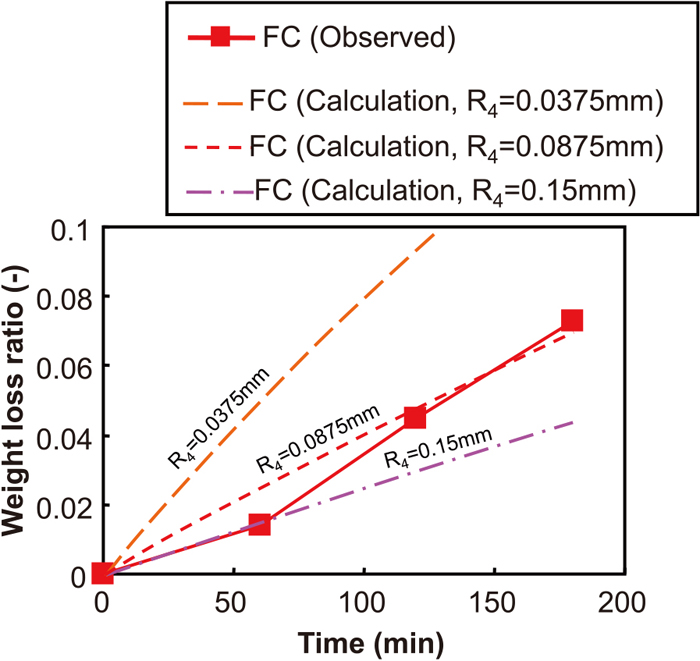
The reason for this difference will be discussed in greater detail in the following. Since Sample FC has a 58% content of fine particles, which is much higher than that of other samples, it is possible that the apparent diameter of the fine particles was increased by agglomeration of the particles by sintering during heating at 1773 K. Figure 12 shows the results of SEM observation of Samples MC and FC, which were prepared after heating at 1773 K for 1 h. In Sample MC, small pores and narrow spaces were observed, and MgO particles were also partially observed. Therefore, it is presumed that the sintering of MgO is not as advanced in this sample as in Sample FC, and that the possibility of sintering is low even if it is advanced. This is predicted to occur because the ratio of MgO fine powder in Sample MC is smaller than that in FC, so the surface energy, which is the driving force for sintering, will also be smaller.
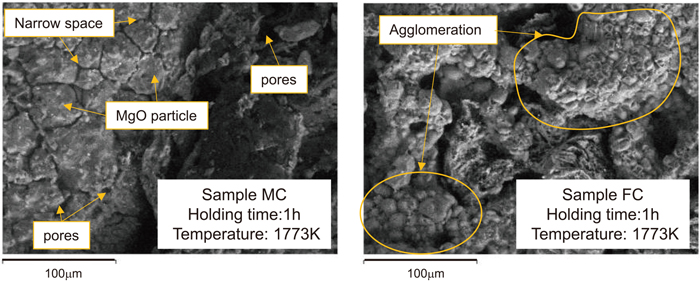
Conversely, in Sample FC, agglomeration of MgO particles was observed at the surface, as shown in Fig. 12, but the presence of small pores, narrow spaces and clear MgO particles, as seen in Sample MC, was slight. Since the reaction surface area of Sample FC is larger than that of Sample MC, the surface energy is considered to be larger than that in MC. From this, it is presumed that the MgO fine powder particles will aggregate with each other, and sintering will occur as the MgO–C reaction progresses. This phenomenon would presumably increase the apparent fine particle diameter, and as a result, the interfacial area for the reaction would decrease, so that the actual reaction rate was lower than that predicted by the reaction model.
The sintering behaviour and sintering mechanism of ceramics which consist of solid particles have been studied extensively, and various sintering models have been proposed.29) The improved MgO–C reaction model suggested in this study cannot explain part of the experimental results because it does not consider sintering behaviour. Thus, further improvement of the reaction model by combining a sintering model with this reaction model is one future issue. This is expected to involve many difficulties, such as reconstruction of the reaction model, determination of the driving force of sintering and determination of certain properties. Although further discussion is beyond the scope of the present study, research to clarify these factors is expected in the future.