3. Results and Discussion
3.1. Initial Microstructure
Figure 1(a) shows an example of a base metal phase map. Owing to rolling, the base metal exhibited a layered structure perpendicular to the normal direction (ND). The volume fractions of α and γ were 57.1% and 42.9%, respectively. The average grain sizes of α and γ were 5.4 μm and 2.3 μm, respectively. Both phases exhibited a typical rolling texture.
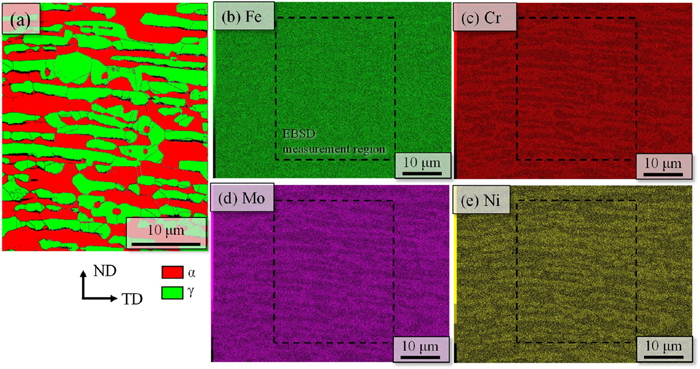
Fig. 1. EBSD and EDS measurements of base metal: (a) EBSD phase map of base metal and elemental maps of (b) Fe, (c) Cr, (d) Mo, and (e) Ni. Dotted square regions represent the EBSD measurement region. (Online version in color.)
Figures 1(b)–1(e) show the distribution maps of the main chemical elements in the base metal obtained by EDS measurements, including the region corresponding to the phase map in Fig. 1(a). The area surrounded by the black dotted lines in Figs. 1(b)–1(e) corresponds to Fig. 1(a). While Fe, shown in Fig. 1(b), was homogeneously distributed in the field of view, Cr, Ni, and Mo, as shown in Figs. 1(c)–1(e), had an inhomogeneous concentration distribution. Compared with the EBSD phase map in Fig. 1(a), the α-stabilizing elements Cr and Mo were more concentrated in the α regions. In contrast, the γ-stabilizing element Ni is more concentrated in the γ region.
3.2. Changes in Microstructure after FSW with Joining Conditions and Sheet Thickness Direction
Figure 2 shows the phase maps and IPF maps obtained in the regions near 100, 500, and 1200 μm from the top surface as representative microstructures in the center of the stir zone of the joint obtained by FSW at different rotational rates. A layered structure is observed along the TD. As shown in Fig. 1(a), the α and γ grains in the base metal were extend along the TD. However, after FSW, the grains became relatively equiaxed. In Fig. 2(d), γ grains formed at the α/α interface, as indicated by blue arrows (γα/α), or α grains formed at the γ/γ interface, as indicated by white arrows (αγ/γ), were observed after FSW, irrespective of the rotational rate. The orientation observed from the WDs did not exhibit any significant intensities in either phase, regardless of the observed positions in the thickness direction or rotational rates. Figure 3 shows the distribution of the main elements in the 500 μm thickness from the top of the FSW275 joint shown in Fig. 2(a). Even after FSW, each element was distributed according to the layered structure, with Cr and Mo enriched in the α regions and Ni enriched in the γ regions. FSW is expected to have a stirring effect associated with plastic flow, which is assumed to mainly occur along the circumferential direction of the tool, with that along the thickness direction being small. Therefore, although some γ (γα/α) and α (αγ/γ) grains were observed, most α grains likely were newly formed from the α/α or α/γ interfaces in the region where α was present, and γ grains were newly formed at the γ/γ interface or α/γ interface in the region where γ was present.
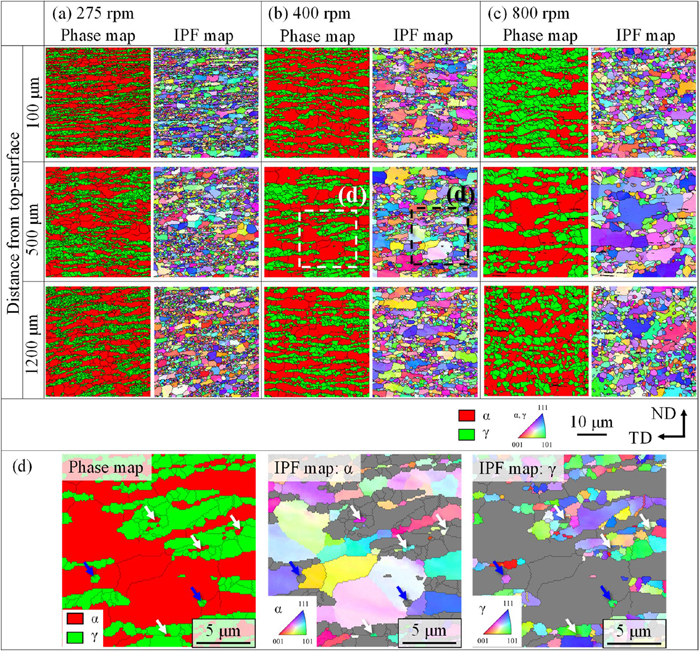
Fig. 2. EBSD phase maps and inverse pole figure maps at distances of 100 μm, 500 μm, and 1200 μm from the top surface of the joints welded at different rotational rates of (a) 275 rpm, (b) 400 rpm, and (c) 800 rpm. (d) The magnified phase map and IPF maps of α and γ of the locations are indicated by a dotted square in (b). (Online version in color.)

Fig. 3. EBSD and EDS measurements at a distance of 500 μm from the top surface of the duplex stainless-steel joints welded at a rotational rate of 275 rpm: (a) EBSD phase map of base metal and elemental maps of (b) Fe, (c) Cr, (d) Mo, and (e) Ni. Dotted square regions represent the EBSD measurement region. (Online version in color.)
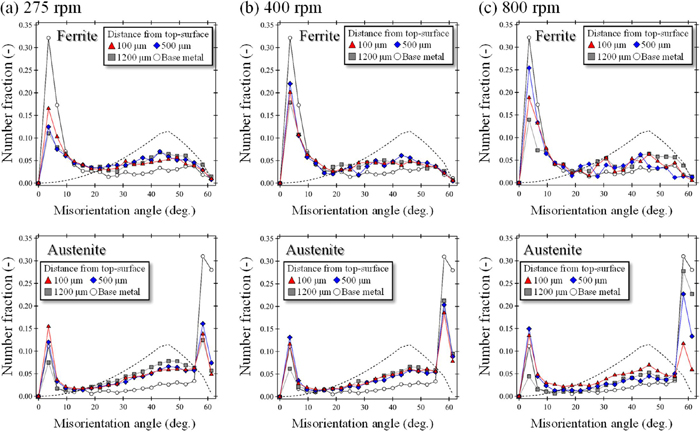
Figure 4 shows the α/α and γ/γ grain boundary misorientation histograms before and after FSW, obtained from the reference points in Fig. 2. The dotted lines in each figure show the grain boundary misorientation distribution in randomly oriented cubic polycrystals (Mackenzie distribution).23) In the base metal, α had a large fraction of low-angle grain boundaries with a misorientation of 5° or less, whereas γ contained a large fraction of high-angle grain boundaries with a misorientation of approximately 60°. The 60-degree misorientation was presumed to be caused by the annealing twins. In the FSW275 joint shown in Fig. 4(a), the low-angle grain boundary with a misorientation of approximately 5° in α and the high-angle grain boundary with a misorientation of approximately 60° in γ decreased, whereas the low-angle grain boundary with a misorientation of approximately 5° in γ increased. In addition, both phases tended to shift to a random grain boundary misorientation distribution after FSW. These changes can be attributed to dynamic recrystallization caused by FSW, resulting in the formation of new grains with random orientations. A comparison of the grain boundary misorientation distribution at each position along the thickness direction showed that, for both phases, the upper surface of the sample tended to contain slightly more low-angle grain boundaries with a misorientation of approximately 5°. Therefore, dynamic recrystallization during FSW is assumed to occur more frequently on the top surface, resulting in a random orientation distribution. As shown in Figs. 4(b) and 4(c), a similar trend toward the random distribution of grain boundary misorientation after FSW was observed for the FSW400 and FSW800 joints. In the FSW400 joint, no significant difference was observed in the distribution of grain boundary misorientation along the thickness. In the FSW800 joint, the low-angle grain boundary of α was dominant approximately 500 μm from the top surface along the thickness direction. The fraction of γ grain boundaries at approximately 60° is larger on the bottom surface. These changes may have been caused by differences in temperature, amount of strain applied to the top and bottom surfaces of the sample, and recrystallization behavior of the two phases.
Next, we discuss the results of a more detailed investigation of the changes in the volume fraction and average grain size of each constituent phase along the thickness.
3.2.1. Changes in Volume Fraction of Each Constituent Phase along the Thickness Direction
Figure 5 shows the changes in the volume fractions of α and γ in the stir zone of the FSWed joints at each rotational rate plotted against the distance along the thickness direction. The dotted dashed lines in each figure represent the amount of α and γ in the base metal. The dotted straight line in each figure is an approximate line obtained by the least-squares method, which was derived to determine the trend of the change in volume fraction with distance from the top surface. In the FSW275 joint (Fig. 5(a)), the highest amount of α was observed near the top surface. From the top to the bottom surfaces, the α content decreased, and the γ content increased. In the FSW400 joint (see Fig. 5(b)), the α content was more extensive on the top surface, and the amount of γ increased toward the bottom surface; however, the changes in the γ content were as small as in the FSW275 joint. In the FSW800 joint (see Fig. 5(c)), an increase in the γ content was observed in some areas on the top and bottom surfaces. However, the trend of higher α content on the top surface and higher γ content on the bottom surface was the same as that in the results for the specimens with other rotational rates. The duplex stainless steel used in this study consisted of two phases, α and γ, in the temperature range of room temperature to approximately 1300 K, and a single phase, α, at higher temperatures, according to the Fe–Cr–Ni quasi-binary phase diagram.24) In addition to the α and γ phases, the σ phase also exists in the temperature range of 800–1073 K. FSW has been reported to promote the formation of the σ phase25) and that the σ phase is formed even during FSW at prolonged joining speeds (e.g., 25 mm/min).26) However, no precipitation of the σ phase has been reported in FSW at the joining speed used in this study (150 mm/min), and no σ phase was observed in the microstructural observations. In the temperature range from approximately 1073 K (α+γ phase region) to approximately 1300 K (α single-phase region), the α fraction increased with increasing temperature. If the temperature reaches the α single-phase region, γ precipitates during the cooling process, and its volume fraction can be much lower than that of the base metal. In addition, γ is expected to precipitate at the α/α grain boundary, which is a specific preferential nucleation site, leading to the fragmentation of the layered microstructure, as shown in Fig. 2. Therefore, the highest temperature reached by FSW in the present study was probably not high enough for the α phase to be single but was maintained within the α+γ region. At temperatures above 1073 K in the α+γ region, the α fraction increased with increasing temperature. The temperature is higher on the top surface than on the bottom surface because the shoulder acts as a heat source on the top surface. Therefore, the differences in the volume fraction of each phase along the thickness direction are reflected by the differences in the temperature history along the thickness direction. In addition, the amount of strain introduced on the top surface is expected to be greater than on the bottom surface because of the additional strain introduced by the shoulder. A dynamic α transformation may occur when a large strain is applied to γ in the α+γ region, leading to an increase in the α fraction.26,27) In the present study, the volume fraction along the thickness direction tended to be higher in α and lower in γ than in the base metal, regardless of the position along the thickness direction. This may be related to the different temperature histories along the thickness direction and the dynamic α transformation associated with large strain processing in the α+γ region.

Fig. 5. Changes in volume fractions of ferrite and austenite in the stir zone of the duplex stainless-steel joints welded at rotational rates of (a) 275 rpm, (b) 400 rpm, and (c) 800 rpm as functions of distance from the top surface along the thickness direction. Dotted-dashed lines indicate the grain sizes of the base metal. (Online version in color.)
In the FSW800 joint, a significant increase in the γ content was observed near the top surface. Figure 6 shows the phase map and elemental distribution in the region approximately 100 μm from the top surface. In this region, several regions (black-colored regions) with CI values below 0.05 were found on the phase map (Fig. 6(a)). As shown in Fig. 6(b), Fe was absent in this region, whereas Cr, Mo, and W were detected, as shown in Figs. 6(c), 6(d), and 6(f). Because W is the main component of the tool, its constituent elements are incorporated into the specimen owing to tool wear. Tool wear, as reported previously, occurs at high temperatures during FSW,28) and the components of the tool are incorporated into the specimens, which has also been utilized as a microstructural control process.29) As shown in Fig. 6(e), the Ni content is high in the γ region. No significant increase in the γ content was observed outside the region where W was detected, suggesting that the Ni used as a tool binder was incorporated into the sample, resulting in an increase in the γ content. If the tool components were not incorporated into the specimen, the γ content would be lower, and the α content would be higher on the top surface than on the bottom surface, as in the FSW275 and FSW400 joints.

Fig. 6. EDS analysis of the duplex stainless-steel joints welded at a rotational rate of 800 rpm: (a) EBSD phase map overlapped secondary electron image and elemental distributions of (b) Fe, (c) Cr, (d) Mo, (e) Ni, and (f) W. (Online version in color.)
No research has been conducted to investigate the changes in the volume fraction of each phase along the thickness direction in detail, and how the volume fraction changes from the top surface to the bottom surface is not clear. This study clarifies that α decreases slightly and γ increases slightly, approximately linearly, from the top surface to the bottom surface.
3.2.2. Changes in Grain Size along the Thickness Direction
Figure 7 shows the changes in the average grain sizes of α and γ as functions of the distance from the top surface along the thickness direction in the FSW275, FSW400, and FSW800 joints. The dotted dashed line in each figure indicates the average grain size of each phase of the base material. Both phases were remarkably refined compared to the base metal in the FSW275 joint (Fig. 7(a)). At the topmost surface, α and γ grains were the finest, with an average grain size of 1.14 μm and 0.47 μm, respectively. The position where the grain sizes in both phases were the largest was 570 μm from the top surface, and the average grain sizes of α and γ were 2.03 μm and 0.79 μm, respectively. The grain size of α was always larger than that of γ at any position. In the FSW400 joint (Fig. 7(b)), as in the FSW275 joint, both phases had fine grains at the top surface and the largest grains at 480 μm from the top surface. The average grain sizes of α and γ were 2.42 μm and 0.79 μm, respectively, at the topmost surface and 4.31 μm and 1.23 μm, respectively, at 480 μm from the top surface. At all positions along the thickness direction, α had larger grains than γ. The grain sizes in both phases increased from the top to approximately 500 μm and decreased from 500 μm to the bottom. Compared with FSW275 joint, the average grain size in both phases was larger than that of FSW275 joint, and the average grain size of α increased more than that of γ. In the FSW800 joint (Fig. 7(c)), both phases were larger than those under the other welding conditions. Both phases tend to have the finest grains near the top surface and the largest grain sizes at 500 μm from the top surface, as is the case for other rotational rates. The average grain sizes of α and γ were 2.73 μm and 1.50 μm, respectively, at the topmost surface and 6.28 μm and 1.95 μm, respectively, at 450 μm from the top surface. The α grain size coarsened to the same size as that of the base material, except for grains at the top surface. Refinement of the grain sizes at the top surface occurred regardless of the test conditions. The grain size gradually increased from the top surface to approximately 500 μm. This tendency indicates that the effect of shoulder processing on the region from the top surface to approximately 500 μm was responsible for the grain refinement, and the effect of shoulder processing became smaller as the distance from the top surface increased. The decrease in grain size of both phases from approximately 500 μm to the bottom surface may reflect the difference in the temperature history along the thickness direction. If the extra deformation processing by the shoulder had no effect, and the effect of the temperature difference along the thickness direction was dominant, the grain size would be the largest on the top surface. Therefore, the region of approximately 500 μm from the top surface is the boundary, where the extra processing effect of a shoulder disappears and no longer has any effect, and that the maximum average grain sizes of each constituent phase are obtained, regardless of the rotational rate.
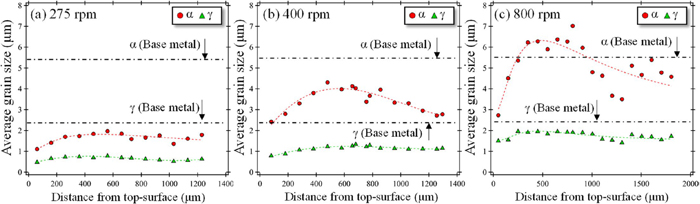
Fig. 7. Changes in grain sizes of ferrite and austenite in the stir zone of the duplex stainless-steel joints welded at rotational rates of (a) 275 rpm, (b) 400 rpm, and (c) 800 rpm as functions of distance from the top surface along the thickness direction. Dotted-dashed lines indicate the grain sizes of the base metal. (Online version in color.)
Previous studies on grain size variation along the thickness direction16,17) were based on results obtained from measurements focused only on several regions along the thickness direction. Therefore, the effects of shoulder processing and the precise grain size variation along the thickness direction are unclear. The present study clarified the precise grain size distribution along the thickness direction by considering the influence of shoulder processing and temperature history along the thickness direction.
3.3. Microstructure Formation via FSW
Figure 8 shows an example of kernel average misorientation (KAM) maps for α and γ obtained from a region approximately 500 μm from the top surface of a cross-section obtained from the FSW275 joint. The solid black line in the figure represents a high-angle grain boundary. The α phase showed low KAM values in almost all grains. Local misorientation corresponding to low-angle grain boundaries was observed in some α grains, as shown in the area circled by the red dotted line in the figure. However, the misorientation within the γ grains was significantly higher than that in the α grains. In the dynamic recrystallization behavior that occurs when duplex stainless steels are processed at high temperatures, α, a BCC structure, is known to have a high stacking fault energy, and dynamic recovery is dominant, resulting in continuous dynamic recrystallization. On the other hand, γ, which has an FCC structure with low stacking fault energy, results in discontinuous dynamic recrystallization.30,31) Even when FSW is applied, continuous dynamic recrystallization has been reported to occur for α and discontinuous dynamic recrystallization for γ.13,14,16,17) The average KAM values of each phase after FSW in this study, which were low for α and high for γ, are suggested to be due to the difference in the dynamic recrystallization behavior caused by the difference in stacking fault energy. A rigorous discussion of dynamic recrystallization behavior requires an evaluation that removes the effects of restoration processes and grain growth during cooling as much as possible, which is an issue for the future.

Fig. 8. Kernel average misorientation maps of (a) ferrite and (b) austenite at a distance of 500 μm from the top surface of the joints welded at 275 rpm. (Online version in color.)
Figure 9 shows the changes in the average KAM values of α and γ along the thickness direction of joints at each rotational rate. In the FSW275 joint (Fig. 9(a)), the average KAM value for γ is higher than that for α at all positions along the thickness direction. The average KAM values for γ were almost constant along the thickness direction, whereas those for α were the highest on the top surface and decreased slightly from the top surface to the bottom surface. Even for the FSW400 joint (Fig. 9(b)), the average KAM value for γ was larger than that for α. However, the value of γ was lower than that of the FSW275 joint. However, the value of α was almost the same as that of the FSW275 joint. For both phases, the average KAM values were higher on the top surface and tended to decrease toward the bottom surface. For the FSW800 joint (Fig. 9(c)), the average KAM value for γ was even lower than that for the other rates; however, it was higher than the value for α at any position in the thickness direction. The average KAM values for α were slightly lower than those for the other rates but were almost identical. The average KAM value for the FSW800 joint tended to be higher on the top surface than on the bottom surface. Dynamic recrystallization can occur in both regions. However, dynamic recrystallization is assumed to occur more easily on the top surface because the amount of strain applied by the shoulder is large and the temperature is high. However, because dynamic recrystallization occurs simultaneously under plastic deformation, the KAM value is estimated to be higher on the top side of the sample where the applied amount of strain is significant, and the decrease in the average KAM value of γ with increasing rotational rate can be mainly attributed to the progress of dynamic recrystallization owing to the higher welding temperature at higher rotational rates.
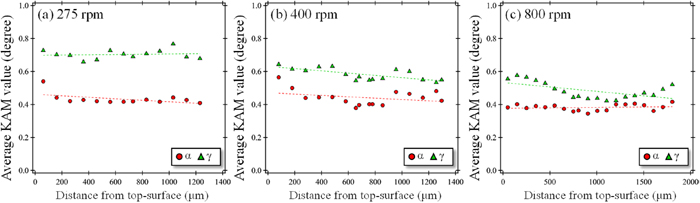
Fig. 9. Changes in average KAM values of ferrite and austenite in the stir zone of the duplex stainless-steel joints welded at rotational rates of (a) 275 rpm, (b) 400 rpm, and (c) 800 rpm as functions of distance from the top surface along the thickness direction. (Online version in color.)
In duplex stainless-steel perpendicular to the ND, the layered structure before FSW was maintained in the stir zone even after FSW. Therefore, we investigated how the number of layers and layer thicknesses changed before and after FSW. The number of layers (ni, i=α, γ)) was determined by drawing three straight lines parallel to the thickness direction at each analysis point of the EBSD measurement and counting the number of times the lines passed through the α and γ grains. The layer thickness (ti, i=α, γ)) on each line was calculated from the following equation using the length along the thickness direction (100 μm) of each analysis point of the EBSD measurements. In Eq. (1), fi (i=α, γ), is the volume fraction of each phase, and ni is the number of layers.
|
t
i
=
100×
f
i
n
i
(
i=α, γ
)
| (1) |
The average layer thickness ti obtained for each line was taken as the average layer thickness of each phase at each analysis point of the EBSD measurement. Figure 10 shows the variation in the average layer thicknesses of α and γ with respect to the distance from the top surface along the thickness direction. The dotted-dashed lines in the figures represent the average layer thickness obtained from 19 analysis points by performing EBSD measurements along the thickness of the base metal. In the FSW275 joint, both α and γ have an average layer thickness less than that of the base metal at any position in the thickness direction. An average layer thickness less than or equal to that of the base metal indicates that the number of layers per unit length increased from the base metal. Furthermore, the existence of grains such as γα/α and αγ/γ, as indicated by the blue arrows in Fig. 2(a), implies that the number of layers increased owing to the formation of such grains. In the FSW400 joint, which appears to have a higher temperature than the FSW275 joint, γ has a smaller average layer thickness than that of the base metal, whereas for α, average layer thickness is similar to that of the base metal. In the FSW800 joint, which appears to have the highest temperature, the average layer thicknesses of both α and γ were larger than those of the base metal. The γα/α and αγ/γ grains were also observed in the FSW400 and FSW800 joints (see Figs. 2(b) and 2(c)), suggesting that although the number of layers increased, as in the case of the FSW275 joint, the average layer thickness decreased owing to the relatively high temperature, which promoted dynamic recovery, dynamic recrystallization, and subsequent grain growth. On the other hand, as shown in Fig. 3, the stabilizing elements in each phase were enriched in α or γ grains, even after FSW, and the elemental distribution corresponded to the layered structure. During FSW, the plastic flow along the thickness direction of the sheet is substantially small and is considered to have been stirred while maintaining the layered structure of the base metal.32) Therefore, the formation of γα/α and αγ/γ, which contributed to the increase in the number of layers observed in the FSW275 joint, could be due to (1) local stirring effects caused by plastic flow during FSW or (2) the formation of different phases at the α/α or γ/γ interfaces due to phase transformation. Figure 11(a) shows the phase map of the FSW275 joint in a region approximately 500 μm from the top surface. In (1), γ grains existed continuously in a layered structure in the base metal. However, the γ grains in the area surrounded by the dashed black line in the figure are discontinuous. Such grains have been identified in several analytical fields. We believe that this microstructure indicates that local stirring during the plastic flow caused fragmentation. Regarding (2), if these γ grains originate from nucleating a new phase by transformation, they are expected to precipitate with some orientation relationship with the surrounding grains to reduce the interfacial energy. The Kurdjumov-Sachs orientation relationship (K-S OR) is established between α and γ in duplex stainless steels.33) Therefore, we investigated whether the K-S OR holds for γα/α and αγ/γ in Fig. 11(a). The pole figure was obtained from γ_(α/α) and α_(γ/γ), as indicated by the blue arrows in Fig. 11(a), along with their adjacent grains. Figure 11(b) shows the superimposition of {111}γ on {011}α and <111>α on <110>γ obtained from the α1 and γ1 grains in Fig. 11(a), respectively. Figure 11(c) shows the pole figure obtained by the same method for the α2 and γ2 grains. Again, the α1 and α2 grains were found to satisfy the K-S OR with γ1 and γ2 grains, respectively, as indicated by the black arrows in Figs. 11(b) and 11(c), while no K-S OR with adjacent different phases was observed for the α3 and γ3 grains, as shown in Fig. 11(a). However, the K-S OR between several grains suggests that new grains of different phases were formed at the α/α or γ/γ interfaces by phase transformation, which satisfied the K-S OR. For grains without K-S OR, the phase transformation behavior of complex interfaces under large strains in FSW probably prevented them from satisfying K-S OR. The formation of γα/α and αγ/γ, which contributed to the increase in the number of layers, was probably due to the local stirring effect during plastic flow and the formation of new grains by phase transformation.

Fig. 10. Changes in the layer thickness of (a) ferrite and (b) austenite in the stir zone of the duplex stainless-steel joints fabricated at different rotational rates. (Online version in color.)

Fig. 11. (a) EBSD phase map at a distance of 500 μm from the top surface of the joints welded at 275 rpm. (b) pole figures of {011}α, {111}γ, <111>α, and <011>γ were obtained from α1 grain and γ1 grain shown in (a). (c) pole figures of {011}α, {111}γ, <111>α, and <011>γ were obtained from α2 grain and γ2 grain shown in (a). The dotted lines in (b) and (c) indicate 001 traces of α (red color) and γ (green color). (Online version in color.)
When second-phase particles are present in the microstructure, the grains of the primary phase grow under the pinning forces. Considering the pinning effect of the second-phase particles, the average grain size of the primary phase particles can be expressed by Zener’s relation, as described below.34)
where
D
¯
is the average grain size of the primary phase;
d
¯
is the average grain size of the second phase; fV is the volume fraction of the second phase, and β is a constant. Various reports have been published on the value of the constant β. Zener estimated it to be 4/3,34) Gladman to be 0.045–0.26,35) Ashby et al. to be 2/3–4/3,36) and Hellman and Hillert to be 4/9.37) The current accepted value is in the range of 2/9–4/3.38) In duplex stainless steels, if Zener’s relation establishes α with a large volume fraction as the primary phase and γ as the secondary phase, the grain growth behavior under the conditions of static heating39) and high-temperature superplastic deformation40) has been reported to reveal a β value of 4/9. Takayama et al.38) reported that when the primary phase is assumed to be α in duplex stainless steels, the γ grain size increases according to the cubic law of the Ostwald growth mechanism, the rate of which is determined by volume diffusion. In contrast, the α grain size follows the cubic law owing to the pinning effect of the secondary phase of γ. Assuming that Zener’s relationship holds, as described in Eq. (2), Fig. 12 shows a graph of the α grain size at each analysis point obtained from EBSD measurements along the thickness direction of a FSWed joint as a function of the γ grain size divided by the γ volume fraction at each rotational rate. The dotted-dashed lines in the figure are the straight lines of the proportionality coefficient β proposed by Zener and Hellman-Hillert, respectively. Because the plot points for the FSW275, FSW400, and FSW800 joints could be linearly approximated regardless of the rotational rate or distance from the top surface, the average grain size of the primary phase α in the stir zone is concluded to depend on the average grain size of the secondary phase γ, suggesting the formation of dynamically recrystallized grains followed by grain growth. However, each plot point is on a straight line with a slope of β = 4/3,34) as proposed by Zener. Considering that the proportionality coefficient β for duplex stainless steel under static heating39) and during superplastic deformation40) at high temperatures has been reported to be 4/9, the grain growth behavior due to FSW was different from previously reported cases. The following factors may have contributed to this discrepancy:

Fig. 12. Relation between grain size of α and grain size of γ in the stir zone of the duplex stainless steel welded at rotational rates of 275 rpm, 400 rpm, and 800 rpm. (Online version in color.)
• The theory of pinning in the second phase assumes uniform dispersion of equiaxed grains. However, even after FSW, it has a layered structure along the TD. The volume fraction of the second phase, fV, should be set at an optimum value of m, with
f
V
m
depending on the dispersion of the grains.41) The complex microstructural morphology formed by FSW may affect the value of β.
• The γ grains had a high KAM value, as shown in Fig. 9, suggesting that they had a higher dislocation density than the α grains. Because the driving force for grain growth is the interfacial energy and dislocation density difference, the α grains may tend to grow toward the γ grains, resulting in inhomogeneous grain growth behavior.
• In the theory of the second phase pinning effect, the grain boundary energy must be considered in the case of a duplex alloy.42) In addition, for a more rigorous discussion, the twin boundaries within the microstructure and γ as the distribution state of the grain boundary character must be considered.
In addition, to discuss the validity of the proportionality coefficient β obtained in this study, its three-dimensional microstructural morphology must be understood,41) which is currently difficult. However, the α grain size of the primary phase and the γ grain size of the secondary phase divided by the γ volume fraction show a linear relationship at any position in the thickness direction, which indicates that the dynamically recrystallized grains of both phases grow together. Therefore, the γ grains were refined to reduce the α grain size. For example, increasing the strain rate or lowering the temperature during FSW to increase the Z factor, known as the Zener-Hollomon parameter, or adding alloying elements that increase the activation energy can be effective. In addition, because the layered structure may also influence grain growth, promoting plastic flow in the thickness direction during FSW is also expected to be effective.

