Abstract
Steel used for wind power must have high fatigue resistant properties because of its strict service conditions. The large-size (≥20 µm) CaO–MgO–Al2O3 (CMA) inclusions can lead to stress concentration and significantly reduce the service life. However, the occurrence of large-size inclusions is occasional and closely related to many factors, making it difficult to trace and control such inclusions. Herein, taking 42CrMo steel as the research object, we clarified the formation mechanism of CMA inclusions and determined its correlation with the steelmaking process. It was found that nearly all the large-size CMA inclusions in the bloom are located in the liquid region (<1873 K) of CaO–MgO–Al2O3 phase diagram. The results of inclusions automatic scanning showed that the low-melting-point CMA inclusions mainly form during VD treatment. Thermodynamic calculation revealed that the Al in molten steel reacts with CaO in slag under high vacuum condition, resulting in continuous diffusion of Ca from slag to steel. Then the dissolved Ca reacts with the existing solid or solid-liquid two-phase inclusions, leading to the increase of CaO in inclusions. The modified inclusions have good wettability with molten steel, and finally inherit to round bloom. Furthermore, the control policy to decrease the reaction extent between Al and CaO under vacuum condition was put forward in light of thermodynamic calculation. Under the same ratio of CaO/SiO2, with Al content increases, the corresponding Al2O3 content should be increased. Under the same Al2O3 content, with Al content increases, the ratio of CaO/SiO2 should be decreased.
1. Introduction
The target of carbon neutrality has promoted the development of wind power industry, also led to the increase of steel used for the wind power. 42CrMo, equals SCM 440 in Japan, is one of the typical medium carbon alloy steels with excellent mechanical properties, which can be used in yaw paddle bearing of wind power.1) The requirement for high fatigue resistant property of wind power bearing has been put forward due to its strict service conditions. However, the presence of non-metallic inclusions, particularly the large-size (≥20 μm) and low-melting-point (<1873 K) CMA ones, can exert a detrimental effect on fatigue life.2,3,4) The cracks can easily occur at interfaces between large-size inclusions and steel, which might be the origins of fatigue fractures.5) With the increasing demand for high-quality steel, the control of large-size CMA inclusions has become a major obstacle for metallurgy researchers.
Identifying the source of CMA inclusions is the key to solving the problem. Ohta et al.6) found that the LF top slag entrapped during gas stirring accounts for 70 percent of total CMA inclusions by tracer method. However, some researchers pointed out that lime-bearing inclusions are formed by intrinsic reaction during LF refining or vacuum degassing process.7,8,9,10,11,12) For example, Xu et al.9) examined that the number of large-size CMA inclusions increases after VD, which lies in that the ideal kinetic condition enhances the reaction between Al in steel and CaO in slag, then the generated calcium modifies the Al2O3-based inclusions into low-melting-point ones. In all, both endogenous and exogenous inclusions can be the source of large-size inclusions.
To date, some efforts have been contributed to control CMA inclusions. Hyogo et al. investigated the relationship between manufacturing conditions and inclusions, discovering new ways to reduce the frequency of large-size inclusions by means of controlling their characteristics. The maximum size of inclusions can be controlled below 20 μm.13,14) However, the technology of inclusions control has not been reported. Liu15) and Song16) et al. adopted the method of reducing the activity of CaO in LF top slag to suppress the formation of CMA inclusions. Liu15) and Matsuoka17) et al. also suggested decreasing stirring intensity and refining time to avoid slag entrapment during LF refining. These studies provide valuable guidance for controlling large-size inclusions. However, the occurrence of large-size ones is occasional and closely related to many metallurgical factors, making it difficult to trace and control such inclusions. For various steelmaking routes and technological points, the source and formation mechanism of large-size inclusions may differ widely. In addition, the reported studies focus more on qualitative analysis of the control technology, but less on quantitative analysis.
Therefore, to help the existing research, taking 42CrMo used for wind power as the research object, we first determined the characteristics of large-size CMA inclusions in round bloom, then studied the evolution of inclusions during the refining process by inclusions automatic scanning analysis. In order to identify the source of large-size inclusions, we further analyzed the variation of 200 groups of steel and slag compositions before and after the VD process, and established its correlation with inclusions formation. Based on this, the quantitative analysis of compatibility concerning steel and slag composition was proposed by means of thermodynamic calculation. Lastly, the optimized industrial experiments were carried out to verify the reasonability.
2. Experimental Method
2.1. Conventional Steel Manufacturing Process and Sampling
The major chemical composition of 42CrMo steel consists of 0.42 mass% C, 0.25 mass% Si, 0.69 mass% Mn, 1.04 mass% Cr and 0.16 mass% Mo. The steel was produced by the process of 100 ton electric arc furnace (EAF)-ladle furnace (LF)-vacuum degassing (VD)-continuous casting (CC, Φ500–800 mm). During EAF tapping, the aluminum block was added into the ladle as deoxidizers as well as Si–Fe, Mn–Fe and Cr–Fe as the alloying elements. Furthermore, lime and premelted CaO–Al2O3 slag were added to the ladle for desulfurization and slagging. After the ladle arrived at LF station, the element such as Mo was further adjusted to meet the steel composition requirements. Meanwhile, SiC was used for diffusion deoxidation, with the aim of controlling the sum of FetO and MnO in slag below 1.0 mass%. The amount of slag was about 1300 kg. After that, the ladle was transferred to the VD station for dehydrogenation and denitrification of molten steel. After the vacuum was broken, the aluminum wire was fed into steel to adjust to the target composition. During the refining process, three steel samples and three slag samples were taken, named “LF-1”, “LF-2” and “VD-1”. The steel manufacturing process and sampling time are shown in Fig. 1. After continuous casting, one 50-mm-high slice was cut from round bloom. Then, a 20×20×20-mm cubic sample was cut from the slice for microscopic observation.

Fig. 1. Schematic diagram of steelmaking process and sampling. (Online version in color.)
Chemical analyses were performed at the National Analysis Center for Iron and Steel (NACIS), China. The concrete methods of analyzing steel and slag were described in Ref. 18). “LF-1”, “LF-2” and “VD-1” refer to “early stage of LF”, “end of LF”, and “after VD”, respectively. In order to better clarify the common rule and its correlation with inclusions formation, we analyzed 200 groups of steel and slag compositions before and after the VD process.
The characteristics of inclusions in three steel samples (LF-1, LF-2, VD-1) including the composition, number and size were examined by an automated electron microscope. The area scanned by the particle explorer was 100 mm2 and the detection limit of inclusions diameter was 1 μm. Meanwhile, the typical inclusions in steel samples were also detected by scanning electron microscopy and energy dispersive spectrometry (FEI, Hillsboro, OR, USA).
3. Results
3.1. Chemical Compositions of Steel and Slag
The steel and slag compositions are listed in Tables 1 and 2. It can be seen that Al was oxidized to a large extent during VD treatment, decreasing from 0.032 mass% at the end of LF to 0.0096 mass% after VD. Correspondingly, the content of Al2O3 in slag increased from 24.57 mass% to 26.43 mass%. Meanwhile, the content of Ca in steel increased from 3 ppm to 5 ppm while CaO content in slag decreased from 58.22 mass% to 53.49 mass%. In addition, the oxygen content in steel decreased from 0.0021 mass% at the end of LF to 0.0016 mass% after VD, indicating the cleanliness of molten steel was improved although aluminum was heavily oxidized during the VD process.
Table 1. Chemical compositions of three steel samples (mass%).
| Samples | C | Si | Mn | Cr | Mo | Als |
|---|
| LF-1 | 0.30 | 0.17 | 0.63 | 0.98 | 0.14 | 0.024 |
| LF-2 | 0.41 | 0.24 | 0.69 | 1.04 | 0.16 | 0.032 |
| VD-1 | 0.42 | 0.25 | 0.69 | 1.03 | 0.16 | 0.0096 |
| Samples | S | P | Ca | Mg | O | N |
|---|
| LF-1 | 0.0050 | 0.0090 | 0.0001 | 0.0003 | 0.0032 | 0.0042 |
| LF-2 | 0.0016 | 0.0092 | 0.0003 | 0.0004 | 0.0021 | 0.0046 |
| VD-1 | 0.0012 | 0.0090 | 0.0005 | 0.0004 | 0.0016 | 0.0034 |
Table 2. Chemical compositions of three slag samples (mass%).
| Samples | CaO | Al2O3 | SiO2 | MgO | FeO | MnO |
|---|
| LF-1 | 57.05 | 23.12 | 11.06 | 7.38 | 0.68 | 0.53 |
| LF-2 | 58.22 | 24.57 | 12.05 | 7.24 | 0.42 | 0.38 |
| VD-1 | 53.49 | 26.43 | 12.79 | 7.98 | 0.55 | 0.45 |
We detected 20 CMA inclusions over 20 μm in the round bloom by SEM and EDS. The inclusions can be classified into two groups: one is the CaO–MgO–Al2O3 inclusions with homogeneously distributed compositions, as shown in Fig. 2(a). Another is complex inclusions with MgO–Al2O3 as the core and CaO–Al2O3 as the periphery, as shown in Fig. 2(b). It is concluded that this type of CMA inclusions are formed by Ca substitution for part of Mg in MgO–Al2O3 inclusions.19,20,21) It is noted that the two-dimensional morphology of the two kinds of inclusions is close to circular.

Fig. 2. Elemental mappings of typical CMA inclusions in round bloom, mol.%. (Online version in color.)
The composition distribution of CMA inclusions was marked onto the CaO–MgO–Al2O3 ternary phase diagram at 1873 K, as calculated by FactSageTM 8.0, as shown in Fig. 3. The red line denotes the liquid region at 1873 K. It can be seen that the CMA inclusions are all located in the liquid region (the core is not included). These low-melting-point inclusions are very detrimental to the fatigue life of steel.
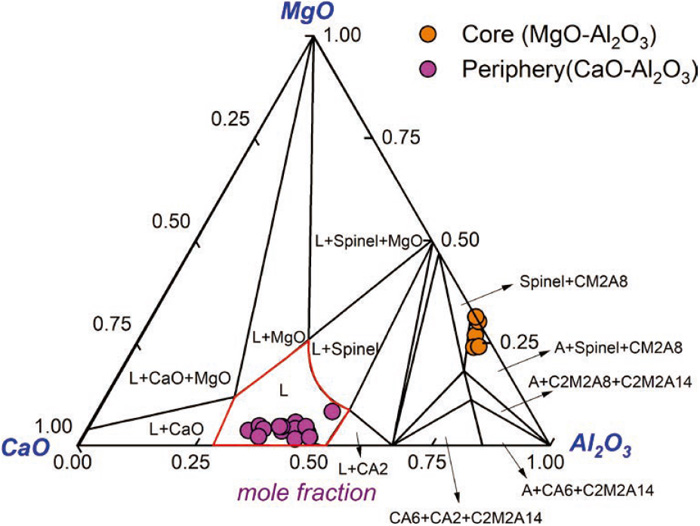
Fig. 3. Composition distribution of large-size CMA inclusions on CaO–MgO–Al2O3 phase diagram (A: Al2O3, M: MgO, C: CaO). (Online version in color.)
The occurrence of large-size inclusions may be closely related to many metallurgical factors, which can be preliminarily determined by analyzing the evolution of inclusions during the steelmaking process. With SEM and EDS analysis, it was found that the inclusions are mainly MgO–Al2O3 and Al2O3-based irregular CMA inclusions at the early stage of LF refining, as shown in Figs. 4(a1)–4(a3). The size of these inclusions are all below 20 μm. At the end of LF refining, the amount of MgO–Al2O3 significantly reduced and a small amount of spherical CMA inclusions formed, as shown in Figs. 4(b1)–4(b3). After VD treatment, the morphology of most inclusions changed from irregular shape to spherical. MgO–Al2O3 inclusions reacted with Ca in the molten steel, forming low-melting-point CMA inclusions, as shown in Figs. 4(c1)–4(c3). It is noted that several cores of MgO–Al2O3 existed in some CMA inclusions.
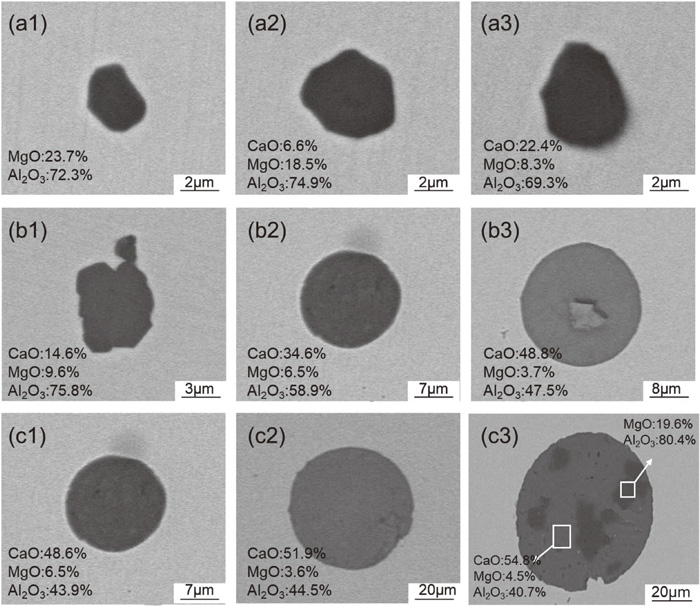
Fig. 4. Morphology and composition (mole percent) of typical inclusions, (a1–a3) Early stage of LF, (b1–b3) End of LF, (c1–c3) After VD.
The inclusion compositions obtained by automatic scanning were marked onto the CaO–MgO–Al2O3 ternary phase diagram at 1873 K, as shown in Fig. 5. The average composition of inclusions at the early stage of LF refining is 83 mole%Al2O3-10 mole% CaO-7 mole% MgO. From Fig. 5(a), it can be seen that nearly all the inclusions are located outside the liquid region. As the reaction proceeds, the content of CaO in inclusions shows a rising trend. The source of calcium may be originated from the impure alloys22) or the reaction between slag and steel.23) At the end of LF, the average composition of inclusions is 76 mole% Al2O3-18 mole% CaO-6 mole% MgO. A small amount of inclusions are located in the liquid region, as shown in Fig. 5(b). After VD treatment, the average composition of inclusions changed obviously compared to that during LF, with 60 mole% Al2O3-35 mole% CaO-5 mole% MgO. The number of inclusions over 20 μm obviously increased, as shown in Fig. 5(c).

Fig. 5. Composition distribution of CMA inclusions during refining process, (a) At early stage of LF, (b) At end of LF; (c) After VD treatment. (Online version in color.)
By statistics analysis, the total number density of inclusions at the early stage of LF, end of LF, after VD is 5.93 per mm2, 5.38 per mm2, 4.21 per mm2, which indicates that the molten steel becomes cleaner as the reaction proceeds. The number density of the oxide inclusions corresponds well with oxygen content in steel. Based on the composition distribution, the inclusions can be divided into three types: MgO–Al2O3, solid or solid-liquid two-phase CMA and CaO–Al2O3(CA) inclusions, liquid CMA and CaO–Al2O3(CA) inclusions. The number and size of three types of inclusions were analyzed, as illustrated in Fig. 6. From Fig. 6(a), it can be seen that for inclusions below 10 μm, the solid or two-phase inclusions decrease from 5.75 per mm2 at the early stage of LF to 3.60 per mm2 after VD. Meanwhile, the liquid CMA and CA inclusions increase from 0 per mm2 to 0.4 per mm2. Figure 6(b) shows that the inclusions ranging from 10 μm to 20 μm are 0.05 per mm2 after VD, larger than that during LF. In addition, no MgO–Al2O3 inclusions over 10 μm were found during the refining process. Figure 6(c) shows that the number density of liquid inclusions over 20 μm obviously increases to 0.07 per mm2 after VD.

Fig. 6. Size and quantity distribution of inclusions, (a) At early stage of LF, (b) At end of LF; (c) After VD treatment. (Online version in color.)
4. Discussion
From Figs. 4, 5, 6, it can be seen that the large-size CMA inclusions mainly appear after VD treatment. It is speculated that the formation of CMA inclusions is much related to VD. The behavior of large-size CMA inclusions is analyzed as follows:
4.1. Variation of Steel and Slag Compositions Before and After VD
It can be seen from Tables 1 and 2 that content of Al in steel and CaO in slag decreased significantly after VD treatment. In order to further clarify whether it is a common rule, 200 groups of steel and slag compositions were analyzed. Figure 7 shows the relationship between the content of Al-loss during VD and Al content at the end of LF. Al-loss refers to the content of Al at the end of LF minus that after VD. It is found that there is a linear relationship between the two parameters, as given in Eq. (1). With the increase of Al content at the end of LF, the content of Al-loss during VD increases. The average oxidation extent of Al during VD reaches 67.73%.
|
[mass% Al]
Al-loss during VD
=
0.834×
[mass% Al]
at the end of LF
-0.00368
| (1) |

Fig. 7. Relationship between Al-loss during VD and content of Al at end of LF. (Online version in color.)
Correspondingly, we analyzed 200 groups of slag compositions before and after VD. The average slag compositions are shown in Fig. 8, from which it could be found that the content of CaO decreases from 57.5 mass% at the end of LF to 53.16 mass% after VD while Al2O3 increases from 23.98 mass% to 27.1 mass%, indicating that the variation of Al and CaO during VD is a common rule.

Fig. 8. The average compositions of slag before and after VD. (Online version in color.)
Based on the above analysis, it is speculated that the content of Al in steel and CaO in slag decreases after VD treatment, accompanied by the increase of Ca content and large-size CMA inclusions. Under high vacuum and argon stirring conditions, the Al in molten steel would react with CaO in slag, forming Al2O3 and Ca at the slag-steel interface. Then, part Ca would diffuse into the low-pressure environment in the form of gas. The reactions can be expressed as Eqs. (2), (3), (4), (5):
|
2[Al]+3(CaO)=
(Al
2
O
3
)+3[Ca]
| (2) |
|
Δ
G
θ
[2]
=710 600-52.3T (J/mol)
| (3) 24,25) |
|
Δ
G
θ
[4]
=-122 100+35.5T (J/mol)
| (5) 26) |
Combing Eqs. (2), (3), (4), (5), the following formulas of Eqs. (6) and (7) can be derived. The Van’t Hoff equation is used to characterize the limit of the reaction [6], as given in Eq. (8). Where ΔG is the actual Gibbs free energy, J/mol; and ΔGθ is the standard Gibbs free energy, J/mol; R is the universal gas constant, 8.314 J/(mol·K). ai refers to the activity of slag or steel component. The activity of slag component was calculated by Ion and Molecule Coexistence Theory (IMCT), which can be expressed as a function of mass action concentration.27,28,29) The nature of mass action concentration is consistent with the activity in Raoult’s reference system. The difference between the two types of activity mainly lies in that mass action concentration avoids the activity coefficient of the activity in Raoult’s reference system. The activity of Al in steel was calculated by the Wagner equation, which is based on a 1% mass fraction as the standard state. The interaction coefficients used in the study are listed in the previous study.30,31,32)
|
2[Al]+3(CaO)=
(Al
2
O
3
)+
3Ca
(g)
| (6) |
|
Δ
G
θ
[6]
=344 300+54.2T (J/mol)
| (7) |
|
ΔG=Δ
G
θ
[6]
+RTln{
(
P
Ca
P
θ
)
3
⋅
a
Al
2
O
3
a
CaO
3
⋅
a
Al
2
}
| (8) |
ΔG is the thermodynamic driving force of the reaction. Pθ is standard atmospheric pressure, 101325 Pa. PCa is the actual pressure, Pa. ΔG <0 indicates that the reaction proceeds in the right direction. The smaller the value, the greater the limit to forward reaction. During the VD process, the pressure was 67 Pa or slightly lower. Herein, the degree was set as 60 Pa. The ΔG value of reaction [6] was calculated, and its relationship with Al-oxidation during VD was presented in Fig. 9. With the decrease of ΔG of reaction [6], the content of Al-loss during VD increases.

Fig. 9. Relationship between ΔG of reaction [2] and Al-oxidation during VD. (Online version in color.)
The calculated results show that the reaction of Al and CaO occurs more easily under vacuum condition. As the driving force of reaction [6] increases, more Ca would diffuse into molten steel. Part Ca reacts with the high-melting point MgO–Al2O3 or CMA, resulting in the increase of CaO in inclusions,33) as given in Eqs. (9) and (10). As can be seen from Fig. 4(c3), the size of CMA inclusion is more than 70 μm and several MgO–Al2O3 are distributed into the inclusion. The large-size CMA inclusion may be generated by the aggregation of small-size CMA inclusion with inner MgO–Al2O3 core. Chen et al.34) and Jiang et al.35) studied the formation mechanism of CMA inclusions by a confocal scanning laser microscope. They all found that low-melting-point small CMA inclusions tend to collide and aggregate into large-size ones in molten steel.
|
x[Ca]+yMgO-z
Al
2
O
3
=
xCaO-(y-x)MgO-z
Al
2
O
3
+x[Mg]
| (9) |
|
[Ca]+xCaO-yMgO-z
Al
2
O
3
=
(x+1)CaO-(y-1)MgO-z
Al
2
O
3
+[Mg]
| (10) |
Combining Figs. 2 and 4, it is speculated that the large-size CMA inclusions can possibly inherit to the bloom, implying that the low-melting-point inclusion is not easy to remove. The removal of inclusions is divided into three steps: transfer to the slag-metal interface, pass through the interface and dissolve into molten slag. When the inclusion capacity in slag is not saturated, the second step is the rate-determining step for inclusion removal.36) The schematic diagram of inclusion removal at the interface is shown in Fig. 10. The thermodynamic condition for inclusion passing through slag-metal interface is given as follows:
|
σ
slag-inclusion
-
σ
steel-inclusion
+
σ
steel-slag
σ
steel-slag
⋅
2R
h
+1∠0
| (11) |
Where R is the radius of inclusion, σ is interfacial energy and h is the height of inclusion in molten steel. From Eq. (11), the larger the value of σsteel-inclusion and radius of inclusion, the greater possibility to across the interface. The interfacial energy between Al2O3, MgO–Al2O3, liquid CaO–Al2O3 and steel is 2050 mJ/m2, 3700 mJ/m2 and 1600 mJ/m2,37,38) respectively, which indicates that liquid CaO–Al2O3 is less likely to pass through slag-metal interface compared to Al2O3 and MgO–Al2O3. Lee et al.39) and Misra et al.40) studied the separation behavior of liquid and solid inclusions at the interface by confocal scanning laser microscope and also found that the separation time of liquid inclusion is much larger than that of solid inclusion.
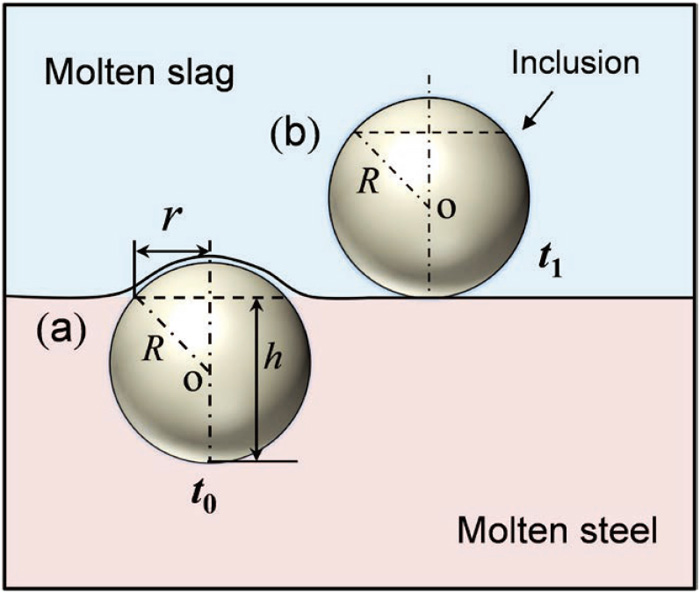
Fig. 10. Schematic of inclusion removal at slag-metal interface. (Online version in color.)
Based on the analysis in this section, the formation and removal behavior of liquid CMA inclusions are summarized, as shown in Fig. 11. Under high vacuum and argon stirring condition, molten steel reacts with slag violently, resulting in the decrease of Al and CaO and generation of Ca. At the steel-gas interface, Ca would evaporate into gas, which accelerates the reaction between Al and CaO. Meanwhile, at the steel-inclusion interface, the dissolved Ca reacts with high-melting-point MgO–Al2O3 or CMA inclusions, leading to the increase of CaO in inclusions. Due to the low interfacial energy between inclusions and steel, the modified low-melting-point CMA inclusions are prone to remain in the molten steel. In addition, the small-size CMA inclusions would aggregate into large-size ones and finally inherit to bloom.

Fig. 11. Formation and removal of liquid CMA inclusions during VD treatment. (Online version in color.)
In order to decrease the occurrence frequency of liquid CMA inclusions, it is of great importance to suppress the reaction between Al and CaO during the VD process. In this section, the effects of steel and slag chemical compositions on reaction extent are fully studied.
4.4.1. Effect of Al Content in Steel and Slag Basicity on Reaction between Al and CaO
According to Eq. (7), the value of ΔG under different Al and slag basicity is calculated, and the thermodynamic nephogram is illustrated in Fig. 12. The Al content ranges from 0.005 mass% to 0.05 mass%, the content of MgO is set as 7 mass% and Al2O3 set as 25 mass%, respectively. The sum of CaO and SiO2 is 68 mass%. The dashed line represents ΔG is 0, area above the dashed line means the reaction between Al and CaO can occur, and vice versa. It can be seen that as Al content increases, the critical slag basicity decreases. By extracting and fitting the data of ΔG=0, the relationship between Al content and slag basicity is solved, as expressed in Eq. (12):
|
(mass%CaO)
(mass%SiO
2
)
=156.43-147×{
1-exp(
-[mass%Al]
0.0019
)
}
-6.55×{
1-exp(
-[mass%Al]
0.013
)
}
| (12) |
The value of the R-square is 0.99. When the Al content is 0.02 mass%, the corresponding critical slag basicity is 4.2, and when Al content increases to 0.03 mass%, the critical value decreases to 3.50. From Tables 1 and 2, the content of Al is 0.032 mass%, and the mass ratio of CaO/SiO2 is 4.83 at the end of LF, higher than the critical slag basicity of 3.48, which means that the thermodynamic driving force of the reaction between Al and CaO is large during VD process.

Fig. 12. Thermodynamic nephogram of ΔG under different Al and slag basicity. (Online version in color.)
Figure 13 shows the thermodynamic nephogram of ΔG under different Al and Al2O3 contents. The Al content ranges from 0.005 mass% to 0.05 mass%, the content of MgO is set as 7 mass%, Al2O3 content differs from 20 mass% to 30 mass%, the mass ratio of CaO/SiO2=4. As the Al content in steel increases, the corresponding Al2O3 content in slag also should be increased. The dashed line represents ΔG is 0, the area right of the dashed line means the reaction between Al and CaO can occur, and vice versa. The relationship between Al and Al2O3 is fitted, as given in Eq. (13):
|
(
mass%Al
2
O
3
)=378×[mass%Al]+16.63
| (13) |
The value of the R-square is 0.99. When the Al content is 0.02 mass%, the Al2O3 content should be controlled at 23.98 mass%. When the Al content increases to 0.03 mass%, in order to inhibit the reaction between Al and CaO, the corresponding Al2O3 content increases to 28.15 mass%.

Fig. 13. Thermodynamic nephogram of ΔG under different Al and Al2O3 contents. (Online version in color.)
Based on the analysis of section 4.4, the smelting process has been adjusted as follows. By adjusting the addition of Al during EAF tapping and LF refining, the Al content at the end of LF is controlled at 0.018–0.030 mass%. At end of LF, the average Al2O3 content increases slightly to 25 mass%, MgO content maintains at 7 mass%, CaO content decreases to 55 mass% while SiO2 content increases to 13 mass% by adjusting the addition of CaO–Al2O3 premelted slag, lime, SiC and so on. 100 groups of industrial experiments were carried out to verify the reasonability of new technology. The relationship between Al-loss during VD and content of Al at the end of LF after optimization is illustrated in Fig. 14. The fitted equation is expressed as follows.
|
[mass%Al]
Al-loss during VD
=
0.947×
[mass%Al]
at the end of LF
-0.012
| (14) |
The average oxidation extent of Al during VD is 45.94%, much lower than that before optimization. Less Al-loss means less generation of Al2O3-containing inclusions, which is beneficial for steel cleanliness.

Fig. 14. Relationship between Al-loss during VD and Al content at end of LF after optimization. (Online version in color.)
The average slag compositions after optimization are shown in Fig. 15. It can be seen that the content of CaO at the end of LF after optimization is lower while Al2O3 is higher than that before optimization. Meanwhile, the content of CaO-loss and Al2O3-increase during VD process is 0.90 mass%, 0.97 mass%, respectively, reflecting that the compatibility of slag and steel is supposed to be fine under such conditions.

Fig. 15. The average slag compositions after optimization. (Online version in color.)
In addition, the same sampling plan was adopted during the new steelmaking process. The chemical compositions of steel and slag after optimization are listed in Tables 3 and 4. The content of Al-loss during VD treatment is 0.008 mass%, much lower than that before optimization. Meanwhile, the content of Al2O3 is 26.57 mass%, the ratio of CaO/SiO2 is 4.32 at the end of LF. The oxygen content in steel decreased from 0.0019 mass% at the end of LF to 0.0013 mass% after the VD, which indicates that decreasing the Al-loss during VD process is more favorable for steel cleanliness. The optimized steel and slag compositions is conducive to obviously weakening the reaction between Al and CaO during the VD process.
Table 3. Chemical compositions of three steel samples after optimization (mass%).
| Samples | C | Si | Mn | Cr | Mo | Als |
|---|
| LF-1 | 0.29 | 0.19 | 0.64 | 0.99 | 0.15 | 0.015 |
| LF-2 | 0.42 | 0.25 | 0.68 | 1.03 | 0.16 | 0.024 |
| VD-1 | 0.42 | 0.24 | 0.67 | 1.03 | 0.16 | 0.016 |
| Samples | S | P | Ca | Mg | O | N |
|---|
| LF-1 | 0.0064 | 0.0097 | 0.0001 | 0.0003 | – | – |
| LF-2 | 0.0026 | 0.0099 | 0.0002 | 0.0004 | 0.0019 | 0.0054 |
| VD-1 | 0.0018 | 0.0095 | 0.0003 | 0.0002 | 0.0013 | 0.0039 |
Table 4. Chemical compositions of three slag samples after optimization (mass%).
| Samples | CaO | Al2O3 | SiO2 | MgO | FeO | MnO |
|---|
| LF-1 | 55.43 | 25.76 | 11.06 | 6.33 | 0.53 | 0.32 |
| LF-2 | 55.22 | 26.57 | 12.77 | 6.87 | 0.42 | 0.38 |
| VD-1 | 54.49 | 27.41 | 12.79 | 7.76 | 0.55 | 0.45 |
The samples before and after VD were examined by automatic scanning analysis.
The inclusion compositions are shown in Fig. 16. The average composition of inclusions is 77 mole% Al2O3-14 mole% CaO-9 mole% MgO at end of LF, and 67 mole% Al2O3-26 mole% CaO-7 mole% MgO after VD. The content of CaO in inclusion after VD is lower than before optimization. The number densities of CMA inclusions is 2.78 per mm2, indicating the steel cleanliness is significantly improved. In addition, the number densities of CMA inclusions over 20 μm after VD decreases from 0.07 per mm2 to 0.02 per mm2. These results reflect the reasonability of optimized technology.
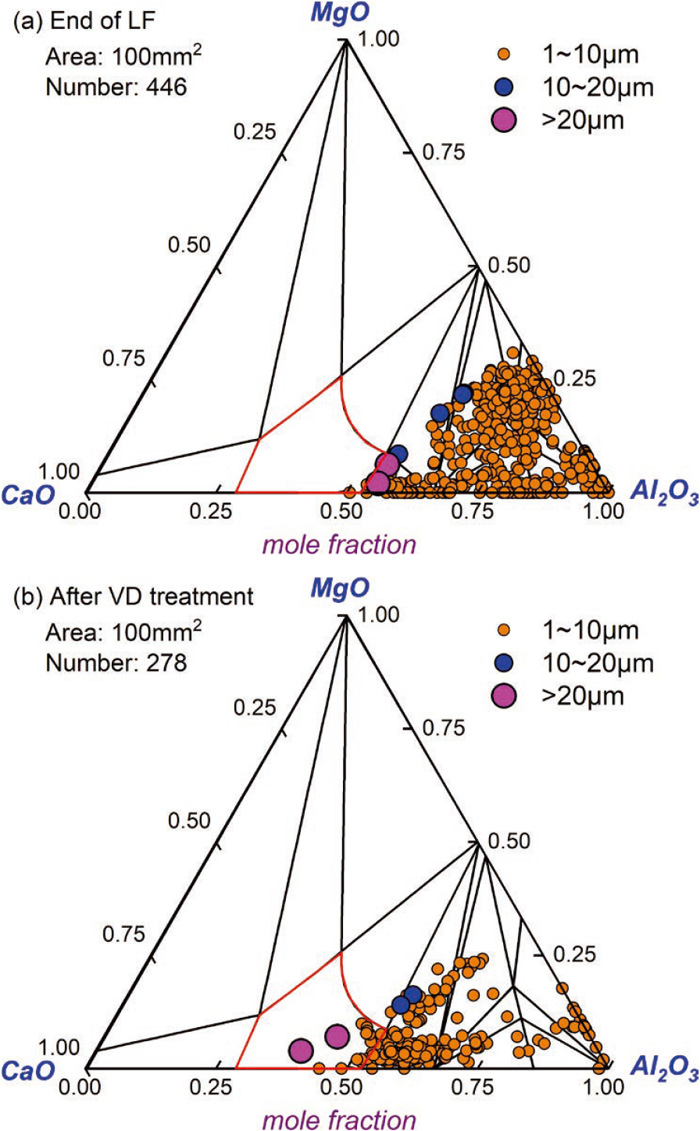
Fig. 16. Composition distribution of CMA inclusions during refining process after optimization, (a) At end of LF; (b) After VD treatment. (Online version in color.)
5. Conclusions
(1) The CMA inclusions over 20 μm in round bloom can be classified into two groups: one is the CaO–MgO–Al2O3 inclusions with homogeneously distributed compositions, and another is complex inclusions with MgO–Al2O3 as the core and CaO–Al2O3 as the periphery. The CMA inclusions are all located in the liquid region (<1873 K) of CaO–MgO–Al2O3 phase diagram.
(2) The large-size CMA inclusions are mainly originated from VD treatment. Under high vacuum conditions, the reaction between Al and CaO results in the oxidation of Al and dissolved Ca in molten steel. Part Ca diffuses into the low-pressure environment in the form of gas. The remnant Ca would react with the high-melting-point MgO–Al2O3 or CMA, leading to the increase of CaO in inclusions. Due to the low interfacial energy between steel and inclusions, the modified low-melting-point CMA inclusions are prone to remain in molten steel.
(3) In order to decrease the Ca content in steel and the occurrence frequency of CMA inclusions, the equilibrium relationship between Al and CaO under vacuum conditions was calculated. Under the same ratio of CaO/SiO2, with Al content increases, the corresponding Al2O3 content should be increased. Under the same Al2O3 content, with Al content increases, the ratio of CaO/SiO2 should be decreased.
(4) The industrial experiments were carried out under the new slag and steel system. The results showed that the steel cleanliness was obviously improved. The average oxidation extent of Al during VD decreases from 67.73% to 45.94% before and after optimization The CMA inclusions over 20 μm after VD decreases from 0.07 per mm2 to 0.02 per mm2.
Acknowledgements
The authors wish to express their gratitude to Jiangsu Yonggang Group Co., Ltd. for the support in terms of sampling operation and production data.
References
- 1) P. Y. He, R. J. Hong, H. Wang and C. Lu: Int. J. Fatigue, 111 (2018), 233. https://doi.org/10.1016/j.ijfatigue.2018.02.024
- 2) N. Tsunekage, K. Hashimoto, T. Fujimatsu and K. Hiraoka: Sanyo Tech. Report, 18 (2011), 23 (in Japanese).
- 3) X. D. Miu, C. M. Yu, C. M. Shi, J. F. Du, H. G. Zhu and G. G. Cheng: J. Univ. Sci. Tech., Beijing, 29 (2008), 771 (in Chinise). https://doi.org/10.13374/j.issn1001-053x.2007.08.004
- 4) J. M. Zhang, S. X. Li, Z. G. Yang, G. Y. Li, W. J. Hui and Y. Q. Weng: Int. J. Fatigue, 29 (2007), 765. https://doi.org/10.1016/j.ijfatigue.2006.06.004
- 5) Y. Neishi, T. Makino, N. Matsui, H. Matsumoto, M. Higashida and H. Ambai: Metall. Mater. Trans. A, 44 (2013), 2131. https://doi.org/10.1007/s11661-012-1344-9
- 6) H. Ohta, S. Kimura, T. Mimura and H. Matsumoto: Kobe Steel Eng. Reports, 61 (2011), 98 (in Japanese).
- 7) K. Kawakami, T. Taniguchi and K. Nakashima: Tetsu-to-Hagané, 93 (2007), 743 (in Japanese). https://doi.org/10.2355/tetsutohagane.93.743
- 8) X. D. Miao, G. Q. Xu, Q. H. Chen and H. Zhao: Steelmaking, 23 (2007), 21 (in Chinese).
- 9) Y. T. Xu, Z. P. Chen and B. Q. Yang: Steelmaking, 32 (2016), 49 (in Chinese).
- 10) K. Riyahimalayeri, P. Ölund and M. Selleby: Ironmak. Steelmak., 40 (2013), 470. https://doi.org/10.1179/174328113X13711140547880
- 11) M. Jiang, X. H. Wang, D. Yang, S. L. Lei and K. P. Wang: Metall. Mater. Trans. B, 46 (2015), 2573. https://doi.org/10.1007/s11663-015-0438-3
- 12) H. J. Wu, Q. Q. Li, C. Y. Wei and Z. Wang: Metall. Res. Technol., 116 (2019), 1. https://doi.org/10.1051/metal/2018096
- 13) M. Nagao, K. Hiraoka and Y. Unigame: Sanyo Technical Report, 12 (2005), 38 (in Japanese).
- 14) H. Hyogo and S. Higuchi: Sanyo Special Steel Co., Ltd., https://www.sanyo-steel.co.jp/system/upload/news_en/180727_e.pdf, (accessed 2018-07-18).
- 15) L. Liu, J. W. Fan, P. Wang and L. Wang: Iron and Steel, 52 (2017), 34 (in Chinese).
- 16) Z. Q. Song, W. Liu, S. F. Yang, J. S. Li, Y. F. Chen and X. T. Zuo: Iron and Steel, 56 (2021), 68 (in Chinese).
- 17) K. Matsuoka, T. Terabatake, K. Kameyama, H. Kawashima, T. Murai, Y. Ito and J. Kubota: Proc. of 4th Int. Cong. Sci. Technol. of Steelmak. (ICS2008), ISIJ, Tokyo, (2008), 457.
- 18) S. J. Li, G. G. Cheng, Z. Q. Miao, L. Chen, C. W. Li and X. Y. Jiang: ISIJ Int., 57 (2017), 2148. https://doi.org/10.2355/isijinternational.ISIJINT-2017-227
- 19) Y. J. Kang, F. Li, K. Morita and S. C. Du: Steel Res. Int., 77 (2006), 785. https://doi.org/10.1002/srin.200606463
- 20) Z. Y. Deng and M. Y. Zhu: ISIJ Int., 53 (2013), 450. https://doi.org/10.2355/isijinternational.53.450
- 21) J. H. Park and H. Todoroki: ISIJ Int., 50 (2010), 1333. https://doi.org/10.2355/isijinternational.50.1333
- 22) C. Y. Liu, Y. Jia, L. X. Hao, S. W. Han, F. X. Huang, H. X. Yu, X. Gao, S. Ueda and S. Kitamura: Metals, 11 (2021), 1. https://doi.org/10.3390/met11050763
- 23) M. Jiang, X. H. Wang, B. Chen and W. J. Wang: ISIJ Int., 50 (2010), 95. https://doi.org/10.2355/isijinternational.50.95
- 24) K. Mizuno, H. Todoroki, M. Noda and T. Tohge: Iron and Steelmaker(USA), 28 (2001), 93. https://www.researchgate.net/publication/275406986
- 25) W. Y. Cha, D. S. Kim, Y. D. Lee and J. J. Pak: ISIJ Int., 44 (2004), 1134. https://doi.org/10.2355/isijinternational.44.1134
- 26) B. Song and Q. Y. Han: Metall. Mater. Trans. B, 29 (1998), 415. https://doi.org/10.1007/s11663-998-0119-6
- 27) J. Zhang: Calculated Thermodynamics of Metallurgical Melts and Solution, Metallurgical Industry Press, Beijing, 2007.
- 28) S. J. Li, G. G. Cheng, L. Yang, L. Chen, Q. Z. Yan and C. W. Li: ISIJ Int., 57 (2017), 713. https://doi.org/10.2355/isijinternational.ISIJINT-2016-655
- 29) X. M. Yang, J. P. Duan, C. B. Shi, M. Zhang, Y. L. Zhang and J. C. Wang: Metall. Mater. Trans. B, 42 (2011), 738. https://doi.org/10.1007/s11663-011-9491-8
- 30) S. J. Li, G. G. Cheng, Z. Q. Miao, W. X. Dai, L, Chen and Z. Q. Liu: ISIJ Int., 58 (2018), 1781. https://doi.org/10.2355/isijinternational.ISIJINT-2018-072
- 31) H. Ohta and H. Suito: ISIJ Int., 36 (1996), 983. https://doi.org/10.2355/isijinternational.36.983
- 32) H. Todoroki and K. Mizuno: ISIJ Int., 44 (2004), 1350. https://doi.org/10.2355/isijinternational.44.1350
- 33) T. Yoshioka, K. Nakahata, T. Kawamura and Y. Ohba: ISIJ Int., 56 (2016), 1973. https://doi.org/10.2355/isijinternational.ISIJINT-2016-324
- 34) R. Chen, Z. P. Chen, Y. T. Xu, C. D. Zhou and D. Shu: J. of Iron and Steel Res., 12 (2015), 48 (in Chinese). https://doi.org/10.13228/j.boyuan.issn1001-0963.20140397
- 35) M. Jiang, K. P. Wang, Z. W. Hou and X. H. Wang: Chinese J. of Eng., 38 (2016), 780 (in Chinese). https://doi.org/10.13374/j.issn2095-9389.2016.06.006
- 36) G. N. Shannon and S. Sridhar: Scand. J. Metall., 34 (2005), 353. https://doi.org/10.1111/j.1600-0692.2005.00755.x
- 37) K. Ogino, S. Hara, T. Miwa and S. Kimoto: Tetsu-to-Hagané, 65 (1979), 2012 (in Japanese). https://doi.org/10.2355/tetsutohagane1955.65.14_2012
- 38) N. Zouvelou, X. Mantzouris and P. Nikolopoulos: Int. J. Adhes. Adhes., 27 (2007), 380. https://doi.org/10.1016/j.ijadhadh.2006.09.005
- 39) S. H. Lee, C. Tse, K. W. Yi, P. Misra, V. Chevrier, C. Orrling, S. Sridhar and A. W. Cramb: J. Non. Cryst. Solids., 282 (2001), 41. https://doi.org/10.1016/S0022-3093(01)00327-1
- 40) P. Misra, V. Chevrier, S. Sridhar and A. W. Cramb: Metall. Mater. Trans. B, 31 (2000), 1135. https://doi.org/10.1007/s11663-000-0090-3