Abstract
This study explores the underlying mechanism between secondary refining efficiency, gas flow rate, and slag properties. The secondary refining efficiency is directly affected by the slag-metal interface area. Traditionally, the slag-metal interface has been limited to the liquid-liquid interface of the ladle cross-section and does not include the interface area between the entrained slag droplets and metal. To investigate the interface area with different slags and metals under various bottom blow rates, a physical model of a single-nozzle gas-stirred ladle was established using oil to simulate slag and water to simulate metal. The roles of relevant variables that affect the volume of entrained oil, the diameter of entrained droplets, and interface area were studied, as well as oil viscosity, interfacial tension, and oil thickness. Experimental data were collected using colorants and image processing techniques. Based on these findings, the increase in gas flow rate and oil layer thickness increased the volume of entrained oil and interface area, while the increase in oil viscosity and interfacial tension decreased these parameters. When the gas flow rate increased, the mean diameter of droplets first increased and then decreased. However, the specific surface area of droplets revealed the opposite trend. Furthermore, the mean diameter and specific surface area increased and decreased with increasing oil-layer thickness.
1. Introduction
In the secondary refining process, desulfurization is mainly dominated by the slag-metal interaction,1,2,3) which determines the area of the slag-metal interface and subsequently, affects the slag forming rate and desulfurization efficiency.4)
The desulfurization rate as given by Ahindra5) is revealed as Eq. (1)
|
-
d[
W
S
]
dt
=
k
S
A
V
(
[
W
S
]-
(
W
S
)
L
S
)
| (1) |
where [
Ws] and (
Ws) refer to the sulfur content in metal and slag (wt%), respectively,
ks is the mass transfer coefficient of sulfur (m/s),
A is the interface area (m
2),
V is the volume of metal (m
3), and
Ls is the distribution coefficient of sulfur.
Equation (1) indicates that the desulfurization rate
6,7) is directly proportional to the interfacical area when the slag has suitable properties.
Several researchers1,2,3) have attributed this to desulfurization, which mainly occurs at the initial slag-metal interface. However, owing to the influence of force imbalance, Kelvin-Helmholtz instability and Rayleigh-Taylor instability, the slag-metal boundary can become unbalanced, resulting in slag droplets entering the molten metal. Generally, the interface area can be increased by increasing the intensity of interface fluctuation and entrainment volume in the ladle. Mainly, the slag-metal interface fluctuation and entrainment phenomenon in the ladle cause an increase in the interface area. Moreover, Mietz et al.8,9) demonstrated that droplet emulsification was responsible for the acceleration of mass transfer. The entrainment phenomenon in the ladle directly led to improves desulfurization refining efficiency.10)
In the 1850s, entrainment was proven to occur as slag droplets were found in molten metal.11) Currently, the research on the entrainment phenomenon in the ladle is mainly performed with the help of industrial practice, physical simulations, and numerical simulations.
Based on the cold model research, Iguchi et al.12) established an empirical relationship for ladle entrained slag. This relationship is affected by the phase physical properties, ladle size, and gas flow rate. In addition, it was demonstrated that the kinematic viscosity of the slag has a significant effect on the critical velocity required for entrainment.13) Jönsson et al.14) further proved that slag viscosity is a key factor affecting slag entrainment. By establishing a cold model of the water-oil system, Dayal and Du et al.15,16) found that the shear force between the liquid slag and liquid steel played an important role in the slag metal mixing process. Industrial experiments revealed that, slag droplets appeared in the molten metal, and a thin metal film was present around the slag. It was once again proven that the slag droplets can be entrained into the molten metal.15) Simultaneously, a sphere-bed phenomenon appeared near the open-eye and affected the removal methods of inclusions.16) Petri and Jari et al.17,18) used a simplified physical model of a water-oil system to study the entrainment behavior in the ladle. The mean droplet size in the system is 2–3 mm. The critical velocity required for emulsification and the diameter of the entrained oil droplets increased as the oil viscosity, interfacial tension, and oil layer thickness increased. An increase in the density difference caused the critical velocity and droplet diameter to increase and decrease, respectively. The critical speed findings were also confirmed by Kitamura.19) In addition Visuri et al.20) reported that the droplets were smaller than the bubbles.
Numerical simulations have been increasingly applied in research studies with advancements in calculation methods and capabilities.21,22) For example, several researchers17,23,24,25,26,27) have used the Volume of Fluid (VOF) to capture the slag-metal interface. Singh et al.28) found that the interfacial area first increased and then decreased with the increase in gas flow rate. Petri and Visuri et al.25) identified that the droplets Sauter diameter was between 4 and 6 mm and the generation rate of the interfacial area between 0.2 and 0.6 m2·s−1. With numerical simulation methods (VOF), it can be difficult to reproduce the entrainment phenomenon, and large model scales have the difficulty of limited computing powers or numerical methods. Through water-oil system experiments, similarities in the physical sense can be achieved.
Thus, this report aims to contribute to understanding the main factors that influence slag-metal interactions during the secondary refining process. A physical model was developed to study the influence of slag layer thickness, gas flow rate, slag viscosity and interfacial tension on entrainment volume, diameter distribution of entrained slag, interfacial area, and specific interface area.
2. Experimental
2.1. Experiment
The study was carried out using a physical model, developed based on the similarity principle according to a refining 120 t ladle used in practice. The dimensions of the 1:6 scaled-down model and fluid were determined based on the modified Froude.29) Equation (3) was used to determine the gas flow in the current model with one tuyere. The dimensions of the cold model and experimental setup are displayed in Fig. 1.
|
F
r
′
=
ρ
l
ρ
l
-
ρ
g
v
2
gH
| (2) |
|
Q
m
=
[
(
ρ
g,p
ρ
g,m
)
(
ρ
l,m
ρ
l,p
)
(
d
m
d
p
)
4
(
H
m
H
p
)
]
1
2
Q
p
| (3) |
where
F
r
′
is the modified Froude number,
ρl and
ρg are the densities of liquid and gas respectively (kg/m
3),
v is the gas velocity (m/s), g is the acceleration due to gravity (m/s
2),
H is the characteristic length (m),
d is the diameter of tuyere (m),
Q is the gas flow, and the subscripts m and p refer to the model and prototype, respectively. The maximum gas flow rate used in the cold model is 9 L/min. The flow interval used in the experiment was 1 L/min.
A high-speed camera with a resolution of 1280×1024 and a maximum frame rate of 200 FPS (frames per second) was used for experimental recording. The data were saved at 15 FPS. Before starting the experiment, the mixture of water and oil was allowed to stand to ensure that the water and oil did not dissolve in each other. The gas flow rate in each experiment was controlled by a gas flowmeter. The camera started recording when the bottom blow and the bath flow were stable. Each experiment was repeated five times.
2.1.1. Area Analysis of Slag-eye
Open-eye formation in a gas stirred ladle has been the subject of many studies, including physical30,31,32) and numerical modeling studies.31,33) Ten pictures were recorded using the camera when the open-eye shape was relatively stable. Image processing and a non-dimensionalized process were used to obtain the resulting differential open-eye area. The open-eye area was evaluated using the ImageJ software, and an example of a processed image is displayed in Fig. 2. The open-eye ratio was calculated using the following equation.
Where Se and Sa are the open-eye area and total area of the oil layer surface, respectively. For a certain gas flow rate, the average was recorded as the final open-eye rate, reducing experimental errors.
2.1.2. Droplets Analysis of the Entrainment Slag
Different droplet sizes were formed when the slag was entrained into the metal phase during blowing. To analyze the size distribution of the droplets in the bath, ImageJ was used to determine the droplet diameter, di. The mean diameter can be written as Eq. (5).
|
d
m
=
1
n
∑
i=1
n
d
i
| (5) |
where
dm is the mean diameter, and
i is the number of statistical droplets. The average number can be expressed by
Eq. (6).
|
n=INT(
6
V
e
π
d
m
3
)
| (6) |
where
Ve is the volume of entrained oil, which is measured indirectly using the drawer principle. A circular baffle was installed on one side of the ladle at the water-oil interface. Under quasi-stable conditions, the oil layer separated from the entrainment droplets when the baffle was quickly pushed.
The total surface area of the droplets can be approximated by using Eq. (7). To evaluate the chemical reaction rate or mass transfer rate, the specific surface area was utilized. The specific surface area is represented by Eq. (8).
Where Ad is the interface area of the slag droplets (dm2), and a is the specific interface area (dm2/L).
2.2. Physical Property Measurement
The physical property parameters used to simulate the metal phase, and slag phase are illustrated in Table 1. To ensure the precision of test, the experiment was carried out by performing the following points at a room temperature of 25°C:
1) To precisely control the temperature of the liquid to be tested, often a water bath.
2) Ensure the uniformity of liquid.
3) Ensure the cleanness of the structure of the instrument.
4) Judge the measurement result by the standard sample.
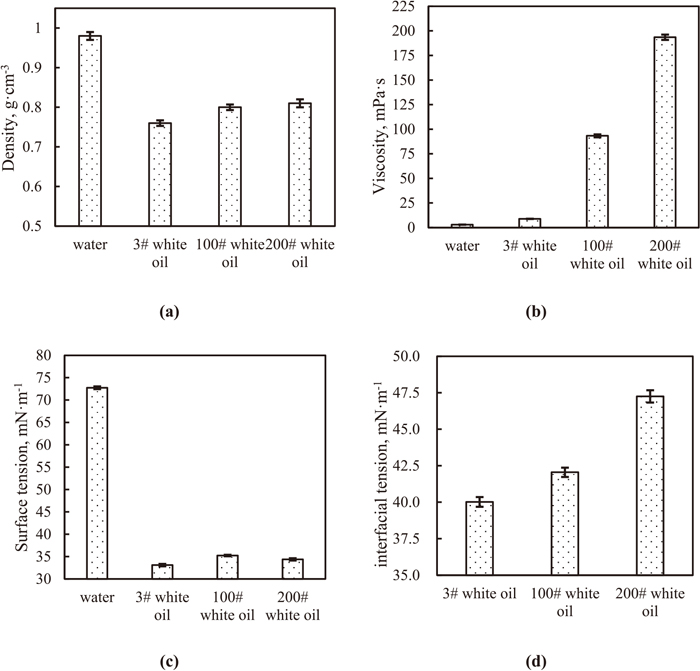
Table 1. Physical property of the fluids.
| Parameters | Water | 3# white oil | 100# white oil | 200# white oil |
|---|
| Density, g·cm−3 | 0.98 | 0.76 | 0.80 | 0.81 |
| Viscosity, mPa·s | 3 | 8.9 | 93.3 | 193.5 |
| Surface tension, mN·m−1 | 72.75 | 33.10 | 35.24 | 34.38 |
| Water-oil interfacial tension, mN·m−1 | – | 40.02 | 42.05 | 47.25 |
Note: measured value
The densities of fluids used in the current study were measured by the balance measuring cylinder method. Due to the importance of viscosity and interfacial tension of fluids, the measurement details were thus focused. The MZ-NDJ-5S rotary viscosimeter was used to measure the fluid viscosity in the experiment. When measuring, carries on the operating steps.
1) The measured liquid, ready to put measured liquid, is not less than 60 mm in diameter, height not less than 120 mm beaker.
2) On the rotor protection, after carefully adjusting the level of the instrument, ensure instrument in the level of work state.
3) Reference range table, select the adaptation of rotor screwing in rotor connecting head.
4) Slowly adjust elevator knob, and adjust the rotor in the measured liquid level.
Also, based on the du Noüy ring method, the interfacial tension was measured by the DCAT21 tensiometer. In interfacial tension measurements, the main steps need to be followed.
1) The ring is first immersed in the denser phase which is water. Then the less dense liquid is poured on top.
2) Care must not contaminate the ring when pouring the liquid.
3) The measurement is then started, and the sample stage with the liquid container is moved down.
4) When the ring is at the interface, the software will detect that automatically and continue to move the stage down until the detected force starts to drop.
3. Results and Discussion
3.1. Physical Property Measurement Result
Measurements were repeated five times to reduce errors, and the average value was calculated. The measurement error bar of physical property parameters is illustrated in Fig. 3. Overall, the results of this measurement suggest excellent reliability and acceptable measurement errors.
3.2. Slag Entrainment Phenomenon
In the experiment, the oil was dyed red to facilitate analysis. Interestingly, many oil droplets were formed in the water phase due to shear effects at the interface. Furthermore, a sphere-bed of entrained droplets was formed when the droplets floated up to the interface, as depicted in Fig. 4. This phenomenon was reported in a study by Kang et al.16) (Fig. 4(c)). When droplet formation, combination, and breakage are balanced, the sphere-bed maintains its thickness during the blowing process. The sphere-bed formation not only sharply increased the interfacial area but also changed the morphology of the water-oil interface. In addition, at a gas flow rate of 6 L/min, a water droplet wrapped with an oil film was observed in the water-oil system (Fig. 4(b)). It provided almost twice the interfacial area than oil droplets of the same size. However, it was noted that the water droplet did not appear when the gas flow rate was relatively small (Fig. 4(a)) 3 L/min). In reality, the interface interaction and mass transfer efficiency between slag and molten metal would be further increased if the metal droplets were wrapped by slag, but this was not favorable for yield. As a result, metal entrainment into the slag should be controlled carefully in different stages of the refining process, given the factors discussed in the following section. Furthermore, the experiment demonstrated that the bubbles generated by bottom blowing caused quasi-periodic tangential pulsation of liquid metal at the oil-water interface (Fig. 4(b)). Slag-metal interface instability occurred when the bubbles indirectly went through the interface and broke up at the air surface. This fluctuation phenomenon also causes the appearance of water droplets. Further research is required to investigate the complexity of this instability.

To investigate the open-eye formed by the bottom blowing plume, the flow rates, and slag layer thickness were considered, as displayed in Fig. 5. Generally, the open- eye ratio is an increasing function of flow rate. This view is supported by many researchers.34,35,36) According to the results, the ratio of open-eye increased by 21% when the gas flow rate increased from 1 to 5 L/min for the slag layer thickness of 15 mm. However, the ratio only increased by 3% when the gas flow rate increased from 5 to 9 L/min. Based on similar trends in the results of other layer thicknesses, the flow rate is no longer the major factor influencing the open eye if it is higher than a critical value. In addition, the open-eye ratio decreased as the oil layer thickness increased. The ratio of open-eye decreased by 42% and 59% when the oil layer thickness increased by 67% and 134%, respectively. In comparison, the oil layer thickness was 15 mm, and the gas flow rate was 5 L/min. Generally, the open-eye ratio is significantly affected by the gas flow rate when the slag layer is thin. However, a further increase in the oil-layer thickness inhibited the influence of the gas flow rate.

Although the entrainment phenomenon is conducive to removing impurities in liquid steel, it is not recommended for clean steel. The total slag entrainment volume is important for realizing a secondary refining control process. Figure 6 displays the effects of the gas flow rate and oil layer thickness on the entrainment volume. It can be seen from Fig. 6 that the volume of entrained oil increased with the increasing gas flow rate and decreased when the slag layer became thicker. It should be noted that an increase in the gas flow rate increased the volume of entrained oil only up to a certain level. Subsequently, a further increase in the gas flow rate had a weaker effect on the volume of entrained oil. At an oil layer thickness of 25 mm, the volume of entrained oil increased by 106%, 212%, and 212% when the gas flow rate was increased from 2 to 4, 6, and 8 L/min, respectively. At a gas flow rate of 9 L/min, the volume of entrained oil decreased by 51% and 103% when the oil layer thickness increased from 15 to 25 and 35 mm, respectively.

Figure 7 illustrates the relationship between entrained oil and the total volume of oil. Compared with the results in Fig. 6, a similar trend was noted in that the ratio was an increasing function of the gas flow rate. In addition, the entrainment ratio was 33% for a slag thickness of 15 mm, compared to a ratio of 28% for a slag thickness of 35 mm. This finding indicates that entrainment slag is not proportional to the total slag volume. The entrainment ratio remained below 35% regardless of flow rate and slag thickness.
3.5. Size of the Slag Entrainment
The interaction between molten steel and slag is influenced not only by the entrained slag volume, but also by the size of the slag droplets. Accordingly, the effects of oil layer thickness and gas flow rate on the mean oil diameter were investigated and are presented in Fig. 8.

Generally, the mean diameter decreases with increasing oil layer thickness. Figure 8 also depicts that the increase in gas flow rate increased the mean diameter of entrained droplets when the gas flow rate was relatively small, and then further increases in gas flow rate displayed a decreasing tendency. At an oil layer thickness of 25 mm, the mean oil droplet diameter increased by 22% when the gas flow rate was increased from 2 to 4 L/min. The mean diameter decreased by 11% and 33% when the gas flow rate increased from 2 to 6 and 8 L/min, respectively. A more intense force was formed at the water-oil interface when the gas flow rate was increased. As a result, more oil was pulled down into the water phase owing to the shear stress, which led to the formation of larger oil droplets. As the flow intensity increased, the large oil droplets formed were broken into smaller oil droplets. In this blowing stage, the higher flow rates produced smaller droplets. These results are not similar to studies by Kang, Frohberg, and Wei et al.15,32,33) According to Kang, Frohberg and Wei et al.,16,37,38) an increase in the gas flow rate decreases the mean oil diameter. The main reason for this variation is that the range of gas flow studied was inconsistent, or the shear velocity was different.
3.6. Interfacial Area
When slag possesses good properties in the secondary refining process, the interface area directly affects the desulfurization rate. According to the experiments (Fig. 9(a)), the interfacial area of the formed droplets was positively associated with gas flow rate at less than 8 L/min. However, the interfacial area was almost the same for different oil layer thicknesses when the gas flow rate was 2–6 L/min. When the gas flow rate was higher than 6 L/min, the effect of oil layer thickness was more prominent.

The interfacial reaction efficiency is not only related to the interfacial area of the droplets but also requires the evaluation of specific interfacial areas. The functions of reservoir thickness, gas flow and specific interface area are demonstrated in Fig. 9(b). Compared with the Figs. 8, 9(b) reveals the opposite trend. The specific interface area decreased as the slag layer thickness increased. At a gas flow rate of 9 L/min, the specific interface area decreased by 17% and 29% when the oil layer thickness increased from 15 to 25 and 35 mm, respectively. At an oil layer thickness of 25 mm, the specific interface area increased by 25% when the gas flow rate increased from 2 to 3 L/min. Furthermore, the specific interface area increased by 51% and 101% when the gas flow rate increased from 3 to 6 and 8 L/min, respectively. When strong stirring was performed, the size of entrained droplets decreased, and the specific interface area, as well as interfacial area, increased. Therefore, the droplet breakage effect is the key to influencing the specific interface area. The smaller the mean diameter of generated droplets, the more the specific interface area increases when the gas flow rate reaches a certain value.
3.7. Viscosity and Interfacial Tension
This study focused not only on the gas flow rate and oil layer thickness but also on the physical properties of the oil, such as the oil-water interfacial tension and viscosity. Considering viscosity, the interfacial tension between water and oil differed when different oils were applied. At a gas flow rate of 4 L/min and an oil layer thickness of 25 mm, the entrained volume of oil decreased, and the diameter of the mean droplets decreased when the oil viscosity and interfacial tension were increased, as demonstrated in Fig. 10. This suggests that a more intense force of shear stress at the interface is required if more slag is entrained into the steel phase, or droplets of smaller diameter are expected to form if the slag viscosity or interfacial tension is increased. To clearly understand the percentage significance of the physical properties on entrainment in the studied parameter range, the experimental scheme needs to be further optimized.
4. Conclusions
This study aimed to evaluate the effects of the gas flow rate, slag viscosity, interfacial tension, and slag layer thickness on the entrained volume, droplet diameter, interfacial area, and specific interface area. Based on these findings, the following conclusions can be drawn:
(1) The bottom-blowing process leads to the formation of oil droplets. The spherical bed consisted of entrained droplets that floated up to the traditional liquid-liquid interface for buoyancy and interfacial tension. Remarkably, water droplets were observed in the water phase. Water droplets wrapped in oil films appeared at relatively high flow rates and provided almost twice the interfacial area compared with oil droplets of the same size. The number of oil droplets in the water phase was much greater than the number of water droplets.
(2) When the gas flow rate or oil thickness increases, the volume of entrained oil and the number of oil droplets also increase. However, these values decrease with increasing oil viscosity and interfacial tension.
(3) As the oil-layer thickness increased, the mean diameter of entrained droplets decreased. The increase in the gas flow rate increased the mean diameter when the gas flow rate was relatively small, and further increases in the gas flow rates depicted a decreasing tendency. At an oil layer thickness of 25 mm, the mean oil droplet diameter increased by 22% when the gas flow rate increased from 2 to 4 L/min. Conversely, the mean diameter decreased by 11% and 33% when the gas flow rate increased from 2 to 6 and 8 L/min, respectively.
(4) The specific surface area of oil droplets demonstrated an opposite trend to that of the mean diameter. At the same oil layer thickness, the specific interface area increased by 25% when the gas flow rate increased from 2 to 3 L/min. Moreover, the specific interface area increased by 51% and 101% when the gas flow rate increased from 3 to 6 and 8 L/min, respectively. In addition, the specific surface area decreased as the oil-layer thickness increased.
(5) For the open-eye process, the increase in the gas flow rate or decrease in the oil layer thickness led to the open-eye growing bigger in size. Specifically, the eye-opening increased by 21% when the gas flow rate increased from 1 to 5 L/min, while the slag layer thickness was 15 mm. Furthermore, when the oil layer thickness increased by 67%, the eye-opening decreased by 56% to that of the 15 mm oil layer.
Acknowledgements
The present work was funded by China Funding Agency National for National Natural Science (62071034) and JISCO Iron & Steel Co., Ltd. We would also like to express our gratitude to Mr. Hu Zheng and Mr. Li Shi Wang for their help during the experimental part of the study.
References
- 1) M. A. Andersson, L. T. Jonsson and P. G. Jönsson: ISIJ Int., 40 (2000), 1080. https://doi.org/10.2355/isijinternational.40.1080
- 2) P. G. Jönsson and L. T. Jonsson: ISIJ Int., 41 (2001), 1289. https://doi.org/10.2355/isijinternational.41.1289
- 3) M. Andersson, M. Hallberg, L. Jonsson and P. Jönsson: Ironmaking Steelmaking, 29 (2002), 224. https://doi.org/10.1179/030192302225004106
- 4) A. M. B. Silva, M. A. Oliveira, J. J. M. Peixoto and C. A. da Silva: Metall. Mater. Trans. B, 52 (2021), 2111. https://doi.org/10.1007/s11663-021-02161-2
- 5) A. Ghosh: Secondary Steelmaking, Principles and Applications, CRC Press, Boca Ration, FL, (2000), 200.
- 6) W. Lou and M. Zhu: Metall. Mater. Trans. B, 45 (2014), 1706. https://doi.org/10.1007/s11663-014-0105-0
- 7) W. Lou and M. Zhu: ISIJ Int., 55 (2015), 961. https://doi.org/10.2355/isijinternational.55.961
- 8) J. Mietz and M. Brühl: Steel Res., 61 (1990), 105. https://doi.org/10.1002/srin.199000311
- 9) J. Mietz, S. Schneider and F. Oeters: Steel Res., 62 (1991), 1. https://doi.org/10.1002/srin.199101719
- 10) Q. Cao, L. Nastac, A. Pitts-Baggett and Q. Yu: Metall. Mater. Trans. B, 49 (2018), 988. https://doi.org/10.1007/s11663-018-1234-7
- 11) W. Philbrook and L. Kirkbride: JOM, 8 (1956), 351. https://doi.org/10.1007/bf03377696
- 12) M. Iguchi, Y. Sumida, R. Okada and Z. Morita: ISIJ Int., 34 (1994), 164. https://doi.org/10.2355/isijinternational.34.164
- 13) M. Iguchi, J. Yoshida, T. Shimizu and Y. Mizuno: ISIJ Int., 40 (2000), 685. https://doi.org/10.2355/isijinternational.40.685
- 14) P. G. Jönsson, L. Jonsson and D. Sichen: ISIJ Int., 37 (1997), 484. https://doi.org/10.2355/isijinternational.37.484
- 15) P. Dayal, K. Beskow, J. Björkvall and D. Sichen: Ironmaking Steelmaking, 33 (2006), 454. https://doi.org/10.1179/174328106X149842
- 16) Y. Kang, L. Yu and D. Sichen: Ironmaking Steelmaking, 34 (2007), 253. https://doi.org/10.1179/174328107X168101
- 17) J. Savolainen, T. Fabritius and O. Mattila: ISIJ Int., 49 (2009), 29. https://doi.org/10.2355/isijinternational.49.29
- 18) P. Sulasalmi, A. Kärnä, T. Fabritius and J. Savolainen: ISIJ Int., 49 (2009), 1661. https://doi.org/10.2355/isijinternational.49.1661
- 19) S. Kitamura, M. Zeze and J. Nakashima: Jpn. J. Multiph. Flow, 30 (2016), 266. https://doi.org/10.3811/jjmf.30.266
- 20) V.-V. Visuri, M. Järvinen, J. Savolainen, P. Sulasalmi, E.-P. Heikkinen and T. Fabritius: ISIJ Int., 53 (2013), 613. https://doi.org/10.2355/isijinternational.53.613
- 21) L. Li and B. Li: JOM, 68 (2016), 2160. https://doi.org/10.1007/s11837-016-1849-6
- 22) A. Huang, H. Harmuth, M. Doletschek, S. Vollmann and X. Feng: Steel Res. Int., 86 (2015), 1447. https://doi.org/10.1002/srin.201400373
- 23) W. Chen, L. Zhang, Q. Ren, Y. Ren and W. Yang: Metall. Mater. Trans. B, 53 (2022), 1446. https://doi.org/10.1007/s11663-022-02453-1
- 24) W. Chen, L. Zhang, Y. Wang, S. Ji, Y. Ren and W. Yang: Powder Technol., 390 (2021), 539. https://doi.org/10.1016/j.powtec.2021.05.101
- 25) P. Sulasalmi, V. V. Visuri and T. Fabritius: Mater. Sci. Forum, 762 (2013), 242. https://doi.org/10.4028/www.scientific.net/MSF.762.242
- 26) P. Sulasalmi, V. V. Visuri, A. Kärnä and T. Fabritius: Steel Res. Int., 86 (2015), 212. https://doi.org/10.1002/srin.201400026
- 27) A. Senguttuvan and G. A. Irons: ISIJ Int., 57 (2017), 1962. https://doi.org/10.2355/isijinternational.ISIJINT-2016-589
- 28) U. Singh, R. Anapagaddi, S. Mangal, K. A. Padmanabhan and A. K. Singh: Metall. Mater. Trans. B, 47 (2016), 1804. https://doi.org/10.1007/s11663-016-0620-2
- 29) D. Mazumdar: Metall. Mater. Trans. B, 21 (1990), 925. https://doi.org/10.1007/BF02657818
- 30) E. K. Ramasetti, V. V. Visuri, P. Sulasalmi, R. Mattila and T. Fabritius: Steel Res. Int., 90 (2019), 1800365. https://doi.org/10.1002/srin.201800365
- 31) E. K. Ramasetti, V. V. Visuri, P. Sulasalmi, T. Palovaara, A. K. Gupta and T. Fabritius: Steel Res. Int., 90 (2019), 1900088. https://doi.org/10.1002/srin.201900088
- 32) A. N. Conejo and W. Feng: Metall. Mater. Trans. B, 53 (2022), 999. https://doi.org/10.1007/s11663-021-02355-8
- 33) Q. Cao and L. Nastac: Ironmaking Steelmaking, 47 (2019), 873. https://doi.org/10.1080/03019233.2019.1629155
- 34) A. M. Amaro-Villeda, M. A. Ramirez-Argaez and A. N. Conejo: ISIJ Int., 54 (2014), 1. https://doi.org/10.2355/isijinternational.54.1
- 35) K. Yonezawa and K. Schwerdtfeger: Metall. Mater. Trans. B, 30 (1999), 411. https://doi.org/10.1007/s11663-999-0073-y
- 36) A. Maruyama and M. Iguchi: J. Jpn. Soc. Exp. Mech., 12 (2012), s7. https://doi.org/10.11395/jjsem.12.s7
- 37) M. G. Frohberg, F. Gerlach and G. Handschuh: Steel Res., 61 (1990), 151. https://doi.org/10.1002/srin.199000322
- 38) T. Wei and F. Oeters: Steel Res. Int., 63 (1992), 60. https://doi.org/10.1002/srin.199200471