Abstract
Recrystallization and grain growth during plate rolling are prevented by Nb addition both with the solute drag and the Nb carbide precipitation. Although a fine microstructure is achieved in the base material, welding heat completely changes the microstructure in the heat affected zone (HAZ). In this study, laboratory simulation of the coarse grain HAZ (CGHAZ) thermal cycle of double submerged arc welded linepipe was carried out using low carbon steels containing different Nb contents. Extraction residue analysis of the simulated CGHAZ samples revealed that almost all the Nb remained in solid solution. To clarify the interaction of Nb carbide dissolution and grain growth on overall simulated HAZ microstructure evolution, additional weld HAZ thermal simulations were performed. It was found that Nb carbides remain undissolved at HAZ peak temperatures up to 1200°C and showed significant pinning effect to prevent austenite grain growth. Significant grain growth was seen after continuous fast heating to 1350°C peak temperature, while the higher Nb added steel showed a slower overall austenite grain growth rate, suggesting that grain growth in the HAZ at higher temperature was suppressed by the combined effects of slower coarse Nb carbide dissolution providing some pinning, and the solute drag effect of higher amounts of Nb in solid solution. A pronounced retardation of longer-term isothermal grain growth was identified at 1350°C at higher levels of solute Nb, confirming the influence of Nb solute drag on high temperature resistance to austenite grain coarsening.
1. Introduction
Demand for natural gas, which emits smaller amount of CO2 than oil and coal, is expected to continue to rise as global economic growth increases energy demand.1) As pipelines for transporting natural gas are increasingly laid in harsh environments far from the demand areas,2) high strength steel with excellent low temperature toughness is required. The combination of Nb microalloying and thermo-mechanical controlled processing (TMCP), which is often represented by controlled rolling followed by direct quenching or accelerated cooling, has been shown to be effective for improving both strength and toughness.3,4)
Nb is particularly effective in the slab reheating and hot rolling stages of plate production. In the slab reheating process before rolling, coarsening of austenite grains is suppressed by the pinning effect of Nb carbides5) in the as-cast microstructure. The theory for retardation of grain growth due to the dispersion of second phase particles was established by Zener,6) and grain growth models optimized to steels for practical use have been proposed.7,8) In the rolling process, solute Nb suppresses grain growth by retarding interface migration, which is known as the solute drag effect,9,10,11) and it has been well understood that solute Nb significantly slows recrystallization.12) Segregation of solute Nb around the grain boundary of recrystallizing ferrite was clearly observed by a three-dimensional atom probe (3D-AP).13) On the other hand, fine Nb carbides are precipitated in the dislocation structure resulting from accumulated rolling strain, and sub-grain boundary movement is suppressed by the pinning effect of these precipitates, causing a retardation of recrystallization.12) This net retardation of recrystallization through the addition of Nb increases the effective accumulated rolling strain, and accordingly the transformation during cooling is enhanced from a higher density of ferrite nucleation sites,3) resulting in a fine transformed microstructure.
Large diameter linepipe is usually produced by cold forming of steel plate to a round shape and welding the plate edges. Therefore, it is important to ensure the low temperature toughness of the weld and heat affected zone (HAZ) in addition to the base material because the initial microstructure of the plate is significantly changed by the weld heat input. Generally, the HAZ closest to the weld metal, which is called the coarse grain heat affected zone (CGHAZ), is exposed to a temperature of 1400°C or more and can exhibit significant austenite grain growth of during welding, and toughness can deteriorate to a significant degree.14,15) In addition, the HAZ microstructure of linepipe steels usually exhibits upper bainite and martensite-austenite constituent (M-A),16) which tend to deteriorate toughness.17,18) There are several approaches for suppressing the deterioration of HAZ toughness. Austenite grain growth during weld heating at very high temperatures can be reduced by TiN precipitates, and an appropriate ratio of Ti and N19,20,21) can be included in the alloy design to facilitate this. Ferrite formation during cooling after welding can enhanced by dispersed fine non-metallic particles resulting in idiomorphic ferrite nucleation and a fine HAZ microstructure.21) M-A phase content in the HAZ can be reduced by lowering Si and Mo contents.22,23) It has been reported that Nb promotes the formation of M-A by lowering the bainite transformation temperature.22,24) However, this effect is strongly affected by C content and weld heat input. In the case of linepipe steel with relatively low C content, it has been reported that Nb addition does not negatively affect or even improve HAZ toughness.25,26) For example, Barbaro et al. evaluated the simulated CGHAZ using 0.058% and 0.11% Nb added steels and reported that the prior austenite grain size was finer and the toughness was better in the higher Nb steel.26) Yang et al. reported that grain growth suppressed in CGHAZ even under extremely high heat input condition.27) Garcia et al. clarified the segregation behavior of solute Nb around grain boundary of simulated HAZ by 3D-AP, Nb precipitates remained at above the NbC solution temperature because of very short holding time in the heat cycle simulation.28) However, the mechanism of Nb effect on HAZ toughness of linepipe steels and the rule of Nb on the grain growth behavior in HAZ have not been fully clarified. Therefore, the purpose of this study was to clarify the role of Nb on HAZ toughness and the evolution of HAZ microstructure. First, steel plates with different Nb contents were subjected to weld thermal simulation tests, after which microstructure and toughness was determined. In order to clarify the presence of Nb in the HAZ, solute or precipitate, quantitative analysis was carried out by the electrolytic extraction method. Then, grain growth tests were conducted at various temperatures and holding times to investigate grain coarsening behavior and the effect of Nb by comparing observed coarsening rates to classical grain growth theory.
2. Experimental Procedures
2.1. Material Preparation
Table 1 shows chemical compositions of the steels with different Nb contents investigated in the present study. To eliminate the effect of M-A on HAZ toughness as much as possible while keeping the same strength level, the addition of alloying elements in each steel was carefully adjusted while maintaining the same Pcm value. Pcm is a commonly used parameter for representing weldability,29) but Pcm value also has a correlation with HAZ toughness since the formation of hard phases such as M-A is enhanced in steels with higher Pcm value.30) The target Ti/N ratio was held the same for both the 0.030% Nb and 0.055% Nb steels. Figure 1 schematically shows the TMCP conditions employed during hot rolling. Slabs with a thickness of 160 mm was heated at the temperature close to the Nb carbide solution temperature (Tsol.) given by the solubility products as given by Eq. (1),31) held for 1 hour, and then hot-rolled to a thickness of 23 mm. In order to suppress the formation of ferrite, cooling was started at the temperature above the Ar3 temperature given by Eq. (2).32)
|
log
10
[
Nb
][
C+12/14N
]=2.26-6 770/T(
K
)
| (1) |
|
Ar3=910-273[ C ]-74[
Mn
]-56[
Ni
]-16[
Cr
]
-9[
Mo
]-5[
Cu
] (
°C
)
| (2) |
Table 1. Chemical compositions of the materials employed (mass%).
| Steel | C | Si | Mn | Nb | Ti | N | Others | Ceq | Pcm |
|---|
| 0.030% Nb | 0.04 | 0.28 | 1.34 | 0.030 | 0.01 | 0.004 | Cr, Mo | 0.35 | 0.14 |
| 0.055% Nb | 0.04 | 0.15 | 1.26 | 0.055 | 0.01 | 0.004 | Cu, Ni, Cr | 0.33 | 0.14 |
Ceq=C+Mn/6+(Cu+Ni)/15+(Cr+Mo+V)/5
Pcm=C+Si/30+(Mn+Cu+Cr)/20+Mo/15+Ni/60+V/10+5B
Samples for microstructure observation were taken from the plate in the rolling direction, mirror-polished, etched with 3% Nital aqueous solution, and then the microstructure was observed using optical microscopy (OM). In addition, electron backscatter diffraction (EBSD) patterns were measured in a scanning electron microscope (SEM). The measured area was 1 mm × 1 mm. The SEM accelerated voltage was 17 kV and the EBSD step size was 0.8 μm. The measured EBSD data was analyzed using the OIM-Analysis system.
2 mm Charpy V-notch impact specimens were taken from the mid-thickness region of the plates in the transverse direction, and Charpy impact tests were carried out at various temperatures to evaluate the ductile-to-brittle transition temperature.
2.2. Weld Thermal Simulation Test
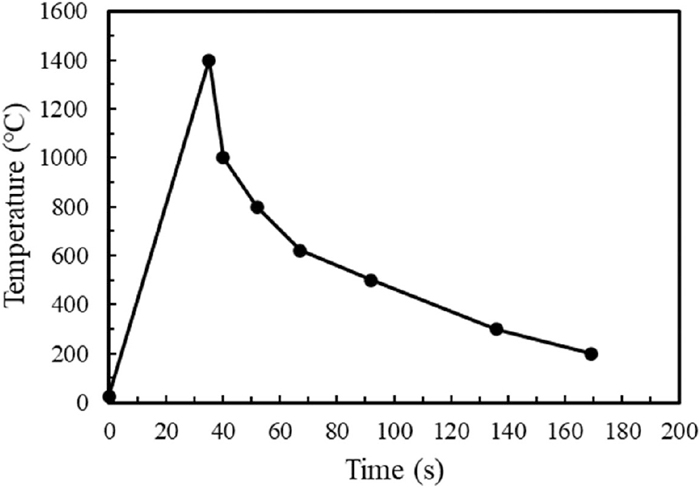
Block samples of 15 mm (t) × 75 mm (W) × 80 mm (L) were taken from the mid-thickness region of the 0.030% Nb and 0.055% Nb plates, and weld thermal simulations were carried out using a thermal-mechanical simulator. Figure 2 shows the temperature history simulating the CGHAZ of the weld with heat input of 50 kJ/cm. The maximum heating temperature was set to 1400°C. The cooling time from 800 to 500°C was 40 seconds.
From the block sample after the weld thermal simulation test, 2 mm Charpy V-notch impact specimens were extracted in the transverse direction to plate rolling, and Charpy impact tests were carried out at various temperatures. Specimens were taken for hardness measurement, and the cross-sectional hardness was measured 5 times by the Vickers hardness tester with a load of 10 kgf.
Samples for microstructure observation were taken and OM observations and EBSD measurements were performed. In order to clearly analyze the M-A formation in the simulated heat samples, a two-stage etching technique using Nital etching followed by electrochemical etching was performed, followed by SEM observation, and the M-A fraction was measured.
2.3. Quantitative Analysis of the State of Nb
Delineating the distribution of Nb between solid solution and precipitates, both before and after welding is quite important to clarify role of Nb on microstructure evolution in the HAZ. Therefore, electrolytic extraction analysis was carried out on 0.030% Nb and 0.055% Nb steels before and after HAZ thermal simulation. First, constant current electrolysis using a 10 vol% acetylacetone-1 mass% tetramethylammonium chloridemethanol solution (10% AA electrolyte) was carried out. A small amount of electrolyte in which Nb is dissolved was collected after the electrolysis, and solute Nb content was identified by inductively coupled plasma (ICP)-mass spectrometry (MS) analysis.
The precipitates extracted by the electrolysis procedure were stably dispersed in a dispersible solvent.33) Then, precipitates were collected by filtration, firstly by an alumina filter with 100 nm pore size, and then by a 20 nm pore size filter. Finally, the solution including precipitates which passed the two filters was dried and the residue collected. These three sizes fractions of precipitates were then individually dissolved in a mixture of nitric acid, perchloric acid and sulfuric acid together with the filter, and then ICP-atomic emission spectroscopy (AES) analysis was performed to analyze the Nb content in the three different sizes of precipitates, exceeding 100 nm, 20 nm to 100 nm, and less than 20 nm.
2.4. Carbide Dissolution and Grain Growth
To clarify the carbide dissolution and grain growth behavior during welding, two types of thermal simulation tests were conducted. Welding heat treatment simulations were performed in a Bähr DIL805A dilatometer, using induction heating and varying the peak temperature and holding time at peak temperature. For this, dilatometry specimens were machined from the hot rolled plates. For 1300 and 1400°C reheating temperatures, solid cylinder dilatometry specimens (4 mm diameter and 10 mm long) were used. For 1200, 1100 and 1000°C reheating temperatures, hollow cylinders with an inside diameter of 3.6 mm were employed, in order to enhance the cooling rate and improve quenchability. Figure 3 shows the thermal cycles for heating simulation. In the carbide dissolution tests, samples were first heated at a rate of 50°C/s to peak temperatures between 1000 to 1400°C, then quenched at the maximum achievable rate in helium gas. In the grain growth test, the sample was heated from room temperature to a target temperature of 1000°C to 1350°C, then held for 0 to 400 seconds, and then helium gas quenched at the maximum cooling rate. After both cycles, rapid gas quenching was employed in order to obtain a fully martensitic microstructure and to be able to quantify the prior austenite grain sizes.

Picric acid etching was used to reveal the prior austenite grain boundaries in the quenched samples. The etched samples were characterized via OM, and prior austenite grain size measurements were performed in terms of the mean equivalent diameter. For that purpose, Leica QWin 2.3 image analysis software was used. For the lowest heating temperature of 1000°C, depending on the condition, between 100 and 500 prior austenite grains were measured. For the high heating temperature of 1350°C, between 50 and 250 grains were quantified.
3. Results and Discussion
3.1. Toughness and Microstructure of Base Material
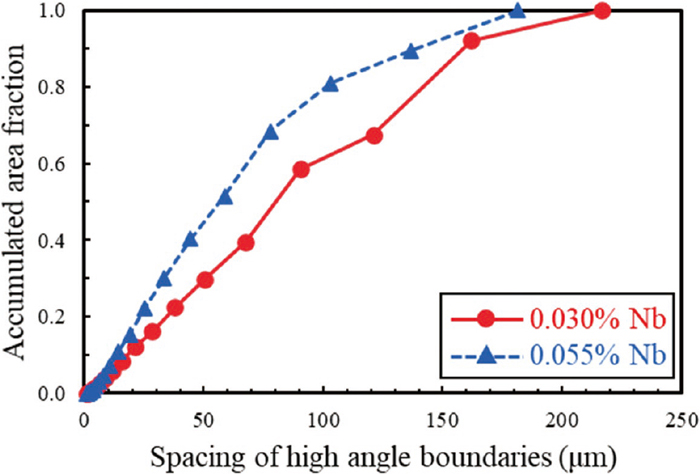
A misorientation angle map was utilized in this study to evaluate the grain size distribution in 0.030% Nb and 0.055% Nb. Figure 4 shows the OM images and misorientation angle maps of the base materials. A misorientation threshold of 15° or more between adjacent pixels was using to delineate grains crystallographically. Both had microstructures composed mostly of upper bainite, and some coarse grains were observed. Figure 5 shows the spacing of high angle boundaries distribution measured using Figs. 4(b) 4(e). It has been reported that the effective grain size in bainitic steels is correlated with the misorientation threshold 15° or more.34,35,36) In this analysis, the 0.055% Nb had slightly coarser grains. The mean grain size (Dmean) and the grain size at the 20% percentile of the grain size distribution from the largest grain size (Dc20%) at the misorientation threshold 15° or more was evaluated and shown in Table 2. Both Dmean and Dc20% were slightly coarser for the 0.055% Nb compared with 0.030% Nb. In this study, the heating temperature before rolling at 0.055% Nb was 70°C higher than that at 0.030% Nb, and it was held at that temperature for 1 hour, which may have resulted in coarse initial grain size before rolling. This may have resulted in a slightly rougher final grain size for 0.055% Nb.

Table 2. Mean grain size (D
mean) and the grain size at the 20% percentile from the largest grain size (D
c20%) at the misorientation threshold 15° or more in base material.
| Steel | Dmean (μm) | Dc20% (μm) |
|---|
| 0.030% Nb | 16.5 | 22.8 |
| 0.055% Nb | 22.5 | 36.6 |
Figure 6 shows the temperature dependence of the absorbed energy and brittle fracture fraction of base material obtained by Charpy impact test. The ductile-to-brittle transition temperature (DBTT) of 0.030% Nb and 0.055% Nb was determined to be −137°C and −133°C, respectively. 0.030% Nb showed slightly better toughness with lower transition temperature than 0.055% Nb, which corresponds to the slightly finer grain size. Upper shelf energy of 0.030% Nb is also slightly higher than 0.050% Nb. As explained the later chapter, higher amount of NbC precipitates in 0.055% Nb could reduce the shelf energy by enhancing void nucleation.
3.2. Toughness and Microstructure of Simulated CGHAZ
Figure 7 shows the temperature dependence of the absorbed energy and brittle fracture fraction of samples from the simulated CGHAZ. Compared to the base metal toughness, the DBTT of the simulated CGHAZ was significantly increased, and the DBTT of 0.030% Nb was −14°C and that of 0.055% Nb was −43°C. The mean hardness of 0.030% Nb was 191 HV and that of 0.055% Nb was 185 HV. Hardness of 0.030% Nb is slightly higher than 0.055% Nb since 0.030% Nb has slightly richer chemistry with higher Ceq. It is interesting that while the base metal toughness was almost the same for both steels, the simulation HAZ toughness for 0.055% Nb was far better than 0.030% Nb. On the other hand, 0.055% Nb showed smaller upper shelf energy than 0.030% Nb while there is almost no NbC precipitate in both steels. Smaller grain in 0.055% Nb which means larger grain boundary area could reduce the shelf energy by enhancing void nucleation.

Figure 8 shows the OM images, IPF maps and SEM images of the simulated CGHAZ. From the OM and IPF images, 0.055% Nb samples exhibited smaller grain size than the 0.030% Nb samples. Figure 9 shows the grain size distribution measured from EBSD images in Figs. 8(b) and 8(e). The grain size of the simulated CGHAZ was significantly coarsened compared to that of the base material. Particularly in the 0.030% Nb samples, the number of large grain over 100 μm was much higher. Table 3 shows Dmean and Dc20% in the simulated CGHAZ. Both Dmean and Dc20% were smaller for 0.055% Nb compared with 0.030% Nb. Thus, 0.055% Nb had a finer and more homogeneous microstructure, even though the grain size before weld thermal simulation was slightly coarser. From the SEM images in Figs. 8(c) and 8(f), only a small amount of M-A phases were seen in both steels. The M-A fractions were 2.0% for 0.030% Nb and 0.9% for 0.055% Nb. While the Pcm values were set as the same for both steels, combinations of alloying elements could affect the M-A formation. An empirical model to correlate toughness and microstructural characteristics of low alloyed TMCP steel was proposed by Isasti et al.,37) indicating that not only mean grain size but also homogeneity of grain size distribution affects toughness to a significant degree. It was also suggested that the effect of M-A fraction is smaller than that of mean grain size and grain size homogeneity. Therefore, it is considered that the small amount of M-A observed in both steels gave only a minimal effect, but the HAZ toughness was strongly affected by the finer and more homogeneous microstructure and the degradation of toughness was suppressed for 0.055% Nb compared with 0.030% Nb.

Table 3. Mean grain size (D
mean) and the grain size at the 20% percentile from the largest grain size (D
c20%) at the misorientation threshold 15° or more in simulated CGHAZ.
| Steel | Dmean (μm) | Dc20% (μm) |
|---|
| 0.030% Nb | 100.3 | 141.8 |
| 0.055% Nb | 74.5 | 101.3 |
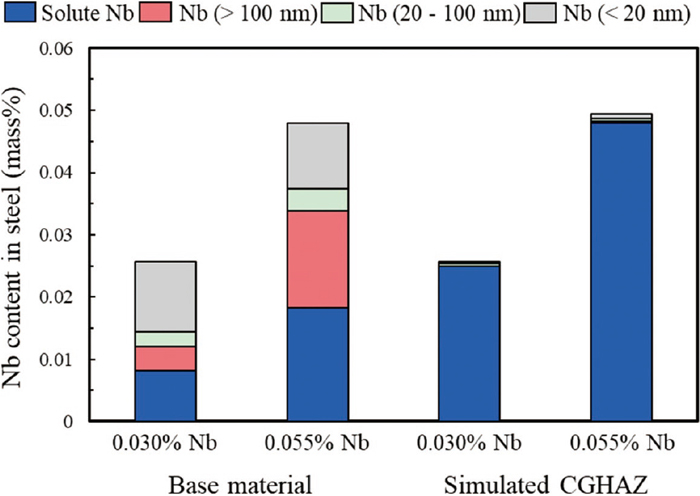
Figure 10 shows the results of quantitative analysis of the distribution of Nb in the plate before and after the HAZ thermal cycles. The total Nb content considered in these mass balances was smaller than the actual Nb addition since some undetected Nb is present both in solid solution and in precipitates and lost during the dissolution analysis. In the base material before the heating, the majority of Nb was present as precipitates for both steels, while 0.055% Nb contained higher amount of Nb precipitates with sizes above 100 nm. Coarse Nb precipitates above 100 nm are considered to have remained undissolved during slab heating, while fine Nb precipitates below 100 nm are precipitated during rolling and cooling after rolling. Although Nb precipitates existed in various sizes before the weld thermal simulation test, almost all the Nb precipitates were dissolved by the weld heat and entered solid solution in austenite, despite the very short heating and holding time at high temperature. From the above results, it is concluded that almost all the Nb precipitates dissolved during rapid heating to 1400°C, and their pinning capacity was lost. However, the austenite grain growth was significantly reduced in 0.055% Nb compared to 0.030% Nb. An initial conclusion from this observation might be that higher levels of solute Nb in the 0.0055% Nb steel could prevent grain growth by the solute drag effect. However, grain boundary pinning can be exerted until the complete dissolution of the Nb precipitates, and the 0.055% Nb base microstructure contained a larger fraction of coarse precipitates which would be slower to dissolve during heating and might pin boundaries to a higher temperature, also increasing resistance to grain growth. Therefore, carbide dissolution behavior and grain growth behavior when holding at higher temperature was also investigated so as to clarify the role of coarse Nb precipitates on the resistance to simulated CGHAZ grain growth.
Carbide dissolution tests were conducted using the thermal cycles as shown in Fig. 3(a). Figure 11 shows the OM images of 0.030% Nb and 0.055% Nb after rapidly heated to 1000°C, 1200°C, 1350°C and 1400°C and immediately quenched. It is obvious that as the maximum heating temperature increased, prior austenite grains became coarser. Figure 12 shows the mean prior austenite grain size after the carbide dissolution test. The Nb carbide solution temperature for both steels obtained by Eq. (1) are indicated in the figure. Grain growth was very slight at the heating temperatures up to 1200°C, which is higher than the predicted Nb carbide dissolution temperature. This means that Nb carbide was intact to exert the pinning effect under the rapid heating. But grain growth started at the temperature over 1200°C most likely by the progressive dissolution of Nb carbides. At the highest heating temperature of 1400°C, the mean prior austenite grain size of 0.055% Nb was finer than that of 0.030% Nb, which is the same trend as was observed in the simulated HAZ. The initially coarser 0.055% Nb base metal clearly coarsens more slowly on continuous heating above 1200°C than the 0.030% Nb.


In order to clarify the grain growth behavior at higher temperature, the heat cycle test as shown in Fig. 3(b) was conducted, which uses the same heating as the dissolution test, followed by an isothermal hold at the peak temperature for up to 400 seconds, and finally gas quenching. Figure 13 shows the mean prior austenite grain size after the grain growth test. In the holding at 1000°C and 1200°C, the prior austenite grain sizes of 0.030% Nb and 0.055% Nb were similar at the same holding time. As shown in Fig. 12, Nb carbides remain at 1200°C and lower temperature and showed pinning effect to prevent grain growth. The estimated number density of Nb carbides smaller than 100 nm, which should be effective for the pinning, is almost the same for both 0.030% Nb and 0.055% Nb. Therefore, it is considered that grain growth was suppressed with the same manner in both steels. On the other hand, significant grain growth was seen at the holding temperature of 1350°C, as shown in Fig. 13(c). The prior austenite grain sizes of 0.030% Nb and 0.055% Nb were broadly comparable to each other at the same holding time up to 40 seconds, but 0.030% Nb exhibited significant grain growth after 40 seconds, which might be governed by different mechanism. On the other hand, further isothermal grain growth was suppressed in 0.055% Nb.

To quantify the grain coarsening behavior and the role of Nb, the experimental data was fitted to classical mean-field grain growth theory with an overall growth rate governed by the following equation.38)
|
(
R
¯
)
n
-
(
R
¯
0
)
n
=
K
n
⋅t
| (3) |
where
R
¯
is the mean radius of the grain,
R
¯
0
is the value of
R
¯
when the grain growth starts to progress steadily,
K is the grain growth rate coefficient, t is the heating time. The value of exponent
n depends on the grain growth mechanism and
n=2, 3 or 4 for grain boundary migration, volume diffusion, or grain boundary diffusion, respectively.
39) So, the solute drag is classified as
n=2 and the pinning effects is
n=3. However, a recent study found that grain growth in a particle dispersed structure follows a square law, which implies
n=2.
40) Therefore,
n=2 was applied for the grain growth analysis in this study. Initial grain size before heating was set as
R
¯
0
=0 following Nishizawa.
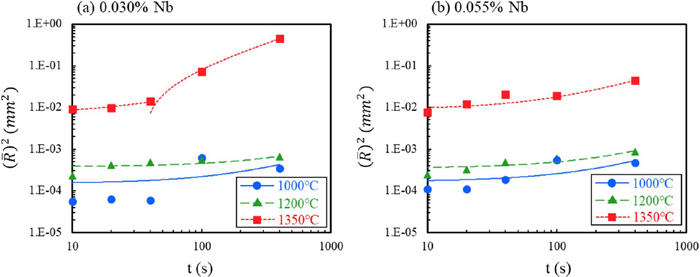
39) Figure 14 shows the results of organizing the grain growth test data according to the square law. The lines in the figure are linear approximations. Since 0.030% Nb showed different grain growth behavior at 1350°C until 40 seconds and after 40 seconds, liner approximation curves were divided into two regions. The grain growth rate coefficient,
K2, was determined by the slope of the liner approximation and plotted versus inverse temperature as shown in
Fig. 15. Experimental data from Nishizawa
39) for the grain growth rate coefficient
K2 of single-phase steel with alloying elements having the solute drag effect is shown in
Fig. 15 for comparison.
K2 values for both 0.030% Nb and 0.055% Nb at 1200 and 1000°C are almost the same and lower than that at 1350°C, and also lower than the temperature dependence obtained from the single-phase steel having solute drag effects described by Nishizawa. Since Nb precipitates could remain at the temperature of 1200°C and lower, which was suggested by
Fig. 12, grain growth was possibly suppressed by the precipitate pinning effect.
K2 values were observed to increase at 1350°C for both steels but the 0.055% Nb showed a lower value.
K2 values of 0.030% Nb at 1350°C for the time range of 10 to 40 seconds and 40 to 400 seconds were plotted separately.
K2 values of 0.055% Nb at 1350°C is slightly lower than that of 0.030% Nb at 1350°C until 40 seconds, but both are on the extension of that of the steels with richer alloying elements which shows solute drag effect. On the other hand,
K2 value of 0.030% Nb after 400 seconds was about 10 times higher than that of until 40 seconds and on the line of that of pure Fe which does not contain solute element. This could explain that enriched solute Nb in the grain boundary of 0.030% Nb could be diffused away and lost solute drag effect. It might be difficult to directly compare to the Nishizawa’s data, but it is suggested that 0.055% Nb exhibits strong solute drag effect at higher temperature and effective to suppress grain growth in HAZ microstructure. Although the above investigation in grain growth behavior in HAZ suggested a strong solute drag effect by Nb, delineating the relative contribution of starting grain size, residual precipitates and solute drag at very high temperatures on the net kinetics of austenite grain growth and the final HAZ microstructure is complex and will require further investigation.
4. Conclusions
In order to clarify the effect of Nb on grain growth behavior and toughness of the heat affected zone (HAZ) of linepipe steels, weld thermal simulation tests, quantitative analysis of Nb and grain growth tests were carried out on low carbon bainitic steels with different Nb contents, leading to the following conclusions:
(1) The simulated coarse grain heat affected zone (CGHAZ) with heating up to 1400°C of the 0.055% Nb steel showed a finer grain size and significantly lower ductile-to-brittle transition temperature than the 0.030% Nb.
(2) As a result of investigating the grain growth behavior under rapid heating, it was found that the grain growth started at a temperature above 1200°C, which is higher than the Nb carbide dissolution temperature calculated with the standard Irvine solubility product.
(3) Quantitative analysis of the distribution of Nb in the simulated CGHAZ microstructure showed that most of the Nb existed as solid solution.
(4) The austenite grain growth rate above the calculated dissolution temperature of Nb carbide was slower for the higher Nb content steel, suggesting that the solute drag effect by Nb made a significant contribution to the observed retardation of austenite grain growth in the simulated HAZ.
References
- 1) International Energy Agency: World Energy Outlook 2021, International Energy Agency, Paris, (2021), 180.
- 2) S. Echigoya: Pip. Eng., 53 (2011), 19 (in Japanese).
- 3) I. Kozasu, C. Ouchi, T. Sampei and T. Okita: Proc. Int. Symp. on High-Strength, Low-Alloy Steels, Micro Alloying 75, Union Carbide Corporation, New York, (1977), 120.
- 4) C. Ouchi: ISIJ Int., 41 (2001), 542. https://doi.org/10.2355/isijinternational.41.542
- 5) L. J. Cuddy and J. C. Raley: Metall. Trans. A, 14 (1983), 1989. https://doi.org/10.1007/BF02662366
- 6) C. Zener, quoted by C. S. Smith: Trans. Metall. Soc. AIME, 175 (1948), 15.
- 7) K. Banerjee, M. Militzer, M. Perez and X. Wang: Metall. Mater. Trans. A, 41 (2010), 3161. https://doi.org/10.1007/s11661-010-0376-2
- 8) A. Graux, S. Cazottes, D. de Castro, D. S. Martín, C. Capdevila, J. M. Cabrera, S. Molas, S. Schreiber, D. Mirković, F. Danoix, M. Bugnet, D. Fabrègue and M. Perez: Materialia, 5 (2019), 100233. https://doi.org/10.1016/j.mtla.2019.100233
- 9) K. Lücke and K. Detert: Acta Metall., 5 (1957), 628. https://doi.org/10.1016/0001-6160(57)90109-8
- 10) J. W. Cahn: Acta Metall., 10 (1962), 789. https://doi.org/10.1016/0001-6160(62)90092-5
- 11) M. Hillert and B. Sundman: Acta Metall., 24 (1976), 731. https://doi.org/10.1016/0001-6160(76)90108-5
- 12) S. Yamamoto, C. Ouchi and T. Osuka: Proc. Int. Conf. on the Thermomechanical Processing of Microalloyed Austenite, Metallurgical Society of AIME, Warrendale, PA, (1982), 613.
- 13) N. Maruyama and G. D. Smith: Shinnittetsu Giho, 381 (2004), 31 (in Japanese).
- 14) M. Koso, M. Miura and Y. Ohmori: Met. Technol., 8 (1981), 482. https://doi.org/10.1179/030716981803275875
- 15) B. C. Kim, S. Lee, N. J. Kim and D. Y. Lee: Metall. Trans. A, 22 (1991), 139. https://doi.org/10.1007/BF03350956
- 16) X. Li, X. Ma, S. V. Subramanian, C. Shang and R. D. K. Misra: Mater. Sci. Eng. A, 616 (2014), 141. https://doi.org/10.1016/j.msea.2014.07.100
- 17) Y. Kasamatsu, S. Takashima and T. Hosoya: Tetsu-to-Hagané, 65 (1979), 1222 (in Japanese). https://doi.org/10.2355/tetsutohagane1955.65.8_1222
- 18) H. Ikawa, H. Oshige and T. Tanoue: Trans. Jpn. Weld. Soc., 11 (1980), 87.
- 19) S. Kanazawa, A. Nakashima, K. Okamoto and K. Kanaya: Tetsu-to-Hagané, 61 (1975), 2589 (in Japanese). https://doi.org/10.2355/tetsutohagane1955.61.11_2589
- 20) Y. Kasamatsu, S. Takashima and T. Hosoya: Tetsu-to-Hagané, 65 (1979), 1232 (in Japanese). https://doi.org/10.2355/tetsutohagane1955.65.8_1232
- 21) M. Nakanishi, Y. Komizo and I. Seta: J. Jpn. Weld. Soc., 52 (1983), 117 (in Japanese). https://doi.org/10.2207/qjjws1943.52.117
- 22) N. Ishikawa, S. Endo, M. Doi, H. Fukai and N. Mifune: Proc. 17th Int. Conf. on Offshore Mechanics and Arctic Engineering, ASME, New York, (1998), OMAE 98-2302.
- 23) T. Shinmiya, N. Ishikawa and S. Endo: Proc. Materials Science & Technology 2004, ISS, Warrendale, PA, (2004), 11.
- 24) T. Kizu, R. Sakai, H. Imoto, S. Endo and F. Barbaro: Proc. 13th Int. Pipeline Conf., ASME, New York, (2020), IPC2020-9323.
- 25) J. Wiebe, W. Scheller and C. Stallybrass: Steel Res. Int., 89 (2018), 1700252. https://doi.org/10.1002/srin.201700252
- 26) F. Barbaro, L. Kuzmikova, Z. Zhu and H. Li: Proc. 10th Int. Pipeline Conf., ASME, New York, (2014), IPC2014-33109.
- 27) Y. Yang, X. Jia, Y. Ma, P. Wang, F. Zhu, H. Yang, C. Wang and S. Wang: J. Mater. Res. Technol., 18 (2022), 2399. https://doi.org/10.1016/j.jmrt.2022.03.150
- 28) M. P. Garcia, H. Chen, M. Eizadjou, B. Lim, S. P. Ringer and F. J. Barbaro: Mater. Charact., 179 (2021), 111308. https://doi.org/10.1016/j.matchar.2021.111308
- 29) Y. Ito and K. Bessyo: J. Jpn. Weld. Soc., 37 (1968), 983 (in Japanese). https://doi.org/10.2207/qjjws1943.37.983
- 30) N. Ishikawa, T. Shinmiya, S. Igi and J. Kondo: Proc. 6th Int. Pipeline Conf., ASME, New York, (2006), IPC2006-10245.
- 31) K. J. Irvine, F. B. Pickering and T. Gladman: J. Iron Steel Inst., 205 (1967), 161.
- 32) C. Shiga, T. Hatomura, J. Kudo, A. Kamada, K. Hirose and T. Sekine: Kawasaki Steel Giho, 13 (1981), 106 (in Japanese).
- 33) T. Ishida, K. Yamada and K. Yamauchi: Tetsu-to-Hagané, 107 (2021), 644 (in Japanese). https://doi.org/10.2355/tetsutohagane.TETSU-2020-112
- 34) M. Kim, Y. Oh and J. Hong: Scr. Mater., 43 (2000), 205. https://doi.org/10.1016/S1359-6462(00)00392-4
- 35) N. Sanchez, Ö. Güngör, M. Liebeherr and N. Ilić: Proc. 10th Int. Pipeline Conf., ASME, New York, (2014), IPC2014-33502.
- 36) R. Homma, Y. Shinohara, M. Fujioka and Y. Shintaku: CAMP-ISIJ, 28 (2015), 876 (in Japanese).
- 37) N. Isasti, D. Jorge-Badiola, M. L. Taheri and P. Uranga: Metall. Mater. Trans. A, 45 (2014), 4972. https://doi.org/10.1007/s11661-014-2451-6
- 38) J. E. Burke, R. L. Kenyon, H. Burghoff and J. T. Hobbs: Grain Control in Industrial Metallurgy, ASM, Cleveland, OH, (1949), 1.
- 39) T. Nishizawa: Tetsu-to-Hagané, 70 (1984), 1984 (in Japanese). https://doi.org/10.2355/tetsutohagane1955.70.15_1984
- 40) I. Ohnuma, H. Ohtani, K. Ishida and T. Nishizawa: J. Jpn. Inst. Met., 58 (1994), 1133 (in Japanese). https://doi.org/10.2320/jinstmet1952.58.10_1133