Abstract
The strain distribution and microstructure at the crack nucleation sites in martensitic steel with fine- and coarse-prior austenite grains subjected to tensile deformation were characterized using the digital image correlation method on replica films. Although the tensile properties of the fine- and coarse-prior austenite grain specimens were approximately identical, the total strain was certainly improved in the coarse-prior austenite grain specimen. The crack size increased with the coarsening prior austenite grains, whereas the number of cracks decreased. An inhomogeneous strain was introduced in both the specimens by tensile deformation. The accumulated strain when crack nucleates was approximately the same in both specimens, independent of the prior austenite grain size. In low-strain regions, there were no cracks even though the accumulated strain was comparable to that when crack nucleates in high-strain regions. The strain at the crack nucleation sites was high even before crack nucleation occurred. Cracks primarily nucleated on packet and prior austenite grain boundaries, even in the coarse-prior austenite grain specimen, which confirmed that the prior austenite grain boundary should be a preferential crack nucleation site. It can be concluded that the high local strain and the presence of packet or prior austenite grain boundaries are responsible for crack nucleation in martensitic steel subjected to tensile deformation.
1. Introduction
Martensitic steels have hierarchical structures consisting of prior austenite grain (PAG) boundary, packet, block, and lath.1) Ishimoto et al.2) investigated the relationship between the deformation behavior and martensite structure using a martensitic steel/SUS304 multilayered sheet. They revealed that inhomogeneous deformation in a unit of block occurs in the martensitic steel during tensile testing. The fracture behavior of martensitic steel such as brittle fracture at low temperatures, hydrogen embrittlement, and fatigue fracture, has been widely investigated.3,4,5,6,7,8) However, the fracture behavior in martensitic steels during a simple tensile test has not been thoroughly investigated, and the relationship between inhomogeneous deformation in a martensite structure and fracture is unclear.
Recently, a combination of the replica method and digital image correlation method (replica-DIC) was proposed to investigate deformation and fracture behaviors.9) In this method, replica films are intermittently taken from the specimen surface during deformation. Thus, the initial microstructure in the final fracture region can be observed, which also allows DIC analysis to be performed. The strain distribution around fatigue cracks was successfully visualized using this method.10,11) Koga et al.12) visualized the strain distributions during tensile deformation within the final fracture (necking) region in martensitic steel using replica-DIC analysis. The results revealed that an inhomogeneous strain was introduced by tensile deformation, and a high strain tended to be distributed around the PAG boundaries. Furthermore, cracks nucleated in the highly strained regions. This suggests that an inhomogeneous strain distribution is related to crack nucleation. However, a quantitative analysis of this relationship has not been conducted, and the relationship between crack nucleation sites and the martensite structure has not yet been investigated.
In this study, the strain distribution and microstructure at crack nucleation sites in martensitic steel subjected to tensile deformation were characterized using replica-DIC analysis.
2. Experimental Procedure
A low-carbon steel (Fe-0.2%C-1.0%Mn, in mass%) was used in this study. The specimens were solution-treated at 1133 K and 1273 K for 0.6 ks, then quenched in salt water with ice. The specimens had a full martensite structure. PAG boundaries were observed in the specimens heat-treated at 773 K for 4.3 ks to segregate the impurity elements to PAG boundaries and then etched by an AGS etching solution consisting of a saturated picric acid solution and a surfactant. The area of each PAG was measured using OpenCV software. PAG sizes were calculated from the measured areas, assuming that the shape of PAG is a cube. The specimen solution-treated at 1133 and 1273 K had PAG size of 8 ± 3 and 19 ± 7 μm, respectively. Hereafter, these specimens are referred to as fine- and coarse-PAG specimens.
The microstructure was observed by field-emission scanning electron microscopy (SEM). The crystallographic orientation was analyzed by electron backscattered diffraction (EBSD) method. The PAGs were reconstructed from the crystallographic orientations of martensite using EBSD software (Aztec Crystal, OXFORD INSTRUMENTS). The specimens for microstructure observation were mechanically polished using SiC paper and finished by polishing with a colloidal silica suspension.
Tensile tests were conducted using sheet-type specimens with 5 mm gauge length, 1.5 mm width, and 0.4 mm thickness. The initial strain rate was 1.0×10⁻³ s−1.
An acetyl cellulose-replicating film (Bioden R.F.A.) was taken from the etched surface by 3% nital during tensile deformation. The detailed method for obtaining a replica film has been explained in a previous study.11) When the cross head was stopped, the applied stress continuously decreased owing to stress relaxation. Hence, the replica film was taken 1.8 ks after stopping the cross head, when the stress relaxation plateaued. Platinum and palladium were vapor-deposited on the replica film, and the microstructure was observed using SEM with an accelerating voltage of 2 kV to avoid damage to the replica film.
DIC analysis was performed on the SEM images of the replica films before and after deformation using VIC-2D software with a subset of 61 pixels and a step of 3 pixels. The SEM taken from the previous strain condition was adopted as the reference image for the subsequent DIC analysis. For example, the SEM image of the specimen at 0.05 strain was analyzed using the previous SEM image at 0.03 strain as the reference. Assuming a plane strain state, the von Mises strain (εMises) was calculated with Eq. (1) using the DIC-measured values for the major principal strain (ε1) and minor principal strain (ε2).
|
ε
Mises
=
2
3
ε
1
2
-
ε
1
ε
2
+
ε
2
2
.
| (1) |
3. Results and Discussion
Figure 1 shows the nominal stress - nominal strain (SS) curves during monotonic and interrupted tensile tests in the (a) fine- and (b) coarse-PAG specimens. The interrupted test allowed the collection of replica films (red circles) at multiple strain conditions. The uniform strain as well as yield and tensile stresses were approximately identical for the fine- and coarse-PAG specimens, but the total strain in the coarse-PAG specimen was higher than that in the fine-PAG specimen. During interrupted tensile testing, the nominal stress dropped at each interruption (red circles), and a clear increase in the yield stress was detected when testing resumed. This is most likely due to strain aging; the interruption time to obtain the replica films was over 1.8 ks for taking the replica films, which is sufficient time for carbon diffusion. Although strain aging likely occurred, the SS curves for the monotonic and interrupted tensile tests were almost identical. Furthermore, the strain distributions, as will be shown later (Fig. 3), are similar to those reported in a previous study, where strain aging scarcely occurred.12) Therefore, the effect of strain aging on the deformation and fracture behaviors can be considered negligible. The interrupted tensile test was concluded immediately before the fracture (Fig. 1). Crack observations and strain distribution analyses were performed on the interrupted tensile test specimens and replica films.

Fig. 1. Nominal stress – nominal strain curves in the monotonic and interrupted tensile tests in (a) fine- and (b) coarse-prior austenite grain (PAG) specimens. (Online version in color.)

Fig. 3. εMises strain distribution analyzed from the (a), (b) low-magnification and (c), (d) high-magnification SEM images in the identical regions in the specimens just before fracture, and (e), (f) the cumulative average εMises within the high- or low-strain region as indicated by arrows in (c) as a function of average εMises within the necking region measured from (a) and (b) in (a), (c), (e) fine- and (b), (d), (f) coarse-prior austenite grain (PAG) specimens. (Online version in color.)
Figure 2 shows the SEM images of (a), (b) the whole necking region and (c), (d) representative cracks within the necking region in the (a), (c) fine- and (b), (d) coarse-PAG specimens. Both specimens exhibit clear necking deformation, and widths of the specimen at the necking region are approximately identical, as indicated by the black arrows in Figs. 2(a) and 2(b). Thus, the true strains within the necking regions are approximately identical between the specimens. Cracks are detected within the necking region, as indicated by the arrows in Figs. 2(c) and 2(d). Figure 2(e) shows a histogram of the crack sizes observed within the region indicated by the white dotted lines in Figs. 2(a) and 2(b). The number of cracks in the coarse-PAG specimens is slightly lower than that in the fine-PAG specimen. Consequently, the number density of cracks in the coarse-PAG specimen (18.6 mm−2) is lower than that in the fine-PAG specimen (23.2 mm−2). The crack sizes differ significantly between the specimens; the average crack size in the coarse-PAG specimen is three times larger than that in the fine-PAG specimen. The crack sizes are smaller than the PAG sizes for both specimens. Since the true strain within the necking region is approximately identical between the specimens, it can be concluded that the PAG size affects the number density and size of the cracks. The observation of replica films revealed that cracks tended to be arrested at the block, packet and PAG boundaries during necking deformation and those size tended to correspond to crack sizes observed on the specimen surface (Fig. 2(e)). It should be the reason why the PAG size influences on the crack size.

Fig. 2. SEM images of (a), (b) the whole necking and (c), (d) representative cracks within the necking region in the (a), (c) fine-and (b), (d) coarse-prior austenite grain (PAG) specimens, and histograms of the crack sizes observed within the white dotted line in (a) and (b).
Figure 3 shows εMises strain distribution analyzed from (a), (b) the low-magnification and (c), (d) high-magnification SEM images of the replica films in the (a), (c) fine- and (b), (d) coarse-PAG specimens just before fracture. The non-colored regions denote errors in the DIC analysis. Although there were several error regions, a majority of each image could be successfully analyzed. The strain was inhomogeneously distributed in both specimens, which is consistent with the findings of a previous study.12) The εMises strain distribution in the high-resolution SEM images (Figs. 3(c), 3(d)) indicates that the strains in the high- and low-strain regions are two times higher than and one-half lower than the average strain, respectively. Here, the cumulative average εMises within the high- or low-strain regions indicated by arrows in Figs. 3(c), 3(d) was calculated from the εMises strain distributions at each nominal strain (Fig. 1). The average εMises within the necking region was calculated from the εMises strain distributions in the low-magnification SEM images (Figs. (a), (b)). Figures 3(e) and 3(f) show the relationship between the cumulative average εMises within the high- or low-strain regions and that within the necking region, in the fine- and coarse-PAG specimens, respectively. The cumulative average εMises in all strain regions increases linearly with increasing εMises within the necking region. However, the rate of increase differs significantly among the two types of strain regions; the high-strain regions have an approximately five times greater slope than that in the low-strain region. As a result, the high-strain regions exhibit εMises of over 1.0 just before fracture in both specimens. The εMises was calculated under the assumption of a plane strain state. However, within the necking region, the thickness significantly decreased. Thus, the measured εMises by DIC analysis during necking deformation must be underestimated compared to that inside the specimen. The cumulative average εMises in the high strain-region when the crack nucleates are approximately 0.2 in both specimens, as indicated by arrows in Figs. 3(e) and 3(f). Despite the cumulative average εMises in the low-strain region reaching approximately 0.2 just before fracture, no cracks are detected. This suggests that crack nucleation is influenced not only by strain accumulation but also by other factors.
Figure 4 shows a histogram of the ratio of the local εMises in crack nucleation regions to average εMises (Rloc/avg) calculated from the εMises strain distribution map at a uniform strain. The local εMises and average εMises were measured in the same way as in Fig. 3. The measured local εMises is the strain before crack nucleation, allowing the exclusion of the increase in strain due to strain concentration around a crack. More than 80% of the cracks nucleated from high-strain regions, where the local strain exceeded the average strain (Rloc/avg > 1). Thus, it can be confirmed that high strain is a factor for crack nucleation.

Fig. 4. Histogram of ratio (Rloc/avg) of local εMises to the average εMises at the uniform strain in the crack nucleation regions in fine- and coarse-prior austenite grain (PAG) specimens.
The microstructural features at the crack nucleation sites were characterized using variant analysis between two neighboring blocks adjacent to the crack, in accordance with the method proposed by Morito et al.13) Figure 5 shows the representative results of the variant analysis and (a), (b) orientation maps in the regions examined in the variant analysis. In Fig. 5(c), the (001) pole figure for a block rotated so that another block is identical to variant 1 is plotted on the (001) pole figure, which contains 24 variants.13) The two neighboring blocks indicated by the arrows in Fig. 5(a) satisfy the variant 8 relationship (Fig. 5(c)), which indicates that the variant relationship is maintained even though the average εMises within the necking region is remarkably high, i.e., over 0.6. Therefore, the crack in Fig. 5(a) lies on a packet boundary. The blocks shown in Fig. 5(b) do not satisfy the variant relationship, indicating that the crack lies on a PAG boundary. Measured using the above method, Fig. 6 shows the frequency of cracks at each of the following locations: inside a block, on a block boundary, a packet boundary, and a PAG boundary. The frequency of cracks inside a block and on a block boundary is low (only 0.3) and were detected only in the fine PAG specimen. There is a possibility that those cracks propagated from the inside, and further studies such as three-dimensional observation of the crack is needed. Anyway, those results suggest that cracks are difficult to nucleate inside a block and on a block boundary. Since it was reported that the fatigue crack nucleates from the block boundary,8) this trend is characteristic point in the tensile deformation. The primary crack nucleation sites in the fine- and coarse-PAG specimens are PAG and packet boundaries, respectively. The ratio of the PAG boundary area in the coarse-PAG specimen to that in the fine-PAG specimen is approximately 0.08. However, the ratio of the frequency of cracks at PAG boundaries in the coarse-PAG specimen to that in the fine-PAG specimen is 0.7. Therefore, a larger number of cracks are detected in the coarse-PAG specimen than expected from its PAG boundary area. This strongly suggests that crack nucleation is favorable at PAG boundaries, and reasonably explains why the fine-PAG specimen exhibits a high number density of cracks (Fig. 2(e)).
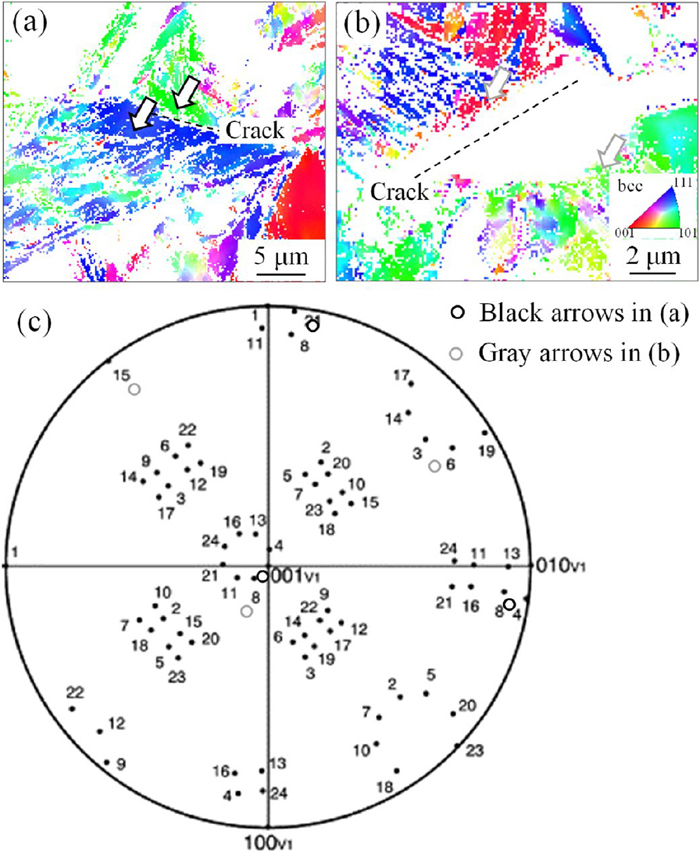

Fig. 6. Frequency of cracks inside the block, on block, packet, and prior austenite grain (PAG) boundaries.
The results revealed that the factors influencing crack nucleation in tensile deformation are high strain (Rloc/avg > 1) and the presence of PAG or packet boundaries. It can be reasonably understood that a high strain results in high stress concentration, which induces cracking. However, the role of PAG or packet boundaries in crack nucleation is unclear. Recently, anisotropic residual stresses depending on the Bain correspondence were confirmed in a martensite structure;14) tensile and compressive residual stresses were present along [001], and [010] or [100] axes of the PAG, respectively. Furthermore, it has been demonstrated that these residual stresses affect crack propagation during brittle fracture.15) Therefore, it is possible that the residual stress also induces the cracks during tensile deformation. Unfortunately, the PAG could not be reconstructed from the EBSD data measured from the fractured specimens (Figs. 5(a), 5(b)). Thus, the EBSD data in a crack nucleation region before deformation were measured using a notch specimen. Figure 7 shows (a) the orientation map of martensite before deformation and (b) SEM image in the identical region with (a) after fracture. A crack forms, as indicated by the white arrow, and the crack nucleation site is the boundary between blocks. Based on the variant analysis, that boundary corresponded to a packet boundary. Hereafter, the blocks are referred to as P1 and P2, as shown in Fig. 7(a). The PAG in the crack nucleation region was successfully reconstructed. The pole figures of <001> in martensite and reconstructed austenite in P1 and P2 are shown in Fig. 7(c). A common [001] between martensite and austenite can be observed, as indicated by the black dotted circles in Fig. 7(c). Figure 7(d) shows schematic illustrations of crystallographic structures and directions of residual stresses in P1 and P2. The red and blue arrows indicate the tensile and compressive residual stresses, respectively. The [010]Austenite in P1 and the [100]Austenite in P2 are parallel, and both are compressive residual stresses. These residual stress conditions should induce cracks at the boundary. In the 24 variant relationship, there are few pairs of residual stresses between two neighboring blocks, that is only 3 (Bain group). However, at a PAG boundary, the neighboring blocks do not satisfy the variant relationship, and the proper pair of residual stress to nucleate the crack could be present. This may explain why cracks tend to nucleate from PAG boundaries (Fig. 6). However, a quantitative analysis of the relationship between residual stress and crack nucleation could not be conducted owing to the lack of other detected cracks in the notch specimen; further studies are needed.

Fig. 7. (a) orientation map of martensite before deformation and (b) SEM image in the identical region with (a) after fracture. (c) The <001> pole figure in martensite and reconstructed austenite in the P1 and P2 blocks in (a). The schematic illustrations in crystallographic structure and residual stresses in P1 and P2 blocks. (Online version in color.)
4. Conclusion
The strain distribution and microstructure at the crack nucleation sites in martensitic steel with fine- and coarse-prior austenite grains subjected to tensile deformation were characterized using replica-digital image correlation analysis. The main results are summarized as follows:
(1) The yield and tensile stresses were approximately identical independent of prior grain size. However, the total strain was improved in the coarse-prior austenite grain specimen.
(2) The crack size increased with the coarsening the prior austenite grain, while the number density of cracks decreased.
(3) Strain was inhomogeneously introduced in both specimens. The cumulative εMises strain within high- or low-strain regions increased linearly with increasing cumulative average εMises strain within the necking region. The accumulated εMises strain when the crack nucleated was approximately the same, independent of prior austenite grain size. In low-strain regions, there were no cracks even though the accumulated εMises strain was the same as the high-strain region when crack nucleation.
(4) The strain at the crack nucleation site was high even before crack nucleation. Furthermore, it was confirmed that most cracks nucleated from high-strain regions over average strain.
(5) Cracks mainly nucleated on packet and prior austenite grain boundaries; there were only a few crack nucleation sites inside blocks and on block boundaries. Crack nucleation on the prior austenite grain boundaries is likely eased because even in the coarse-prior austenite grain specimen, a comparably large number of cracks nucleated from the boundary.
Thus, the high local strain and the presence of packet or prior austenite grain boundaries were concluded to be the factors responsible for crack nucleation in martensitic steel subjected to tensile deformation.
Acknowledgement
The authors acknowledge financial support from the 31st ISIJ Research Promotion Grant, JFE 21st Century Foundation, and the Grant-in-Aid for Scientific Research (KAKENHI) Grant No. 20K14605. This work was supported by the Research Society for Heterogeneous Deformation Structure and its Effects on Mechanical Properties, ISIJ.
References
- 1) T. Maki: Materia Jap., 54 (2015), 626. https://doi.org/10.2320/materia.54.626
- 2) Y. Ishimoto, M. Michiuchi, S. Nambu, K. Asakura, J. Inoue and T. Koseki: J. Jpn. Inst. Metals, 73 (2009), 720. https://doi.org/10.2320/jinstmet.73.720
- 3) T. Inoue, S. Matsuda, Y. Okamura and K. Aoki: Trans. Jpn. Inst. Met., 11 (1970), 36. https://doi.org/10.2320/matertrans1960.11.36
- 4) S. Matsuda, T. Inoue, H. Mimura and Y. Okamura: Trans. Iron. Steel. Inst. Jpn., 12 (1972), 325. https://doi.org/10.2355/isijinternational1966.12.325
- 5) A. Shibata, Y. Madi, K. Okada, N. Tsuji and J. Besson: Int. J. Hydro- gen Energy, 44 (2019), 29034. https://doi.org/10.1016/j.ijhydene.2019.09.097
- 6) A. Shibata, T. Yonemura, Y. Momotani, M. Park, S. Takagi, Y. Madi, J. Besson and N. Tsuji: Acta Mater., 210 (2021), 116828. https://doi.org/10.1016/j.actamat.2021.116828
- 7) S. Ueki, Y. Mine and K. Takashima: Mater. Sci. Eng. A, 773 (2020), 138830. https://doi.org/10.1016/j.msea.2019.138830
- 8) K. Okada, A. Shibata, Y. Takeda and N. Tsuji: Inter. J. Fatigue, 143 (2021), 105921. https://doi.org/10.1016/j.ijfatigue.2020.105921
- 9) S. Hamada, T. Fujisawa, M. Koyama, N. Koga, N. Nakada, T. Tsuchiyama, M. Ueda and H. Noguchi: Mater. Charact., 98 (2014), 140. https://doi.org/10.1016/j.matchar.2014.10.010
- 10) N. Koga, Y. Sakamaki, A. Kaseya, O. Umezawa, H. Nakata and S. Toyoda: Mater. Chara., 185 (2022), 111731. https://doi.org/10.1016/j.matchar.2022.111731
- 11) N. Koga, A. Kaseya, O. Umezawa, H. Nakata and S. Toyoda: ISIJ Int., 62 (2022), 2132. https://doi.org/10.2355/isijinternational.ISIJINT-2022-173
- 12) N. Koga, M. Fujita and C. Watanabe: Mater. Trans., 62 (2021), 1424. https://doi.org/10.2320/matertrans.MT-M2021118
- 13) S. Morito, H. Tanaka, R. Konishi, T. Furuhara and T. Maki: Acta Materialia, 51 (2003), 1789. https://doi.org/10.1016/S1359-6454(02)00577-3
- 14) D. Fukui, N. Nakada and S. Onaka: Acta Mater., 196 (2020), 660. https://doi.org/10.1016/j.actamat.2020.07.013
- 15) D. Fukui, Y. Kawahito, N. Miyazawa and N. Nakada: Mater. Char., 191 (2022), 112157. https://doi.org/10.1016/j.matchar.2022.112157
