Regular Article
Influence of Ferrosilicon Addition on Silicon-oxygen Equilibria in High-silicon Steels

2024 年 64 巻 7 号 p. 1143-1154

詳細
2024 年 64 巻 7 号 p. 1143-1154
The role of impurities introduced to the steel melt through ferrosilicon addition is of considerable importance in determining the steel cleanness of Si-killed, Si-alloyed steel grades. The silicon requirement is often met with ferrosilicon (FeSi) addition at the industrial scale. In the present study, a detailed investigation of commercial purity ferrosilicon (FeSi) alloy has been conducted to assess its impurity content. Aluminium and titanium were found to be the main impurities among others. Si–O equilibria in liquid steel has been established at 1873 K using FeSi alloy for a wide range of silicon concentration to examine the influence of its impurities. The actual Si–O equilibria established through FeSi addition was compared with true Si–O equilibria which was established using High-purity silicon (HPS) addition. It has been observed that impurities (mainly aluminium and titanium) from FeSi perturbed the true Si–O equilibria. Thermodynamic and kinetic considerations pertaining to this deviation have been elaborated in the present study.
Silicon is used as a deoxidiser and also, as an alloying element in some steel grades. Silicon deoxidation is usually adopted to avoid harmful, non-deformable inclusions. Silicon content in the steel can vary from a few hundred ppm (for deoxidation) to several wt% (for alloying up to 6.5 mass% or wt% in electrical steel).1)
Si–O equilibria in liquid iron/steel has been investigated using equilibrium experiments and thermodynamic analysis in the past several decades2,3,4,5,6,7,8,9,10,11,12) as summarized in Table 1. Vacuum3,4,6,10,11) or inert gas7,8) combustion methods have been used to measure the total oxygen (TO) content. The inert gas combustion method has been most extensively used in recent decades for fast, easy, and accurate analysis.8,13) Our recent study8) established Si–O equilibria using high-purity silicon (HPS) in liquid iron at 1823–1873 K. The adopted sampling methodology8) was effective to avoid/minimize the inclusions in the analysed sample for TO measurement.
| Silicon source | wt% Si | Temperature (K) | Furnace* | Crucible | TO measurement⁑ | Si content range (wt%) | Year | Ref. |
|---|---|---|---|---|---|---|---|---|
| – | – | 1823–1923 | IF | Silica, alumina, magnesia | VFM | 0.002–1.39 | 1950 | 10) |
| Pure silicon or its alloy | 99.83 – | 1818–1923 | IF | Silica | VFM | 0–15 | 1952 | 3) |
| Pure silicon | – | 1898 | IF | Silica | VFM | 0.03–2.84 | 1959 | 6) |
| FeSi | 99.9, 58.8 | 1823–1923 | IF | Silica, alumina, magnesia | VFM | 0.5 | 1970 | 4) |
| – | – | 1823 | IF | Alumina | EM | 0.1–1.1 | 1973 | 12) |
| Pure silicon | – | 1873 | IF | Silica | VFM | 0.1–1 | 2001 | 5) |
| Single crystal silicon | 99.999 | 1873 | IF | Silica | IGFM | 0.1–70 | 2005 | 7) |
| – | – | 1873 | IF | – | – | 0.2–5 | 2013 | 2) |
| HPSΔ | 99.9999 | 1823–1873 | ERF | Alumina | IGFM | 0.1–5.64 | 2023 | 8) |
*IF: Induction furnace, ERF: Electric resistance heating furnace, ⁑VFM: vacuum fusion method, EM: Electrochemical method, IGFM: Inert gas fusion method, ΔHPS: High-purity silicon
Most of the previous studies (Table 1) were focused on pure silicon (Si > 99.8 wt%) addition. None of these studies have specifically mentioned about the FeSi impurities. However, for economic reasons, the silicon requirement is largely fulfilled with FeSi (silicon content ~ 45–75 wt%) addition during industrial steelmaking. Depending on the raw-material quality used for FeSi production, some impurities remain in the FeSi.14) The types, concentration and the distribution of the impurities present in the FeSi in the form of the dissolved elements, intermetallic compounds and the inclusions, could influence the oxygen content (Si–O equilibria) and the inclusion characteristics. A summary of FeSi grades, silicon content, and (predominant) trace impurity contents is provided in Table 2. These FeSi impurities can lead to undesired chemical reactions (forming complex inclusions15,16,17)) and even deviation from the true Si–O equilibria.
| Fe–Si grade | Si content (wt%) | Trace impurities (wt%) | Intermetallic phases | Inclusions | Year | Ref. | |||
|---|---|---|---|---|---|---|---|---|---|
| Al | Ca | Ti | O | ||||||
| FeSi75 | 77.52 | – | 0.12 | – | – | – | – | 1987 | 18) |
| FeSi75 | 75.4–75.9 | 0.004–1.34 | 0.006–0.11 | 0.018–0.076 | 0.016–0.36 | FeSi2.5, Si2Ca, Si2Al2Ca, FeSi2Ti, Fe4Si8Al6Ca | – | 1996 | 17) |
| FeSi75 | 74.4–76 | 0.02–3 | 0.01–1.75 | – | – | – | – | 2001 | 16) |
| FeSi65 (75) | 67.6 (77.8) | 2–3.5 (0.5) | – | – | 0.17 (0.016) | – | SiO2, Al2O3, Al–Ca–Si–O, Al–Mg–O | 2010 | 15) |
| FeSi75 | 86.5 | 0.18 | 0.06 | – | 0.0458 | Si, FeSi | Ca–Mg–Al–O | 2010 | 19) |
| FeSi75 | 75.99 | 0.072 | 0.059 | 0.043 | – | Si, FeSi | – | 2011 | 20) |
| FeSi75 | 75.96 | 1.16 | 0.224 | 0.083 | – | Si, Fe–Si–Ti, Ca–Si | REM-Si-Fe-Ti-O, | 2014 | 21) |
| FeSi65 | 60–65 | 0.98–1.06 | 0.2–0.3 | 0.16 | – | Si, FeSi2.7, FeSi2.2, Mg3P2 | SiO2, Al2O3 | 2014 | 22) |
| FeSi75 | 73–78 | <1.5 | <0.6 | – | – | – | – | 2015 | 23) |
| FeSi75 | 75 | 1.36 | : 0.76 | – | – | Si, Fe, Al–Ca | – | 2020 | 24) |
| FeSi72 | 72 | 0.02–1.6 | 0.05–1.3 | – | – | Si, Fe, Fe–Al, Ca–Si | – | 2020 | 25) |
| FeSi72 | 72.3–73.6 | 0.05–0.24 | 0.007–0.011 | 0.02–0.1 | – | Si, Fe–Si | SiO2, SiC, Si–Al–Mg–Ca–O | 2020 | 26) |
| FeSi75 | 75 | – | 2 | – | – | Si, CaSi2, Fe0.92Si2 | – | 2021 | 27) |
| FeSi75 | 80.81 | 0.78 | – | 0.21 | 0.0246 | Si, FeSi2, SiTi2, Fe2Al3Si3, FeSi-Al-(Ti) | SiO2, Ca–Mg–Si–O, Al2O3 | 2023 | Present study) |
Depending on the FeSi type/grade, the same addition quantity can also lead to varying oxygen contents in the steel melt.15,17) The oxygen content of the steel melt was decreased from 50–60 ppm to 40–45 ppm on FeSi65 (2 wt% aluminium) addition and to 15–20 ppm on FeSi75 (0.5 wt% aluminium) addition.15)
No systematic study has been found in the literature that reported the influence of FeSi addition on Si–O equilibria for a wide range of silicon concentrations. In the present study, (i) a detailed investigation of the FeSi alloy for the assessment of the impurities and (ii) the influence of these FeSi impurities on the Si–O equilibria established in liquid iron/steel at 1873 K have been studied. Finally, the influence of FeSi vis-à-vis high-purity silicon (HPS) addition8) on Si–O equilibria has been examined.
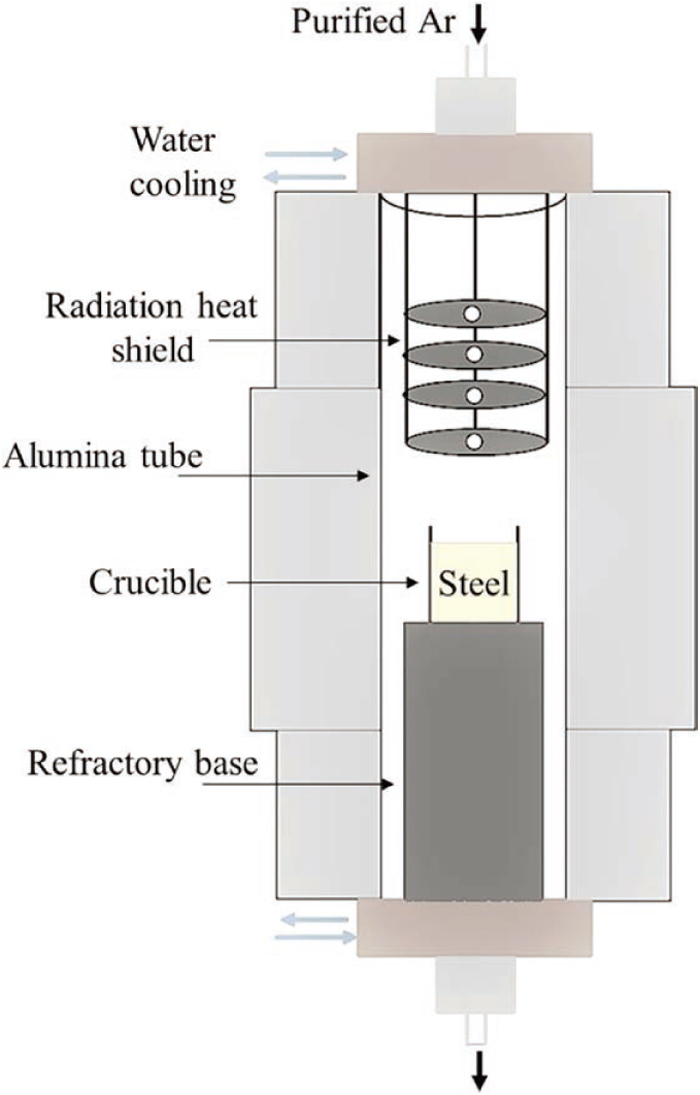
High-purity electrolytic iron (99.99%) and FeSi were commercially procured. The details of the experimental setup and method for carrying out the experiments in the vertical tube furnace under a purified argon atmosphere have been reported in our previous study.8) A schematic of the experimental setup is shown in Fig. 1. A predetermined amount of the electrolytic iron and FeSi was kept in the furnace in an alumina crucible. The details about crucible selection and its consequences are discussed in section 3.3. After initial (purified) argon flushing for six hours, the sample was heated to 1873 K with a heating rate of 4 K/min and held at that temperature for 2 h to achieve equilibrium. The sample was then furnace-cooled. The sampling methodology and characterization of solidified ingot were similar to our previous study.8) The solidified ingot after each equilibrium experiment was used as a sample which was sectioned for various analyses, for example, the sampling locations for (i) compositional analysis was the central bottom (CB) region and (ii) inclusion analysis has been carried out in the central middle (CM) and CB regions of the solidified ingot.
Oxygen content (TO) was measured using LECO (ON 736) oxygen analyser, and Si content was measured using the wet chemical method (ASTM E350-2018). The Si concentration of solidified steel samples (> 5 wt% Si) was also analysed using optical emission spectroscopy (OES). The silicon content measured using OES was within the experimental error of chemical wet analysis. The percentage difference of average silicon content measured using OES and chemical wet analysis with respect to average of wet analysis was 3–5%. Aluminium, titanium, and calcium concentrations of the FeSi and the samples obtained from the melting experiments were measured using inductively coupled plasma atomic emission spectroscopy (ICP-AES). FeSi samples were also characterized using X-ray diffraction (XRD), X-ray fluorescence (XRF), and scanning electron microscope energy dispersive spectroscopy (SEM-EDS) analysis.
The XRD analysis of the high-purity silicon (HPS) and FeSi sources is shown in Fig. 2. HPS contains pure silicon phase (Si) only. In contrast, primarily Si, FeSi2, and minor Fe2Al3Si3 and TiSi2 phases were present in FeSi. The presence of Fe and FeSi2 phases are consistent with the Fe–Si binary phase diagram.

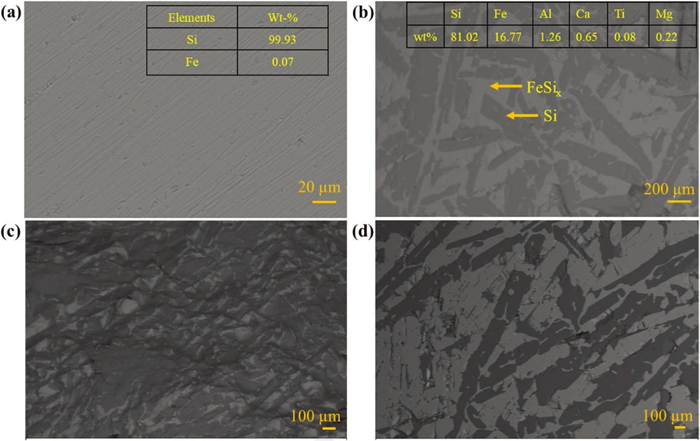
The micrograph and composition of the silicon sources are shown in Figs. 3(a)–3(d). The phase contrast of the backscattered electron (BSE) image (Fig. 3(a)) depicted the single phase with an average composition (at five different locations) of 99.93 wt% silicon and 0.07 wt% iron in HPS. On the other hand, two-phase regions comprising a dark region (pure silicon phase) and a bright region (iron silicate (FeSix) phase) were primarily observed in the FeSi sample, as shown in Fig. 3(b). Many holes/pores and cracks were observed in the FeSi matrix, which could have formed due to considerable microheterogeneity and silicon segregation.22) The crack could also be formed during cooling as the inclusions provide an excellent site for micro-cracks nucleation. Similar findings of silicon and iron silicate phases and holes/cracks were also reported in previous studies.22,26) The silicon and iron silicate phase distribution were nearly uniform (as shown in Fig. 3(b)). However, silicon-rich or iron silicate-rich micro-regions were occasionally observed, as shown in Figs. 3(c)–3(d).
The trace impurities (aluminium, and titanium) were either (i) dissolved in the iron silicate phase or present as (ii) intermetallic and (iii) inclusion phases. Micrographs of the different intermetallic phases and inclusions in the FeSi are shown in Figs. 4(a)–4(d). Apart from silicon and iron silicate phases, FeSi-Al-(Ti) and FeAl were frequently observed, which agrees well with the relatively higher aluminium and titanium contents than other impurities. These impurities were precipitated as intermetallic phases at the grain boundaries/interfaces owing to their low solubility in the silicon phase. Predominant intermetallic impurity phases were also reported in prior studies.17,21) Figures 4(c)–4(d) shows SiO2 and Al2O3 inclusions commonly observed in the FeSi sample. The intermetallic phase FeSi-Al-(Ti) and inclusion types agree well with the previous studies.19,21,22,26) Intermetallic phases containing calcium, as reported in the previous studies,17,27) were not observed in the present study. Calcium and magnesium were present as inclusions (Fig. 4(c)).

The composition of FeSi determined using XRF analysis is shown in Table 3. The average silicon (80.81 wt%) and iron (16.80 wt%) contents of the FeSi (XRF analysis) are in good agreement with the EDS analysis (81.02 wt% silicon and 16.77 wt% iron). Aluminium, titanium, and calcium concentrations were 0.78±0.21 wt%, 0.21±0.07 wt%, and 0.36±0.11 wt%, respectively, as per ICP-AES analysis. In comparison, the aluminium and titanium contents of the high-purity silicon (HPS) were non-detectable, that is, less than 0.01 ppm.8) FeSi (FeSi75) containing 72–86 wt% silicon with impurities such as aluminium (0.004–1.5 wt%), calcium (0–0.22 wt%), and titanium (0.02–0.1 wt%)17,19,21,26) had been widely used in previous studies. The composition of electrolytic iron used in the present study was 99.93 wt% Fe with traces of Si, C, Mn, Co, Zr, and Cu.
| Si (wt%) | Fe (wt%) | Al (wt%) | Ti (wt%) | Ca (wt%) | Mg (wt%) | Zr (wt%) | Mn (wt%) | Others (Co, Cr, Cu, S, P, Cl, K) (wt%) | |
|---|---|---|---|---|---|---|---|---|---|
| Sample 1 | 80.817 | 16.779 | 0.792 | 0.216 | 0.715 | 0.235 | 0.039 | 0.157 | 0.250 |
| sample 2 | 80.799 | 16.830 | 0.754 | 0.200 | 0.698 | 0.225 | 0.036 | 0.185 | 0.273 |
| Average | 80.81 | 16.80 | 0.77 | 0.21 | 0.71 | 0.23 | 0.04 | 0.17 | 0.26 |
The total oxygen (TO) and nitrogen content of the FeSi sample was found to be 0.0246±0.012 and 0.0003 wt%, respectively, as per LECO analysis. The variation in the oxygen content in the FeSi can be attributed to the inhomogeneous distribution of non-metallic inclusions and air pockets (micro-holes/cracks).
3.2. Experimental AnalysisThe measured Si, Al, Ti, TO, and nitrogen content of the solidified steel samples obtained for FeSi addition experiments are given in Table 4. The elements, either underlined (Si) or in a square bracket ([Si]), represent the dissolved (1 wt% Henrian) standard state of the element. A similar notation is followed throughout the manuscript. Al, Ti, and Ca content of solidified samples with high-purity silicon (HPS) addition (up to 5.64 wt% Si) was negligible (<0.01 ppm).8) The Ca contents of all the solidified samples in FeSi addition experiments were non-detectable (i.e., below 0.01 ppm).
| Expt. No. | Si content (wt%) | Al content (ppm) | Ti content (ppm) | Average TO (ppm) | Error (TO, ppm) | Average N content (ppm) | Error (N content, ppm) |
|---|---|---|---|---|---|---|---|
| 1 | 0.19 | 2.16 | 6.93 | 68.57 | 4.93 | 12.3 | 1.11 |
| 2 | 0.63 | 11.3 | 8.00 | 36.57 | 1.01 | 9.7 | 1.55 |
| 3 | 1.71 | 24.73 | 50.13 | 31.03 | 2.10 | 13.8 | 0.97 |
| 4 | 3.35 | 11.90 | 48.00 | 26.10 | 0.80 | 27.0 | 5.95 |
| 5 | 5.36 | 59.00 | 138.00 | 24.57 | 0.67 | 15.8 | 1.92 |
| 6 | 7.55 | 29.00 | 210.00 | 22.40 | 2.80 | 17.3 | 2.30 |
| 7 | 12.5 | 34.00 | 284.00 | 16.93 | 1.13 | 4.3 | 0.86 |
It can be seen from Table 4 that the measured Al content of the solidified samples obtained from the melting experiments on FeSi addition was not increased proportionately with Si concentration. The disproportionate increase in the Al content could be due to inhomogeneous aluminium distribution in the FeSi alloy (see section 3.1). Al pick-up due to crucible-steel interaction was negligible in the case of HPS up to Si concentration of 5.64 wt%.8) Al pick-up in the case of FeSi addition experiments was not significant (see section 3.3). The Ti content of the solidified sample increased proportionately with increasing Si concentration. The Ca content of the solidified samples was negligible. Thapliyal et al.23) reported an Al content of 0.001 wt% (and no Ca concentration though calcium was present as impurity in the added FeSi alloy) in the steel sample containing around 0.8–0.9 wt% Si, which is in reasonable agreement with the present study.
The relationship between the silicon added (for HPS and FeSi addition) and the measured Si content of the solidified steel samples are shown in Fig. 5, depicting the similar trend in both cases. The measured Si content was expectedly lower than the actual silicon added to the steel melt due to the formation and removal/flotation of silica particles and/or complex silica-based inclusions.

Stoke’s law (ignoring the natural convection in the steel melt) can approximate the floating velocity and the upward distance that the oxide particle can traverse. For instance, silica inclusion of size 3 μm can travel upward by 20 mm in 1.22 h, which is sufficient for such silica particles to traverse half the height of the solidified ingot. Thus, a time of 2 h was considered sufficient for achieving equilibrium. Also, the sample for compositional/total oxygen analysis from the central bottom (CB) portion adequately minimized the inclusion containment in the analysed sample.8)
The total oxygen (TO) was almost similar in the solidified samples obtained using high-purity silicon (HPS) and FeSi addition at low Si content (≤0.63 wt%). However, in the higher Si content (above 1.5 wt%) range, a slightly higher TO content (4–5 ppm higher) in the solidified steel was obtained in the case of FeSi addition. A comparison of the TO content between FeSi (present study) and the HPS8) addition is discussed in section 3.5.
3.3. Crucible Selection and its EffectPure silica crucibles should be ideally used for experimental assessment/establishment of the Si–O equilibria. In the previous studies3,4,5,6,7,9,10) mostly silica/quartz crucibles were used for experiments to establish the Si–O equilibria. However, these crucibles have poor thermal stability. The steelmaking temperature (1873 K) and the melting point of the pure silica (around 1990 K) are close; thus, silica crucibles soften at such a high temperature, especially in the resistance-heated furnace. Thus, crucible wear can introduce silica inclusions to the liquid steel. An induction furnace was used in the previous studies,3,4,5,6,7,9,10) where equilibrium time is often shorter than the resistance heating furnace used in our study. A longer equilibrium time (2 h) was used to ensure that equilibrium was achieved and provided enough time for inclusions to float to the top. Moreover, numerous commercial manufacturers often recommend a temperature to use silica crucibles below 1723 K (for short duration) and 1423 K (for more extended holding).
Nevertheless, a few experiments were carried out using a silica crucible. A predetermined amount of electrolytic iron and high-purity silicon (HPS) kept in the silica crucible (OD 30 mm) was heated to 1873 K in the furnace. The crucible was deformed and broken. The experiment was repeated with a silica crucible by placing it inside a bigger alumina crucible (OD 52 mm). The silica and alumina crucible photographs before and after the experiment can be viewed in Figs. 6(a)–6(d). These photographs show the broken silica crucible, at the bottom to middle portion, that was in direct contact with the steel melt. The inner wall of the silica crucible, which was in direct contact with the melt, revealed significant crucible wear, indicating a higher chance of introducing inclusions to the steel melt. Thus, variation (in TO content) was observed in the analysed samples (see section 3.5). The crucible colour was changed from transparent to milky white. XRD analysis of the silica crucible (after experiment) is shown in Fig. 6(c). Silica/quartz transforms to (β-cristobalite) above 1473 K, which transforms to α-cristobalite during cooling.28) Such phase changes are associated with a volume change (of around 5%),28) which could cause a crucible rupture. The outer alumina crucible used in silica crucible experiments is shown in Fig. 6(d). No visual changes have been observed in the alumina crucible. Furthermore, impurities in (or on the surface of) the crucible help the nucleation, making phase transformation feasible even at lower temperatures.29) Thus, it can be expected that silica crucible can be prone to cracking and wear in the case of ferrosilicon addition (due to the presence of impurities in the steel melt). Therefore, a crucible with better thermal stability, such as alumina, have been used.

An alumina crucible can be reduced by Si dissolved in the steel melt and lead to Al pick-up in the steel melt. The erosion of alumina crucible can occur via the porous product layer (for example, hercynite or mullite) formation at the crucible-steel interface depending on the oxygen partial pressure.30) The formation of such a layer is more favorable at higher oxygen partial pressure. A contact angle of 132° at 10−14 Pa, that is a non-wetting layer between steel melt and alumina crucible,30) inhibits the penetration of the melt, thereby limiting the refractory dissolution. A very low oxygen partial pressure can be expected in our experiments as a purified high-purity argon atmosphere (see section 2) was employed. Thus, the possibility of hercynite/mullite formation is significantly low, and Al-pick can be considered negligible. The slag-refractory interaction is usually more severe compared to steel-refractory interaction. Sigworth and Elliott12) used alumina crucibles in their melting experiments to measure the oxygen activity and to study the silica nucleation in liquid iron. They12) did not report any crucible effect on the inclusion characteristics and oxygen activity. Similarly, the insignificant effect of alumina crucible on Si–O equilibria (for Si content > 0.1 wt%) is also reported.10) On the other hand, Suzuki et al.4) reported a significant difference in TO contents between silica and alumina crucible experiments (induction furnace) at 0.5 wt% Si (FeSi addition). In that case, silica crucible wear, sampling contamination, differences in initial oxygen content, and FeSi impurity interaction, among others, could lead to such variation. The interaction between the alumina crucible, liquid steel (Fe, Si, O), and the silica inclusions was found to be negligible during high-purity silicon (HPS) addition experiments up to Si concentration of 5.64 wt% as reported in our previous study.8)
The photographs of alumina crucibles (after experiments) obtained from HPS and FeSi addition experiments are shown in Figs. 7(a) and 7(b), respectively. The height of the solidified ingot was around 25–28 mm. As evident from Fig. 7(a), the crucible wall in direct contact with solidified ingot remained smooth and shiny without any crucible wear. In comparison, the crucible wall in the case of the FeSi addition experiments had slight black patches and was dull in appearance. SEM micrographs of the crucible-steel interface (lower portion) corresponding to the wall in direct contact with steel ingot (melt) are shown in Figs. 7(c) and 7(d). In the case of HPS addition experiments (Fig. 7(c)), there were only alumina particles up to 25 mm from the crucible base. In comparison, many complex inclusions (Ca–Al–Fe–Si–Zr–Mg–O) were deposited on the alumina crucible in the case of FeSi addition (Fig. 7(b)). Several inclusion deposits were observed in the upper region corresponding to the top portion of the ingot, where mostly floated/separated inclusions could be expected. There was minor crucible-steel interaction at low to medium FeSi addition experiments (below 7.55 wt% Si). The modification of alumina particles (crucible) occurred in the case of very high FeSi addition experiments (12.5 wt%). The crucible-steel interaction resulting in Al pick up (into the steel melt) was still not considerable. Detailed results about the steel melt-crucible interaction will be reported in the next part of the study.

Based on the experimental analysis (Table 4), thermodynamic analysis is carried out using Wagner’s interaction parameter formalism (WIPF) truncated at the second order. WIPF31) is strictly valid for infinitely dilute solutions, yet, it has been widely employed for liquid steel with finite concentrations due to its mathematical simplicity.32) The silicon deoxidation reaction can be expressed as shown in Eq. (1).
| (1) |
The equilibrium constant for the silicon deoxidation is given in Eq. (2) where, fSi, and fO are the activity coefficients of silicon and oxygen, respectively. And, aSiO2 is silica activity.
| (2) |
The activity coefficient of solute ‘i’ in the Fe-i-j system can be expressed, using WIPF truncated at the second order, by Eq. (3). Where,
| (3) |
The expression for equilibrium O content (Eq. (4)) can be obtained by combining and rearranging Eqs. (2) and (3).
| (4) |
A relationship between Si and O content was obtained using Eq. (4), substituting the interaction parameters (Table 5)8,33,34,35,36) and silica activity values. The silica activity was taken as one for high-purity silicon (HPS) addition experiments (that is, for the Fe–Si–O system). The calculated O content for the Fe–Si–O system is shown in Fig. 8.
| i | ||||||||
|---|---|---|---|---|---|---|---|---|
| Si | 0.107 | −0.002 | −0.154 | 0 | 0.058 | 0 | 0.84 | 0 |
| O | −0.086 | −0.0016 | −0.2 | 0 | −3.9 | 1.7 | −0.6 | 0.031 |

The FeSi impurities such as aluminium and titanium perturbed the true Si–O equilibria (Fe–Si–O). This is evident in Fig. 8, as the discrepancy between the oxygen content for FeSi vs high-purity silicon addition (HPS) is noticeable in the high silicon concentration range. Therefore, (i) the change in the activity coefficients/activities of dissolved elements such as silicon and oxygen due to the interaction with aluminium and titanium and (ii) the decrease in the activity of silica due to complex (oxide) inclusion formation was calculated for the Fe-Si(-Al-Ti)-O system.
The expression (Eq. (3)) has been extended to a multi-component system by including the additional solute terms (Al, Ti). The first and second-order interaction parameters adopted from our previous study8) and literature33,34,35,36) are given in Table 5.
Inclusions in the steel samples obtained from the HPS addition experiments (0.1–5.64 wt% Si) were pure SiO2.8) In the FeSi addition experiment, at 0.19 wt% Si, pure silica inclusions were observed, while at higher silicon concentrations, in addition to pure SiO2, complex oxides, primarily Si-Al-(Ti)-O inclusions, were also observed. The SEM micrographs of typical Si–Al–Ti–O complex inclusions observed are shown in Figs. 9(a)–9(b).

Inclusion composition was directly affected by both the Si concentration and the FeSi impurities (Al, Ti).37) The alumina content of complex oxide inclusions increased with increased Al content of the steel melt. Thus, silica-rich complex inclusions were modified to Si–Al–O (mullite) or alumina-rich Si–Al–O inclusions. Above 1.71 wt% Si, a significant fraction of oxide inclusions (particularly alumina and complex) inclusions also have a TiN inclusion layer at its periphery. The elemental mapping of such oxide-nitride (dual-phase) inclusion is shown in Fig. 10. Nitride formation/precipitation is thermodynamically possible even with trace N content (Table 4) at 1873 K as nitrogen solubility significantly decreases on increasing Si concentration. It should be noted that the inclusion characteristics were similar at both locations (CB and CM portions) in the case of FeSi addition experiments, particularly at medium to high silicon contents, but the number and size of inclusions were relatively higher and larger in central middle (CM) portion. The detailed discussion on the inclusion characteristics and their formation mechanism is out of the scope of the present study and will be communicated separately in the next part, along with the steel melt-crucible interaction.

The average composition of several complex inclusions (Si–Al–Ti–O) at varying Si concentrations (represented by experiment number) is plotted in the ternary phase diagram shown in Fig. 11. The silica activity (aSiO2) was calculated using FactSage 8.1 (Phase diagram module, FactPS, FToxid, FTmisc database). The iso-activity lines of silica in the SiO2–Al2O3–Ti3O5 system (at 1873 K) can be seen in Fig. 11. The calculated silica activity for the corresponding experiment is shown in bracket next to the experiment number in Fig. 11.

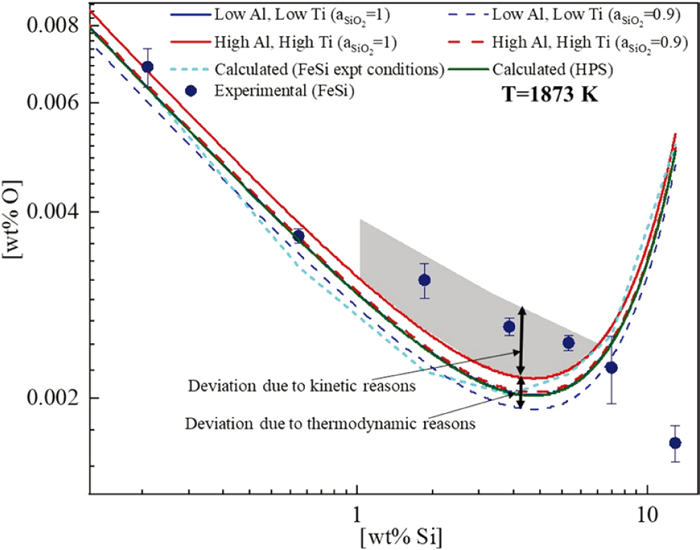
Based on the interaction parameters (Table 5) and the silica activity (Fig. 11), the O content for the Fe–Si–Al–Ti–O system for the present experiments have been estimated, as shown in Fig. 12. Additionally, O content was also calculated for minimum (min) and maximum (max) impurity concentration level which includes Al (min - 2.16 ppm/max - 59 ppm) and Ti (min - 6.93 ppm/max - 284 ppm) considering silica activity 0.9 and 1. The estimated O content corresponding to these impurities are also shown in Fig. 12, depicting the thermodynamically predicted deviation from the true Si–O equilibrium (HPS experiments). However, the measured TO contents (FeSi addition experiments) at medium-to-high silicon (1.71 to 5.36 wt%) concentrations were even higher by 4–5 ppm than the thermodynamically estimated O content. This deviation can be attributed to the kinetic factors, as discussed in section 3.5.
At 12.5 wt% Si concentrations, the predicted O content (WIPF) was higher than the measured TO, as the validity of WIPF for such high concentrations is uncertain. Moreover, increased flotation during solidification could influence the oxygen content at such Si concentrations (see section 3.5).
3.5. Comparison of Measured/calculated Oxygen ContentsA comparison of the thermodynamically estimated O content and experimentally measured oxygen content (TO) is shown in Figs. 8 and 12.
The average TO content of the solidified ingot obtained from the high-purity silicon (HPS) addition experiments with the silica crucible is similar to that of the alumina crucible. However, the variation in the measured TO content for a silica crucible was significant (see Fig. 8). The higher TO contents in the analysed sample could be due to contamination of silica inclusions due to crucible wear. The calculated O content using WIPF (see Fig. 8) is in excellent agreement with the measured oxygen (TO) content for high-purity silicon (HPS) addition experiments.8)
The measured oxygen content in the case of HPS addition experiments8) is relatively lower compared to previous studies (Table 1). Thermodynamically calculated dissolved (O) oxygen content is usually compared with the experimentally measured TO content, which comprises both dissolved (O) and combined oxygen (in the form of oxide-based inclusions).13) Thus, silica inclusions retained in the analysed sample could increase the TO content. Moreover, above 2 wt% Si, the reported oxygen content by Shibaev et al.7) was significantly lower than the oxygen content of steel ingot obtained from the HPS addition experiments.8) Shibaev et al.7) conducted the melting experiment in the induction furnace and suctioned multiple samples from the same batch of the steel melt using a quartz tube. They7) adjusted the silicon content of the melt for subsequent sampling; however, adjustment of initial oxygen was not considered.7) Such incremental addition of silicon to the steel melt could result in the underestimation of the actual O content. This would have resulted in underestimating the actual oxygen content since not enough O in the melt was available to react with incrementally added silicon, resulting in its sharp decrease at high Si contents. Thus, initial oxygen was not the same for all the subsequent samples at higher Si concentrations. In contrary, we have carried out a separate experiment for every silicon concentration, using HPS as well as FeSi additions, ensuring the similar initial conditions for all the experiments.
At low Si contents (below 0.63 wt% Si), the TO content of solidified ingot obtained from the ferrosilicon (FeSi) addition was similar to that of high-purity silicon (HPS) addition experiments. Above 0.63 wt% Si, the TO content in the case of the FeSi addition was slightly higher (4–5 ppm) than that of the HPS addition. Higher TO content in the case of low-grade FeSi addition (with high aluminium impurity) was also reported by Grogorovich et al.15)
At lower Si concentrations (≤ 0.63 wt%), the TO content in the solidified samples of FeSi addition experiments is in good agreement with the calculated O content (irrespective of the Fe–Si–O and Fe–Si–Al–Ti–O system), as shown in Figs. 8 and 12. In the present thermodynamic analysis, considering the high silicon concentration, WIPF31) truncated at the second order, also known as Lupis Elliott formalism,38) has been employed for Fe–Si–O and Fe–Si–Al–Ti–O systems. The measured oxygen content was somewhat higher than the calculated values at higher Si concentrations, above 0.63 wt% Si (experiments 3 to 5), as shown in Fig. 12. It can be expected that O content would be lower due to reduced silica activity owing to the formation of complex (silica-based) inclusions. However, the first-order cross-interaction parameter of impurities like aluminium and titanium on oxygen is far more negative compared to the second-order parameters (Table 5).
Additionally, the combined oxygen would depend on the amount of (un-floated) oxidic inclusions present in the analysed samples. Therefore, total oxygen (particularly combined oxygen) can be linked to the kinetic factors. The primary kinetic factor that could influence the oxygen (TO) content is the inclusion flotation which is related to the sampling methodology adopted in the present study. The inclusion flotation largely depends on the inclusion size and the available flotation time (before solidification). A schematic explaining the kinetic reasons that could lead to increased TO content at various conditions is shown in Fig. 13. In the case of the high-purity silicon (HPS) addition experiments (up 5.64 wt% Si), there were negligible inclusions (silica) in the CB portion as per the SEM-EDS analysis.8) Thus, most of the inclusions were floated to the top portion of the ingot. This can be substantiated by the excellent agreement between the WIPF curve (thermodynamic analysis) and the experimentally measured oxygen content.

The major deviation in the oxygen content was observed in the medium to high silicon range (above 1.71 wt% Si). Above 1.71 wt% Si, due to inherited titanium impurity, TiN layer formed at the periphery of a large fraction of the oxide inclusions (engulfing the oxide inclusion as shown in Fig. 10). Formation of the TiN layer at the steelmaking temperature is thermodynamically feasible under the present experimental conditions and will be discussed in details in our next communication. Such TiN layer could hinder further (oxide) growth as both nitrogen and oxygen are surface active elements. Moreover, complex inclusions were smaller than pure silica inclusions due to the presence of titanium, which has a lower interfacial energy with the liquid steel, thus stabilizing the small-sized inclusions. Therefore, it is probable that the complex inclusions, due to their smaller size (and thus, lower flotation efficiency), could be retained in the analysed samples. It should be noted that TiN was not formed at 0.63 wt% Si (experiment 2) so, the measured oxygen content agrees well with the thermodynamically predicted O content.
Furthermore, number of such oxide-nitride inclusions were lower in the solidified ingot obtained from experiment 7 (12.5 wt% Si) as silica inclusions were thermodynamically stable at such a high Si concentration. Additionally, the liquidus temperature of the steel decreases with increasing the Si concentration, as shown in Fig. 13 (as per FactSage 8.1). Based on the liquidus temperature, the solidification time increases with Si content owing to the present sampling technique whereby samples were obtained from the solidified ingot cooled inside the furnace. In the low to medium (1.71 to 7.55 wt%) Si content range, the secondary inclusions formed due to decreased temperature would be tiny and less likely to float in the limited time available during cooling/solidification. Therefore, these tiny inclusions will be retained in the analysed sample, and it is reasonable to assume that the equilibrium will not shift. We have experimentally verified and reported it in previous study.8) At the same time, at very high Si content (12.5 wt%), solidification time is 58 min due to a significant decrease in the liquidus temperature. Thus, some of the secondary inclusions could have floated from the central bottom (CB) to the central middle (CM) portion, leading to a decrease in the oxygen content (and shifting the Si–O equilibrium to a somewhat lower temperature). Still, the equilibrium shift (at 12.5 wt% Si) is expected to be small.
In summary, the influence of the silicon source on the Si–O equilibria and inclusion formation is schematically shown in Fig. 14. The steel cleanness is significantly affected by the silicon source. High-purity silicon (HPS) expectedly leads to cleaner steel compared to FeSi. In the steel industry, FeSi addition is a common practice for economic reasons. Therefore, adequate control of impurities (content and types) is required to produce high-quality (cleaner) steel. The FeSi used in the present study was commercially procured, and its comparison with the various (ferro)silicon grades used in the previous studies is provided in Table 2. The present study can, thus, be used directly to understand and control the steel cleanness during FeSi addition at the industrial scale (Figs. 12 and 13). The study covered a wide range of Si concentrations (0.19–12.5 wt%); therefore, the crucial findings of this work could help understand the deviation or shift in Si–O equilibria (Fig. 12) particularly in high-silicon steel grades.

FeSi alloy has been characterized for its detailed impurity content. The Si–O equilibria at 1873 K have been re-established experimentally to examine the influence of FeSi addition for a wide silicon concentration range. The following conclusions can be deduced from the present study.
(i) The major impurities in the FeSi alloy were aluminium, titanium, and total oxygen (inclusions), which were inhomogenously distributed, particularly aluminium. Microstructural investigation revealed pure silicon (Si) and iron silicate (FeSi2) as two main phases in the FeSi alloy.
(ii) The experimentally measured oxygen content (TO) of steel with FeSi addition was similar to that of high-purity silicon (HPS) addition in the low Si concentration range. However, at higher Si concentrations (≥1.71 wt% Si), the TO content of the steel with the FeSi addition was slightly higher than that of HPS addition.
(iii) The silica crucible showed poor stability in the equilibrium experiments conducted at 1873 K as compared to the alumina crucible. The interaction between the alumina crucible and the FeSi-containing steel melt was rather limited.
(iv) The true Si–O equilibria established at 1873 K using HPS addition seem to be perturbed/deviated on replacing HPS with commercial purity FeSi addition (actual Si–O equilibria). This may be linked to the impurities inherited from the FeSi alloy. Thermodynamically, this deviation can be predicted considering the interaction of FeSi impurities with silicon and oxygen and the complex inclusion formation resulting in lowering the silica activity. However, the extent of deviation was significant in the experimentally measured Si–O equilibria especially in the high (above 1.71 wt%) silicon concentration range due to increased contribution of impurities. This deviation (towards high TO content) can be linked to the presence of small sized complex inclusions. The formation of complex (Si–Al–Ti–O) and dual-phase (oxide core and nitride periphery) inclusions (Si–Al–O–TiN), with restricted inclusion growth and low flotation tendency, increased the TO oxygen in the melt. Therefore, the addition practice of silicon, depending on its source, can have major implications on the cleanliness of Si-killed, Si-alloyed steels.
The financial support for preparing this manuscript has been provided by (1) the Industrial Research and Consultancy Center (IRCC) IIT Bombay, Mumbai (project no. RD/0518-IRCCSH0-011), and (2) the Science and Engineering Research Board (SERB), Department of Science and Technology, Government of India (project no. CRG/2019/000086) (3) Centre of Excellence in Steel Technology (CoEST), IIT Bombay. The authors thank (i) Mr. Dinesh Singhmar for providing XRF results and (ii) Mr. Amit Joshi for technical help during the experimentation.
No potential conflict of interest was reported by author(s).