RESULTS
Exothermic peak and melting endotherm of corn starch suspensions with added sodium hydroxide or urea.
(1) Effects of sodium hydroxide.
Figure 1A shows DSC curves for the gelatinization of corn starch suspensions with added sodium hydroxide, where the heat flow is converted to the output in mW/g at a heating rate (HR) of 1.5 °C/min from that measured at an HR of 1.6 °C/min. In the curves, three kinds of peaks were observed with increasing temperature: a typical endothermic peak corresponding to gelatinization, a small endothermic peak, and an exothermic peak. The second small peak could be attributed to the melting of starch−lipid complexes.11) The final peak in the higher temperature region was especially remarkable at caustic-ratios greater than 3.8 mol%, and the peak areas increased to larger absolute values than those of the preceding gelatinization endotherms. Table 1 summerizes the thermal characteristics of the starch−lipid complex endotherms and the subsequent exotherm observed in the DSC measurements.

Table 1.
Thermal characteristics of the starch−lipid complex endotherms and exotherm.
|
Addition
(mol/GR-mol, %)
|
Heating Rate
(°C /min)
HR |
Endotherm (°C)
Rescan
Ts2 Tc2 Ts2 Tc2 |
Endothermic enthalpy
(kJ/GR-mol)
Rescan
ΔH2*1 ΔH2*2 |
Exothermic enthalpy
(kJ/GR-mol)
ΔH3p*3 ΔH3*4 |
|
0 |
1.66 |
85.5 |
101.7 |
83.0 |
101.0 |
0.17 |
0.13 |
|
|
|
|
5.29 |
85.7 |
105.5 |
87.6 |
105.5 |
0.19 |
0.15 |
|
|
|
|
9.97 |
88.8 |
108.4 |
86.0 |
107.1 |
0.08 |
0.13 |
|
|
|
|
14.03 |
90.9 |
110.8 |
87.1 |
110.8 |
0.07 |
0.16 |
|
|
| NaOH |
|
|
|
|
|
|
|
|
|
|
|
0.97 |
1.64 |
84.2 |
99.9 |
84.0 |
105.9 |
0.08 |
0.18 |
|
|
|
|
5.29 |
88.2 |
102.2 |
87.4 |
108.2 |
0.02 |
0.06 |
|
|
|
|
10.01 |
|
|
82.8 |
109.2 |
0.00 |
0.09 |
|
|
|
|
14.19 |
93.2 |
110.9 |
87.7 |
121.1 |
0.08 |
0.13 |
|
|
|
3.81 |
1.64 |
81.1 |
89.8 |
86.5 |
105.6 |
0.03 |
0.12 |
1.82 |
3.30 |
|
|
5.28 |
86.4 |
94.8 |
93.5 |
109.6 |
0.00 |
0.04 |
1.73 |
2.87 |
|
|
10.00 |
|
|
85.5 |
109.9 |
0.00 |
0.12 |
1.90< |
|
|
|
15.31 |
|
|
85.8 |
113.8 |
0.00 |
0.12 |
1.51< |
|
|
6.48 |
1.63 |
79.8 |
84.9 |
80.2 |
102.5 |
0.01 |
0.16 |
3.79 |
6.25 |
|
|
5.26 |
84.4 |
96.7 |
82.9 |
110.8 |
0.01 |
0.15 |
4.15 |
6.17< |
|
|
10.00 |
87.1 |
91.4 |
86.6 |
111.8 |
0.00 |
0.10 |
3.15 |
4.21< |
|
|
15.40 |
92.1 |
95.9 |
88.7 |
117.7 |
0.00 |
0.14 |
3.55 |
4.83< |
|
10.94 |
1.63 |
74.5 |
85.6 |
85.0 |
106.6 |
0.04 |
0.16 |
3.94 |
6.53 |
|
|
5.29 |
81.9 |
88.2 |
80.6 |
111.2 |
0.00 |
0.21 |
2.95 |
5.96 |
|
|
10.06 |
82.9 |
87.6 |
84.0 |
113.5 |
0.00 |
0.15 |
5.34 |
8.19< |
|
|
15.40 |
|
|
83.9 |
114.1 |
0.00 |
0.13 |
4.29< |
|
|
12.56 |
1.64 |
76.1 |
82.7 |
83.5 |
104.4 |
0.02 |
0.19 |
4.39 |
7.83 |
|
|
5.31 |
82.8 |
92.2 |
83.9 |
110.0 |
0.02 |
0.17 |
6.39 |
9.87 |
|
|
9.97 |
84.5 |
104.9 |
83.8 |
114.8 |
0.08 |
0.14 |
5.83 |
6.63< |
|
|
15.17 |
88.6 |
95.8 |
89.4 |
121.5 |
0.01 |
0.14 |
6.01< |
|
| *5 |
10.94 |
1.64 |
|
|
|
|
|
|
3.13 |
6.45 |
| *6 |
10.94 |
1.66 |
|
|
|
|
|
|
1.85 |
3.38 |
| Urea |
|
|
|
|
|
|
|
|
|
|
|
9.37 |
1.38 |
78.5 |
93.0 |
|
|
0.05 |
|
|
|
|
|
5.31 |
84.9 |
106.3 |
86.0 |
104.3 |
0.15 |
0.08 |
|
|
|
|
10.11 |
87.0 |
107.2 |
85.1 |
107.1 |
0.08 |
0.07 |
|
|
|
|
12.69 |
92.0 |
107.1 |
|
|
0.05 |
|
|
|
|
31.24 |
1.63 |
84.8 |
100.9 |
83.4 |
99.3 |
0.14 |
0.10 |
|
|
|
|
5.31 |
83.5 |
104.9 |
84.6 |
103.2 |
0.13 |
0.07 |
|
|
|
|
10.13 |
84.1 |
105.9 |
84.1 |
108.8 |
0.07 |
0.08 |
|
|
|
|
14.47 |
89.1 |
106.3 |
89.0 |
109.7 |
0.04 |
0.07 |
|
|
|
62.49 |
1.38 |
77.3 |
92.8 |
|
|
0.07 |
|
|
|
|
|
4.60 |
82.7 |
102.7 |
|
|
0.16 |
|
|
|
|
|
8.77 |
81.7 |
104.9 |
|
|
0.11 |
|
|
|
|
|
12.47 |
85.2 |
110.9 |
|
|
0.06 |
|
|
|
|
93.72 |
1.63 |
76.1 |
96.9 |
78.4 |
96.8 |
0.17 |
0.07 |
|
|
|
|
4.68 |
77.5 |
99.0 |
|
|
0.14 |
|
|
|
|
|
8.72 |
79.7 |
102.5 |
|
|
0.07 |
|
|
|
|
|
12.46 |
83.7 |
102.9 |
|
|
0.04 |
|
|
|
|
140.58 |
1.43 |
72.1 |
95.5 |
|
|
0.15 |
|
|
|
*1 Endothermic enthalpy of starch−lipid complexes, first scan. *2 Endothermic enthalpy of starch−lipid complexes, second scan. *3 Exothermic enthalpy until Tp3. *4 Exothermic enthalpy until Tc3. *5 Potato-soluble-starch. *6 Maltose.
Ts2 of the second shallow peak decreased from approximately 86 to 76 °C when the caustic-ratio was increased from 0 to 12.6 mol%, and Tc2 showed a more extreme decrease from 102 to 83 °C. Therefore, the shallow endothermic peaks became smaller and their enthalpy (ΔH2) values decreased from 0.17 to 0.02 kJ/GR-mol (Fig. 1A and Table 1). When the cells were immediately cooled after the first DSC scan and subjected to rescanning, the endotherms of the starch−lipid complexes were observed again, but those corresponding to gelatinzation were not observed (Fig. 1B). This finding is similar to observation in a previous study on the gelatinization of rice starch without any additives.11) The endothermic temperatures in the second scan were slightly higher than those in the first scan (Figs. 1A and 1B, Table 1). Ts2, Tp2, and Tc2 (approximately 84, 95, and 104 °C, respectively) did not change significantly with the caustic-ratio and the enthalpy values were almost constant, at approximately 0.16 kJ/GR-mol.
The exothermic peak became larger and appeared at lower temperatures when the caustic-ratio was greater than 3.8 mol%, but Ts3 was observed at temperatures higher than 82.7 °C at all caustic-ratios examined in this study (up to 12.6 mol%). When maltose and potato soluble starch were used in place of the corn starch suspension at the same concentration of 25 wt% for comparison (Fig. 1A), their Ts3 appeared at low temperatures of 39.2 and 70.0 °C after the dissolution and gelatinization, respectively, at a causic-ratio of 10.9 mol%. In addition, the exothermic peaks were not observed in the second scan, as shown in Fig. 1B.
(2) Effects of urea.
DSC curves for corn starch suspension with added urea were measured at HR of 1.4−1.6 °C/min, where a heat flow in Fig. 1C was similar to that in Fig. 1A. With urea addition, melting endotherms for the starch−lipid complexes were also observed to follow the gelatinization endotherm. However, the exothermic peak observed with sodium hydroxide addition, was not observed with urea addition. The endothermic temperatures of the complexes gradually decreased as the urea-ratio increased, for example, Ts2 and Tc2 decreased from approximately 86 and 102 °C without urea to 72 and 96 °C at a urea-ratio of 140.6 mol%, respectively (Table 1). Compared with sodium hydroxide addition, Tc2 was higher with urea addition; thus, the endothermic enthalpies of the complexes were almost constant at approximately 0.15 kJ/GR-mol, irrespective of the urea-ratio.
Endotherms corresponding to the starch−lipid complexes were also detected by DSC rescanning (Fig. 1B). The endothermic temperatures, Ts2 and Tc2, were not significantly different from those in the first scan, but the enthalpy values were reduced by almost half to 0.08 kJ/GR-mol, which is different from the behavior observed with sodium hydroxide addition.
Main gelatinization endotherm of corn starch suspensions with added sodium hydroxide or urea.
The gelatinization temperatures (Ts1, Tp1, and Tc1) and the enthalpies of gelatinization (DSCΔH) measured at HR of 1.4–1.6 °C/min, were decreased by the additives (Figs. 1A, 1C, 2A, and 2B). With the addition of sodium hydroxide, however, these three temperatures and DSCΔH slightly increased at lower caustic-ratios (0.97–1.94 mol%), and subsequently decreased at higher ratios (Figs. 2A and 3A), as observed in our proceeding study.8) The gelatinization endothermic peaks became broader, shallower, and more asymmetric, which expanded the width of the gelatinization temperature (Ts-c1). These changes in the gelatinization endothermic curves were characterized by a considerable decrease of Ts1 from 57.4 to 36.4 °C as the caustic-ratio increased from 0.97 to 12.6 mol% (Figs. 1A and 2A). Figures 3A and 3B show DSCΔH measured at HR of 1.4–13.3 °C/min with the addition of various molar ratios of sodium hydroxide and urea. DSCΔH at an HR of 1.4 °C/min slightly increased at 0.97 mol%, and then gradually decreased to 85 % at 8.9 mol%, and 71 % at 12.6 mol%, taking DSCΔH at 0.97 mol% as 100 % (Fig. 3A).


On the other hand, the gelatinization endothermic peaks for urea addition shifted to the lower temperature region, decreasing Ts1, Tp1, and Tc1 practically in parallel with the increasing urea-ratio. Thus, Ts-c1 was almost constant over the urea-ratios tested, which was very different from the behavior with sodium hydroxide addition (Figs. 2A and 2B). The endothermic peak became gradually shallower, thus decreasing DSCΔH, while the peaks mostly maintained the original symmetrical shape, as observed in Fig. 1C. DSCΔH measured at an HR of 1.4 °C/min decreased almost linearly as the urea-ratio increased (Fig. 3B); for instance, taking DSCΔH without additive as 100 %, decreases to 87 and 69 % were observed at 31.2 and 93.7 mol%, respectively.
Comparison of DSCΔH with addition of sodium hydroxide and urea.
The addition of sodium hydroxide or urea decreased DSCΔH, although the effects of the two additives were very different (Figs. 3A and 3B). The slope for DSCΔH with sodium hydroxide addition (0.0685 kJ/mol%) was 9.4 times larger than that with urea addition (0.0073 kJ/mol%) at an HR 1.4 °C/min, indicating a large difference in the abilities of these additives to promote gelatininzaion. Therefore, to compare the thermodynamic effects of the two additives, we introduced the temperature corresponding to the half gelatinzation transition (Tm) as a parameter, at which DSCΔH is 50 %.
As shown in Fig. 2, Tp1 was not necessarily coincidental with Tm. The ratios of the gelatinization transition at Tp1 were not 50 %, but closer to 61 %, especially at high caustic-ratios (Fig. 2A). Conversely, those with urea addition were below 46 % (Fig. 2B). DSCΔH as a function of Tm on the absolute scale (K) at an HR 1.4 °C/min is presented in Fig. 3C. Tm and DSCΔH show a linear relationship and furthermore, the lines for the two additives almost overlap. This result indicates that DSCΔH for causitic soda and urea at the same Tm agree well quantitatively, despite the large difference in the molar ratios of the two additives (Figs. 3A and 3B) and in the gelatinization peak shapes (Figs. 1A and 1C).
Effects of HR on the exothermic peak and melting endotherm of starch−lipid complexes.
(1) Exotherm observed with sodium hydroxide addition.
Figure 4A shows DSC curves for sodium hydroxide addition measured at a higher HR of 10.1 °C/min, where the heat flow was converted to output in mW/g at an HR of 1.5 °C/min, similarly to Fig. 1. On increasing the HR from 1.6 to 10.1 °C/min, the exothermic peaks shifted to the higher temperature region and the difference between the peak top temperature of the gelatinization endotherm and that of the exotherm increased approximately 1.5 times (Figs. 1A and 4A). The shapes of the exothermic peaks became broader and slightly flatter, which also resulted in a greater than 1.5-fold expansion of the temperature width of the peaks (Ts-p3). In DSC measurements for reactions containing both endothermic and exothermic processes,13) the HR is sometimes increased to improve the separation of the two opposite processes and reduce the offset of their enthalpy values. In this study, increasing HR from 1.4 to 15.4 °C/min improved the separation between the gelatinization endotherm and the exotherm, but each absolute enthalpy value did not increase significantly (Figs. 1A and 4A, Table 1).

(2) Melting endotherm of starch−lipid complexes.
The endotherm of the starch−lipid complexes observed between the gelatinization endotherm and the exotherm for sodium hydroxide addition was shallow and not sharp, even at higher HR (Fig. 4A). Ts2, Tp2, and Tc2 in the first scan were shifted to a lower temperature region by increasing the caustic-ratio and to a higher region by increasing the HR (Figs. 1A and 4A, Table 1). On the other hand, in the second scan at the higher HR, Ts2 and Tp2 shifted slightly to higher temperatures, but an obvious shift was only observed for Tc2, resulting in an expansion of the temperature width, Ts-c2, compared with that in the first scan (Figs. 1B and 4B, Table 1). However, the endothermic enthalpy was not changed considerably by increasing HR from 1.4 to 15.4 °C/min or by increasing the caustic-ratio (Table 1).
With urea addition, Ts2, Tp2, and Tc2 were shifted to a somewhat higher temperature region by increasing HR and to a lower temperature region by increasing the urea-ratio (Figs. 1C and 4C, Table 1). As shown in Table 1, the endothermic enthalpies decreased as HR increased; 0.15, 0.09, and 0.06 kJ/GR-mol at HR of 1.4–5.3, 8.7–10.1, and 12.5–15.4 °C/min, respectively. The urea-ratio did not affect the endothermic enthalpies. Although not enough second scans were obtained for urea addition, no obvious differences were observed between the endothermic temperatures and Ts-c2 in the first and second scans; this differs from the behavior with sodium hydroxide addition (Figs. 1B and 4B, Table 1). The endothermic enthalpies for the second scan were smaller than those in the first scan and were almost constant (0.08 kJ/GR-mol), even when the urea-ratio and HR were varied.
Effects of HR on the main gelatinization endotherm.
(1) Sodium hydroxide addition.
The gelatinization temperatures of Ts1, Tp1, and Tc1 with addition of sodium hydroxide were compared at two HR, 1.4 and 13.3 °C/min (Figs. 2A and 2C). This approximately 9-fold increase in HR affected the three gelatinization temperatures as follows: Ts1, Tp1, and Tc1 were increased by 8.0, 7.3, and 12.6 °C without the additives, and by 12.0, 9.5, and 10.4 °C at a caustic-ratio of 12.6 mol%. At HR of 4.9−13.3 °C/min, similar to the trend observed at an HR of 1.4 °C/min, DSCΔH was slightly increased at caustic-ratios of 0.97−1.94 mol%, and then decreased almost linearly with further addition of sodium hydroxide (Fig. 3A). This trend coincides with the change in the three gelatinization temperatures described above. At an HR of 13.3 °C/min, DSCΔH first increased and then linearly decreased to 60 % at a caustic-ratio of 12.6 mol%, when DSCΔH at 0.97 mol%, the highest value, was taken as 100 %. With an increase of the HR from 1.4 to 13.3 °C/min, DSCΔH showed an almost parallel decrease over the caustic-ratios tested (Fig. 3A).
(2) Urea addition.
With urea addition at two HR (Figs. 2B and 2D), the three gelatinization temperatures decreased almost linearly as the urea-ratio increased, and increased as the HR increased. For instance, at the HR of 13.3 °C/min, Ts1, Tp1, and Tc1 increased by 9.8, 10.4, and 14.9 °C, respectively, at a urea-ratio of 93.7 mol%. As shown in Fig. 3B, DSCΔH decreased almost linearly with the urea-ratio within the HR range examined. For instance, at the HR of 13.3 °C/min, DSCΔH at a urea-ratio of 93.7 mol% decreased to 77 % of that in the absence of urea. The data shown in Fig. 3B also indicate that increasing the HR from 1.4 to 13.3 °C/min resulted in a decrease of DSCΔH. The slope of the DSCΔH decrease with urea-ratio was similar within the HR range of 4.9–13.3 °C/min, while it was slightly larger at an HR of 1.4 °C/min.
Apparent activation energy of starch gelatinization with sodium hydroxide or urea from the Ozawa equation.
Shiotsubo and Takahashi14) measured the apparent activation energy (ApEa) for the gelatinization of potato starch/water suspensions using DSC and quantitative differential thermal analysis (DTA). They suggested that the gelatinization of starch granules was a slow process occurring in a certain temperature range, which was distinguishable from the typical melting of crystals accompanying the isothermal transition state. In those studies,14)15) the activation energy (E) was obtained using DSC at an HR greater than 0.5 K/min from the following Kissinger equation (1):16)
d
{
ln
(
a
/
T
p
2
)
}
/
d
(
1
/
T
p
)
=
−
E
/
R
(1)
Where a and R represent HR and the gas constant, respectively, and Tp is the absolute temperature (K) of the gelatinization endothermic peak (Tp1). In this equation, E is calculated from the slope (E/R) of the plot of ln{a/(Tp1)2} against 1/(Tp1).
The thus-obtained E value (289 kJ/GR-mol) was much larger than that estimated using isothermal methods (92 kJ/GR-mol).17)18) E calculated from DSC measurements at high HR may be an apparent value. In the actual production of corrugated paperboard, however, the gelatinization of starch in the adhesives proceeds extremely fast. Alternatively in this study, ApEa of gelatinization was estimated from the following Ozawa equation (2)19) to research into the characteristics of fast gelatinization:
-
log a
-
0.4567
E
/
RT
=
constant
(2)
Where a and T represent HR and the absolute temperature (K) corresponding to each ratio (5–70 %) of the gelatinization transition at each HR (1.4, 4.9, 9.5, and 13.3 °C/min), respectively. In equation (2), E is calculated from the slope (0.4567E/RT) of the plot of log a against 1/T.
In the Kissinger equation (1), Tp1 and HR (a) were used to calculate E. However, as shown in Fig. 2, the ratio of the gelatinization transition at Tp1 was affected by the caustic- and urea-ratios and by HR, and thus Tp1 did not necessarily correspond to the temperature for the 50 % gelatinization transition based on DSCΔH. On the other hand, the Ozawa equation (2) employed T (K) of a specific temperature corresponding to a ratio of the gelatinization transition based on DSCΔH and HR. The ApEa values estimated using the Ozawa equation (2) at various caustic- and urea-ratios are shown in Figs. 5A and 5B, respectively. The thus-obtained ApEa values were larger than those reported for the gelatinization of potato starch (92 kJ/GR-mol) using isothermal methods.17)18) ApEa increased slightly from 261 kJ/GR-mol with no additives to 276 kJ/GR-mol at a caustic-ratio of 0.97 mol%, and then decreased almost linearly to 173 kJ/GR-mol at a caustic-ratio of 12.6 mol% (Fig. 5A). With urea addition, ApEa linearly decreased to 183 kJ/GR-mol at a urea-ratio of 93.7 mol% (Fig. 5B). Thus, ApEa obtained from DSC at a fast HR decreased almost proportionally with caustic-ratios greater than 0.97 mol% and with urea-ratios over the entire range.

When ApEa was substituted for the activation energy (E) in the following Arrhenius equation (3), it was found that the gelatinization rate constant (k) increased as ApEa decreased. As a result, the gelatinization rate constant (k) increased as the caustic- or urea-ratios increased:
k
=
Ae
-E/RT
(3)
In this equation, A, k, and R represent the frequency factor, the reaction rate constant, and the gas constant, respectively.
The decrease in ApEa per unit of the caustic-ratio {8.67 kJ/(mol・mol% of the caustic-ratio)} was 10.2 times larger than that of the urea-ratio {0.85 kJ/(mol・mol% of the urea-ratio)}. However, when ApEa was expressed as a function of Tm in the absolute temperature scale (Fig. 5C), ApEa in the presence of both additives linearly decreased with decreasing Tm. Moreover, the lines for the two additives were similar: ApEa/Tm values were 8.16 and 7.30 kJ/(mol・K) for sodium hydroxide and urea, respectively.
van’t Hoff enthalpy change (ΔHvHº) of starch gelatinization with added sodium hydroxide or urea.
On the assumption that starch gelatinization proceeds via a simple two-state equilibrium between the ungelatinized and the gelatinized starch, the equilibrium constant (K) for the gelatinization is represented by Equation (4). The van’t Hoff enthalpy change (ΔHvHº) was derived from Equation (6),14)17)20) in which f/(100 − f) was substituted for the equilibrium constant (K) in the well-known van’t Hoff relation (5) under a fixed pressure:
K
=
f
/
(
100
−
f
)
(4)
d
ln
K
/
d
T
=
ΔH
vH
°
/
RT
2
(5)
d
ln
{
f
/
(
100
−
f
)
}
/
d
T
=
ΔH
vH
°
/
RT
2
(6)
Where f and (100 − f) represent the ratio (%) of the gelatinized starch to total starch, that is the ratio (%) of the gelatinization transition, and the ratio (%) of the ungelatinized starch, respectively. T represents the absolute temperature corresponding to each ratio (f = 5–95 %) of the gelatinization transition. ΔHvHº was obtained from the slope (ΔHvHº/R) of the van’t Hoff plot [ln{f/(100 − f)} vs. 1/T].
Figure 6A shows ΔHvHº as a function of the caustic-ratio measured at an HR of 1.4 °C/min. ΔHvHº was 484 kJ/mol with no additives, 482 kJ/mol at a caustic-ratio of 0.97 mol%, and then decreased almost linearly to 200 kJ/mol at a caustic-ratio of 12.6 mol%. Using the van’t Hoff relation (5), ΔHvHº is obtained as an enthalpy change per one mole of a concerned molecule during the transition process. ΔHvHº/DSCΔH, which is the ratio of the van’t Hoff enthalpy change to the calorimetrically determined enthalpy, is known to give the size of the “transition cooperative unit”14)15)20) according to the basic thermodynamic relationship. The size of the tramsition cooperative unit represents the molecular size which behaves as if one molecule during the transition process. Therefore, in starch gelatinization, the size of the gelatinizing cooperative unit, i.e. ΔHvHº (kJ/mol) /DSCΔH (kJ/GR-mol), can be expressed as the numbers of GR per mole. As shown in Fig. 7A, ΔHvHº/DSCΔH without additives corresponds to 211 GRs, which significantly decreases to 108 GRs at a caustic-ratio of 12.6 mol%. For urea addition at an HR of 1.4 °C/min, ΔHvHº gradually decreased from 484 to 416 kJ/mol as the urea-ratio increased from 0 to 93.7 mol% (Fig. 6B), but DSCΔH decreased more considerably (Fig. 3B). As a result (Fig. 7B), ΔHvHº/DSCΔH showed an increase from 211 GRs with no additives to 265 GRs with a urea-ratio of 93.7 mol%, which is in sharp contrast to the trend observed for sodium hydroxide addition.
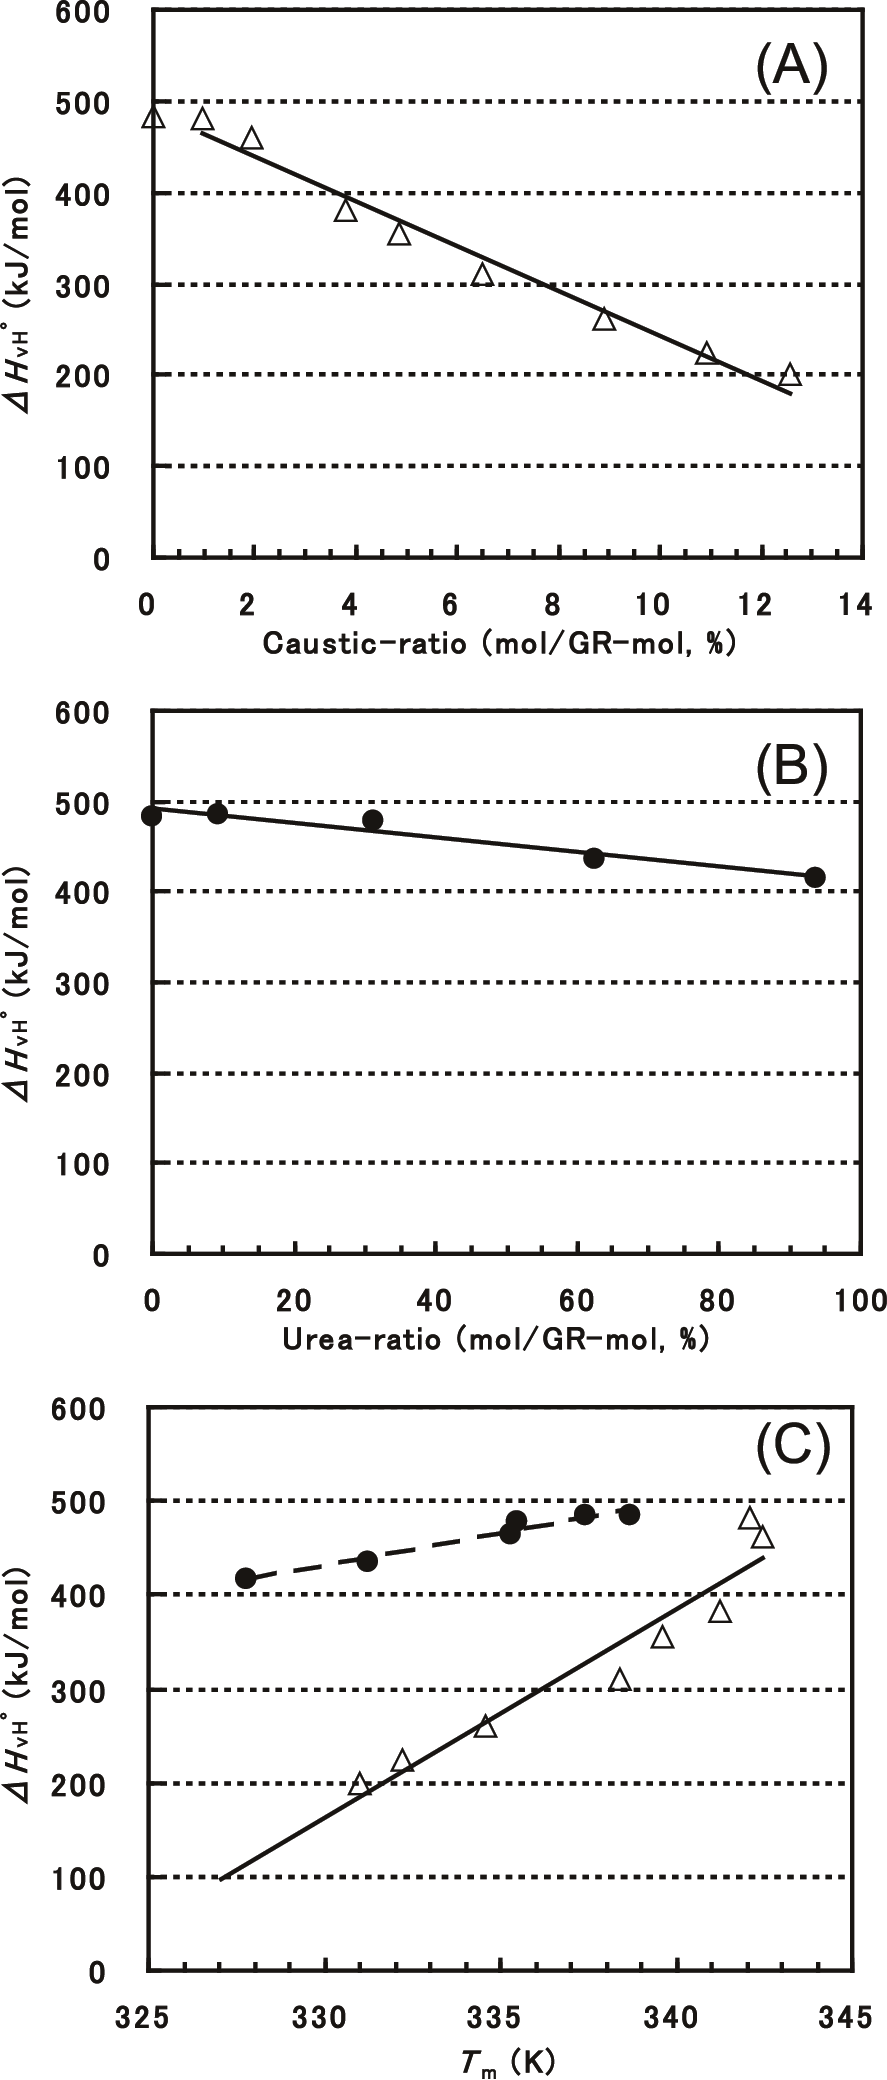
As shown in Figs. 6A and 6B, ΔHvHº decreased more significantly with sodium hydroxide addition than with urea addition, with a 31-fold larger decrease observed for the caustic-ratio. As shown in Fig. 6C, ΔHvHº linearly decreased with decreasing Tm, irrespective of sodium hydroxide or urea addition. The relations of DSCΔH with Tm (Fig. 3C) and of ApEa with Tm (Fig. 5C) agreed well quantitatively for the two additives, whereas that of ΔHvHº with Tm differed for them (Fig. 6C), with a 3-fold larger slope for sodium hydroxide addition. Consequently, opposite trends in ΔHvHº/DSCΔH as a function of Tm were observed for the two additives (Fig. 7C). As Tm decreased, ΔHvHº/DSCΔH decreased with sodium hydroxide addition, whereas the ratio increased with urea addition.
DISCUSSION
In the DSC curves for the gelatinization of corn starch suspensions with added sodium hydroxide or urea, three or two thermal peaks were observed with heating: the gelatinization endotherm, the melting endotherm of starch−lipid complexes, and an exotherm, which was only observed at caustic-ratios of more than 3.8 mol% and was not observed by immediate rescanning. In the gelatinization of rice starch without any additives, rescanning was reported to show again the endotherm attributed to the melting of amylose−lipid complexes.11) In this study, a similar endotherm was observed to appear again in the second scan with the addition of sodium hydroxide or urea, which suggested that starch−lipid complexes formed, even in the presence of the two additives. However, with addition of sodium hydroxide, the endothermic enthalpies and Ts-c2 were partly offset by the subsequent large exothermic peak in the first scan, and thus, these values were slightly larger in the second scan due to the absence of the exothermic peak (Table 1, Figs. 1, and 4). In addition, the shallow endothermic peak in the second scan did not shift to much higher temperatures when the HR was increased, suggesting that the melting of the complexes is a relatively rapid process (Figs. 1B and 4B).
The exothermic peaks of corn starch suspensions with added sodium hydroxide were become larger by increasing the caustic-ratio, and were shifted to considerably higher temperatures by increasing the HR (Figs. 1A and 4A), suggesting that the corresponding process is slow. Though, Ts3 of the corn suspensions appeared at temperatures higher than 82.7 °C at caustic-ratios up to 12.6 mol%, Ts3 of maltose and potato soluble starch used for comparison which were solubilized and gelatinized at lower temperatures, appeared at 39 and 70 °C at a caustic-ratio of 10.9 mol%, respectively (Fig. 1A). Furthermore, no such exotherm was observed in the corn starch suspensions before gelatinization (Fig. 1A). Moreover, the exothermic peak did not appear with addition of urea or at caustic-ratios up to 0.97 mol%. Thus the exothermic reaction was considered to occure for the gelatinized starch with added sodium hydroxide and to be not necessary specific higher temperatures. This exotherm could to be attributed to alkali-decomposition of the gelatinized starch. The exothermic heats of α-1,4 glucosidic linkages in maltose and amylose (approximate 6,000 GRs) are 4.6121) and 4.32 kJ/mol,22) respectively, in glucoamylase-catalyzed hydrolysis at 25 °C. In this study, the exothermic enthalpy (ΔH3) values of soluble starch and corn starch, measured at an HR of 1.6 °C/min, were 6.45 and 6.53 kJ/GR-mol, respectively, at a caustic-ratio of 10.9 mol%. Similarly, using the value in Table 1, the enthalpy value for maltose was calculated to be 6.76 kJ/mol. Unexpectedly, the enthalpy values for maltose, soluble starch, and corn starch are in good agreement. Therefore, these enthalpies are suspected to be mainly associated with breakage of α-1,4 glucosidic linkages during alkali-decomposition. However, the complete decomposition of starch and maltose into glucose was hard assumed. In fact, the endotherms attributable to the starch−lipid complexes were still observed in the second scan. During adhesion on the corrugator, the gelatinization of the starch adhesives is conducted in open air under atmospheric pressure, and thus at temperatures below 100 °C due to the evaporation of water solvent. Therefore, the exothermic reaction observed at 82–155 °C in the DSC measurements was considered unlikely to proceed to any significant extent in corrugating adhesives with caustic-ratios lower than 12.6 mol%.
For the gelatinization endotherm, which is the most important event in view of adhension, Ts1, Tp1, Tc1, DSCΔH, and ApEa increased somewhat at caustic-ratios of 0.97−1.94 mol%, and subsequently decreased as the caustic- and urea-ratios increased (Figs 2A, 2C, 3A, 3B, 5A, and 5B). In our previous paper,5) acceleration of the gelatinization rate by sodium hydroxide was investigated qualitatively with scanning electron microscopy. The starch granules in the adhesion samples laminated with the corrugating starch adhesives gradually swelled, giving unclear shapes and beginning to fuse as the caustic-ratio increased. In the present report, ApEa obtained using the Ozawa equation decreased almost linearly as the caustic- or urea-ratios increased (Figs. 5A and 5B). The gelatinization rate constants (k) obtained from these ApEa values using the Arrhenius equation also increased quantitatively as the amounts of the two additives increased.
The effectiveness of sodium hydroxide and urea for decreasing ApEa and DSCΔH were very different (Figs. 3A, 3B, 5A, and 5B). However, when samples with the same Tm were compared, the two additives gave almost same ApEa (Fig. 5C) and DSCΔH (Fig. 3C) values. We therefore deduced that the additives stimulated the gelatinization by similar mechanisms, which mainly involved breaking the intermolecular hydrogen bonds in the crystalline regions of starch.
In this study, we inferred that the small increases of the gelatinization temperature and enthalpy at low caustic-ratios were attributable to an increase in the intermolecular hydrogen bond strength23) and/or the crystallinity24)25) of starch. Similar increases in crystallinity due to realignment of polymer molecules have often been observed for various polymers, including starch, with the addition of plasticizers and heat treatment.11)26)27)28)29)30)31) However, this effect was not observed with urea addition (Figs. 2B, 2D, 3B, and 5B). Therefore, sodium hydroxide was considered to promote realignment of the starch molecules in the granules as a plasticizer, even at low temperatures (30 °C) during preincubation. Furthermore, our previous study5) showed that sodium hydroxide increased the fluidities (at 85 °C) of gelatinized corn starch suspensions and SH-type corrugating adhesives. On the other hand, Sasaki et al.10) reported that urea was not effective enough for solubilization of swollen granules in gelatinized sweet potato starch. Moreover, Biliaderis et al.11) proposed a three-phase model for gelatinization comprising starch crystallites phase, a bulk amorphous phase, and an intercrystalline amorphous phase to account for the thermal behavior of granular starch. Water acts as a plasticizer for the amorphous parts of the granules. Such preceeding relaxation of the amorphous parts induces crystallite melting to commence at lower temperatures. Suzuki et al.23) also reported that the gelatinization behavior was controlled by the non-crystalline domains. Though the water content of starch in this study differed from that in these previous reports, we considered that sodium hydroxide had the ability to solubilize and plasticize starch molecules in the amorphous parts, in addition to promoting scission of hydrogen bonds in the crystalline region, during gelatinization. These abilities may expand the weakly bonding regions that can be gelatinized at lower temperatures, reduce Ts significantly, and consequently expand Ts-c1. The expansion of
Ts-c1 by sodium hydroxide is indispensable for the preparation of corrugating starch adhesives.7)8) The resulting reduction in ΔHvHº decreased ΔHvHº/DSCΔH, the size of the gelatinizing cooperative unit, from approximately 34,000 to 17,500 Da at a caustic-ratio of 12.6 mol% (Figs. 6A and 7A). In contrast, Ts-c1 did not expand with urea addition, although ApEa, DSCΔH, and the gelatinization temperatures decreased (Figs. 2A, 2B, 3A, 3B, 5A, and 5B). The inferior ability of urea for solubilizing starch and its larger molecular size may restrict the loosening of weakly bonding regions and reduction of the gelatinizing cooperative unit size. Therefore, as Tm decreased, the unit size decreased more with addition of sodium hydroxide than with urea (Fig. 7C). In summary, we found that sodium hydroxide had greater abilities for solubilizing and plasticizing starch molecules, which facilitated not only the cleavage of intermolecular hydrogen bonds, but also the mobility of starch molecules during gelatinizaiton.

