Research Report
What Makes Conditional Automation Drivers Decide to Intervene?
― A Driving Simulation with Expert Participants on Urban Streets ―
2024 Volume 2024 Issue 12 Article ID: JRJ20241202
Details
2024 Volume 2024 Issue 12 Article ID: JRJ20241202
As the deployment of conditional Automated Driving Systems (ADS) becomes increasingly prevalent, particularly in urban settings, there is a potential that users may not comply with the system's behavior and may manually override it based on their own judgment, even without a Request to Intervene (RtI) from the system. Such driver-initiated interventions could pose a risk to the safety of automated driving. This study simulated a scenario where a conditionally automated vehicle overtook a parked vehicle on a two-lane street with oncoming traffic to examine the circumstances surrounding driver-initiated interventions. The results revealed that all instances of manual override were executed by pressing the brake pedal and seizing the steering wheel while the automated vehicle was approaching the parked vehicle in close proximity to the oncoming traffic traveling in the opposite direction. Out of the 23 participants, 12 expressed confidence in the system's decision-making and performance, 9 felt generally safe but experienced specific apprehensions and discomfort about the system's operation, and 2 expressed concerns about safety issues related to the system's perception and proximity to surrounding vehicles. These findings offer valuable insights into the factors and patterns of driver intervention and can inform the design of ADS.
条件付きの「自動運転システム」が特に都市環境において普及することが想定される.このようなシステムの場合,システムからの介入要請がなくても,ドライバがシステムに従わず,自らの判断で上書き(オーバーライド)する可能性がある.このようなドライバ主導の介入は,自動運転の安全性にリスクをもたらす可能性がある.本研究では,対向車線のある2車線道路で,条件付き自動運転車が駐車車両を追い越すというシナリオをシミュレートし,ドライバ主導の介入の状況を調べた.その結果,ドライバによるオーバーライドは,自動運転車が対向車と駐車車両の双方に接近している間に,ブレーキペダルを踏んだりハンドルを握ったりすることによって実行されることが明らかになった.23人の参加者のうち,12人はシステムによる意思決定と操作に信頼を示し,9人はおおむね安全だと感じつつもシステムの操作について特定の不安感や不快感を覚え,2人はシステムの認識と周辺車両との接近に関連する安全上の懸念を示した.これらの知見は,ドライバの介入の要因とパターンに関する貴重な知見を提供し,自動運転システムの設計に役立てることができる.
1. Introduction
Automated driving systems (ADS) have garnered significant attention owing to their potential to revolutionize transportation by improving safety, efficiency, and accessibility. As these systems evolve, it is crucial to understand human-automation interactions in complex and dynamic scenarios1). This study contributes to this understanding by investigating the effects of surrounding traffic on driver interactions with conditional automation (Level-3 automated driving) for different overtaking maneuvers on a two-lane, undivided street. The focus is on Level-3 automated driving, where the system can handle specific driving tasks without human monitoring, but requires human intervention in certain situations, particularly when the system issues a Request-to-Intervene (RtI) 2).
Allowing users of conditional automation to disengage from the primary driving task presents unique challenges related to the RtI protocols3). Drivers may struggle to regain situational awareness and take control promptly, particularly if the system unexpectedly requests intervention or in critical situations4). On one hand, time constraints coupled with the need to comprehend the situation and take appropriate action can introduce cognitive overload and increase the risk of errors5). On the other hand, drivers’ trust in ADS may be undermined if they experience frequent or untimely RtI requests, impacting the overall system reliability and human acceptance of the technology6). While addressing these issues is crucial for enhancing the safety, usability, and acceptance of ADS, understanding driver interventions in automated driving, even without system prompts, is crucial for optimizing human-automation interactions7).
Studies have indicated that driver trust in ADS can fluctuate based on system performance and prior experience 8). Over time, drivers may develop trust in automation, leading to reduced vigilance9). However, when faced with uncertain or risky situations, they may intervene to maintain their sense of control and mitigate perceived risks. Loss of situational awareness or perceived loss of control can trigger driver intervention in ADS10). Factors such as unexpected system behaviors or environmental uncertainties can prompt drivers to intervene, reflecting their desire to reassert their role in driving tasks11). In addition, individual traits, such as preference for control or propensity for complacency, play a significant role in intervention decisions12). Drivers’ over-trust in automation or sense of complacency can lead to interventions as a means of maintaining a perceived level of safety and control13).
Instances of system errors, malfunctions, or perceived unreliability can trigger proactive interventions from drivers 14). Ensuring safety and preventing accidents in the face of automation failures or uncertainties can motivate drivers to take over driving tasks15). Legal and ethical concerns surrounding ADS usage can also influence drivers’ intervention behaviors16). Compliance with regulations mandating human oversight in certain driving contexts, or ethical dilemmas regarding automation decision-making, may prompt interventions even without direct system requests17).
Poor communication between the ADS and driver regarding system limitations and RtI can hinder effective human-automation collaboration18). Inadequate feedback mechanisms or the vehicle’s unclear signaling of system limitations may impede drivers’ understanding of when and why interventions are required19). The transition point between automated and manual driving modes may be unclear, leading to challenges in determining when and how drivers should intervene20). These challenges become particularly pronounced during role transitions between humans and automated controls, where mismatches in perception, expectations, and system behavior can compromise safety 21).
Moreover, the potential for drivers to intervene in controlling the vehicle, even when the system deems a maneuver safe22), raises questions about the extent to which human perception conflicts with ADS actions. This highlights the need for investigations into the subjective assessments of the system under potentially hazardous scenarios. These investigations were guided by the following three research questions.
(1) Why do drivers intervene in automated driving without an RtI?
(2) How do drivers’ overtaking behaviors compare with those of ADS in the same traffic situations?
(3) To what extent does the mismatch between driver perception and ADS action impact subjective assessments of the system?
This study aimed to address these questions by conducting a driving simulation experiment, exploring human-automation interactions in scenarios where human intervention is not required. The experiment involved participants with academic and professional backgrounds in related fields. The investigated scenarios simulated a conditionally automated vehicle approaching a stopped vehicle, blocking its driving lane on a two-lane, undivided city road. The ADS demonstrated different overtaking behaviors depending on the surrounding traffic conditions, particularly the overtaking gap in the opposing lane. This study investigated the impact of ADS behavior and surrounding traffic on driver perception, expectations, and motivation to override automation. Participant feedback is expected to provide nuanced insights into the design and deployment of automated vehicles in real-world scenarios.
2. Method
2. 1 Driving Simulation Experiment
The experiment involved 23 participants (one female; Meanage= 41.47; STDEVage= 10.99), all of whom were researchers at Japan Automobile Research Institute (JARI). The inclusion criteria were a minimum of five years of driving experience and three years of research experience in automotive engineering, human factors, psychology, or related fields. This background ensures a sophisticated understanding of the technical and human-centric aspects of automated driving. The study adhered to ethical guidelines and the participants provided informed consent before participating. Confidence in participant data was maintained throughout the study, and any identifiable information was anonymized during data analysis and reporting.
The experiment was conducted using JARI’s driving simulator equipped with high-fidelity graphics, motion simulations, and a comprehensive set of vehicle controls (Fig. 1). The simulator provided a realistic virtual environment for participants to experience various driving scenarios using a 360-degree projected field of view. The participants and experimental situation were monitored by two experimenters from a separate control room. During the experiment, communication between the participants and experimenters was maintained using microphones and speakers. The experimental data were recorded at 60 Hz.
In this experiment, we implemented conditional driving automation on an urban (residential) roadway with two opposing lanes separated by a white dotted lane. Automated driving could be activated and deactivated using a button attached to the right side of the steering wheel (see the bottom right part of Fig. 1). The status of the system and surrounding traffic were displayed via a human-machine interface (HMI) on the dashboard (see the bottom left part of Fig.1). When the HMI changes from manual driving mode to automated driving mode, drivers can relax and enjoy any activity they like to do, except leaving the driver’s seat, unbuckling the seatbelt, or falling asleep. The automated driving mode can also be deactivated when the driver rotates the steering wheel or pushes the brake or gas pedals.

Fig. 1 Top left: structure of the driving simulator. Top right: simulator’s interior. Bottom left: HMI screen used to display the status of the system and the surrounding environment. Bottom right: red circled button used to activate and deactivate automated driving mode.
2. 2 Experimental Scenarios
The driving environment simulates a residential area with a straight roadway containing two lanes (Lane-1, Lane-2) with opposite directions of travel separated by a white dotted lane marks, as shown in Fig. 2. All drives were conducted in daylight with clear weather and visibility conditions at a maximum speed limit of up to 40 km/h. The scenarios started with a conditionally automated vehicle (AV) traveling at 40 km/h in Lane-1 in the presence or absence of a leading vehicle (LV), and with other oncoming vehicles (OV) traveling in the opposite direction in Lane-2. Participants had to start the AV manually, shift the gear to drive, and press the system activation button while releasing their hands and feet. When the HMI changes from manual driving mode (HMI-1 in Fig. 2) to automated driving mode (HMI-2 in Fig. 2), drivers can practice hands, feet, and eyes-free driving. The HMI continuously shows changes in the surrounding traffic conditions, such as the existence of a leading vehicle or passing and approaching oncoming vehicles (HMI-3 in Fig. 2). When the AV approaches a stopped vehicle (SV) blocking Lane-1 (HMI-4 in Fig. 2), the system decelerates to check the safety and availability of Lane-2 to perform an overtaking maneuver. If there is no OV in Lane-2, the AV changes lanes to overtake the SV without the need to make a full stop (HMI-5 in Fig. 2). However, if there are one or more OVs, the AV makes a full stop until Lane-2 becomes clear in order to perform the overtaking maneuver.
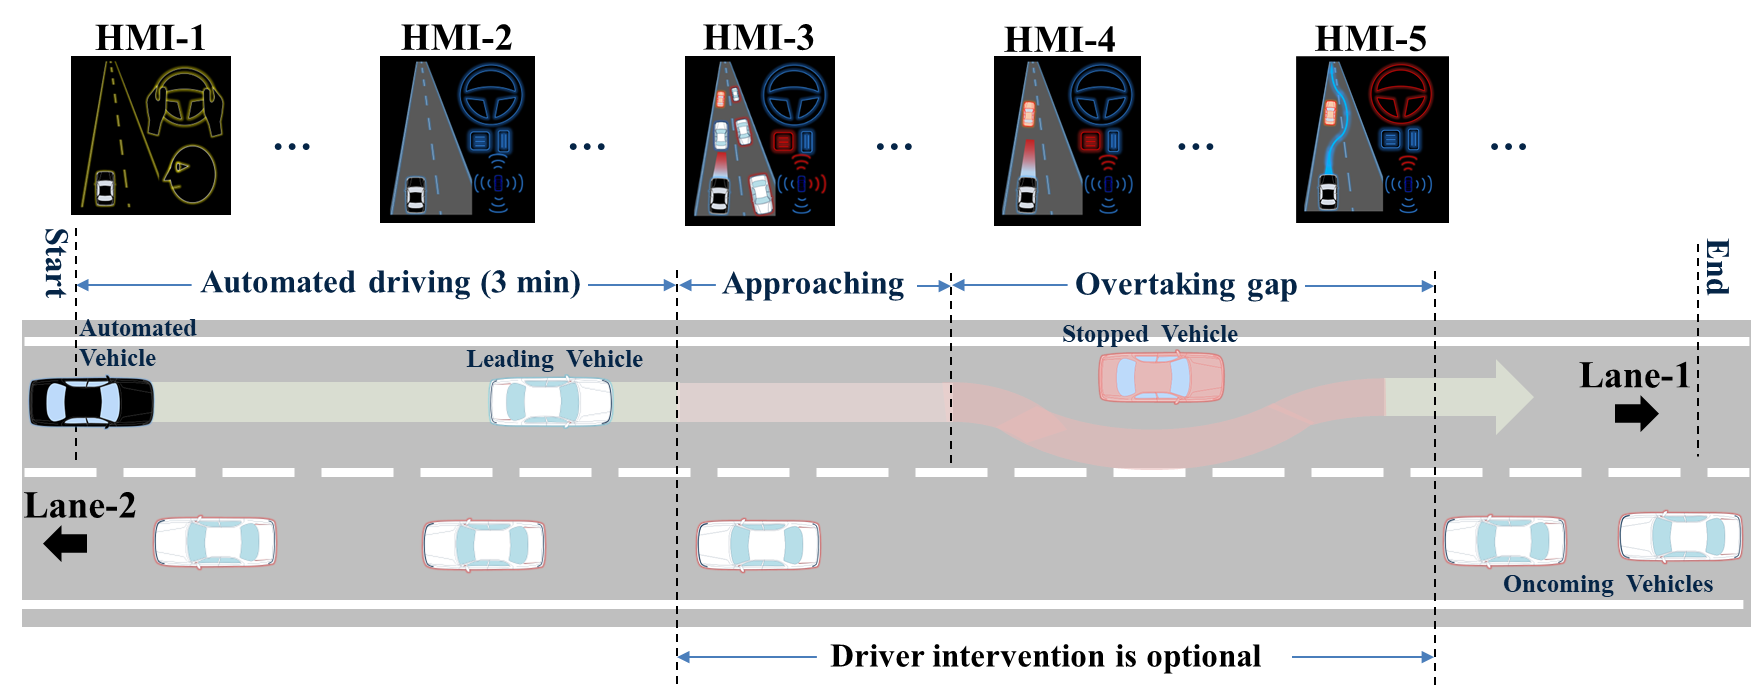
Fig. 2 The investigated scenarios and samples of HMIs are displayed to the driver during manual and automated driving. Lane-1 and Lane-2 represent opposite directions of the roadway. An automated vehicle travels at 40 km/h in Lane-1. Oncoming vehicles pass at 40 km/h in Lane-2. A stopped vehicle is blocking Lane-1 entirely or partially. A leading vehicle may or may not exist in front of the automated vehicle.
The lateral position of the SV differed between the scenarios. The SV can be stopped at the center of Lane-1, leaving a tight clearance space to the right or slightly to the left of Lane-1, such that the SV blocks half of Lane-1 leaving a wider space to the right. The AV overtaking decision was based on the available longitudinal clearance distance in the opposite lane (the overtaking gap), disregarding the lateral position of the SV. For the LV, as a manually driven car, the overtaking decision was made based on the lateral position of the SV and the longitudinal clearance distance in Lane-2. For example, if the SV is stopped at the center of Lane-1 with an insufficient overtaking gap in Lane-2, both the AV and LV stop behind the SV until a sufficient gap becomes available, whereas if the SV is stopped on the left side of Lane-1 with a wider space to the opposite traffic, the LV may overtake the SV without a full stop using the lateral space between the SV and the oncoming traffic, disregarding the overtaking gap. However, the AV, as a system-driven car, may not overtake the SV by driving close to the oncoming traffic, as the system considers it a dangerous maneuver, and hence, it cannot be performed under the automated driving mode.
The participants were informed that while alerts and RtI are expected in conditional automation, the current system would not issue an RtI throughout all scenarios; therefore, the participants had the option to continue automated driving unless they felt the need to intervene for safety reasons or disagreed with the system’s decision and behavior. This was because the system was designed to handle all scenarios, even if the participants did not intervene. However, the participants were not informed of this.
2. 3 Experimental Design
This study employed a 2 × 2 × 3 within-subject factorial design, utilizing three independent variables to generate 12 distinct scenarios, as shown in Fig. 3. The three independent variables under investigation were the lateral position of the stationary vehicle (two levels), presence of a leading vehicle (two levels), and availability of an overtaking gap in the opposing lane (three levels). The lateral position of the SV and availability of an overtaking gap were set to investigate the effects of space and time constraints on driver responses. However, the reason for setting the presence and absence of an LV was to investigate the effects of other drivers’ behavior on participants' perceptions, expectations, acceptance, and willingness to intervene.
The SV was positioned either at the center of the lane, fully obstructing the path of the AV, or slightly to the left of the center lane, partially obstructing the path of the AV. In both scenarios, the AV was required to deviate its course towards the opposing lane to overtake the stationary vehicle, irrespective of the presence or absence of an LV.
The AV’s overtaking behavior varied depending on the available overtaking gap in the opposing lane, which was categorized based on the time headway (THW) between consecutive OVs. If the AV deemed this gap sufficient to execute a full overtaking maneuver at a speed of less than 20 km/h, the system performed a flying overtaking without necessitating a full stop before the SV. This type of overtaking was referred to as a one-step overtaking maneuver. However, if the AV considered this gap insufficient for a full overtaking maneuver, the system opted to wait behind the SV until an appropriate overtaking gap materialized. Once a sufficient gap in the oncoming lane was identified, the system accelerated to overtake SV. This type of overtaking was referred to as a two-step overtaking maneuver. The categories and their corresponding overtaking maneuvers (one-step or two-step overtaking) are as follows:

Fig. 3 The 12 investigated scenarios. The AV performs one-step overtaking in Scenarios (1, 4, 7, and 10) and two-step overtaking in Scenarios (2, 3, 5, 6, 8, 9, 11, and 12). The LV performs one-step overtaking in Scenarios (4, 6, 10, 11, and 12) and two-step overtaking only in Scenario 5.
No oncoming vehicles: The THW between consecutive OVs was measured at 36 s, providing an overtaking gap of approximately 400 m (Scenarios 1, 4, 7, and 10 in Fig.3). The AV deemed this gap sufficient to execute one-step overtaking at a speed of less than 20 km/h, without necessitating a full stop before the SV.
Near-oncoming vehicles: The THW between consecutive OVs was measured at 3 s, providing an overtaking gap of approximately 33 m (Scenarios 2, 5, 8, and 11 in Fig.3). The AV considered this gap insufficient for one-step overtaking; thus, the system opted to wait behind the SV until an appropriate overtaking gap materialized. Once a sufficient gap in the oncoming traffic was identified, the system accelerated and overtook the SV.
Far-oncoming vehicle: The THW between consecutive OVs was measured at 24 s, providing an overtaking gap of approximately 266 m (Scenarios 3, 6, 9, and 12 in Fig.3). The AV deemed this gap insufficient for one-step overtaking unless the system maintained its speed at 40 km/h throughout the overtaking maneuver, which could potentially be hazardous. Consequently, the AV performed a two-step overtaking process.
For the LV, as a manually driven car, the overtaking decision was made based on the lateral position of the SV in addition to the overtaking distance in the opposing lane. In Scenarios 4 and 10, the LV overtook the SV at 40 km/h without deceleration, because there was no OV in the opposing lane. In Scenario 5, the LV stopped behind the SV because of the near-passing OVs. In Scenarios 6 and 12, the LV overtook the SV at 40 km/h to avoid a far-approaching OV. However, in Scenario 11, where the SV was located on the left of the lane center, the LV decelerated to 20 km/h and overtook the SV using the lateral gap between the SV and OVs. The overtaking behavior of the LV in Scenarios 6, 11, and 12 is considered risky by the system; therefore, the AV may not follow the LV’s behavior in these scenarios.
2. 4 Procedure
Upon arrival, all participants signed an informed consent form and were briefed on the study objectives, procedures, and safety measures before the driving experiment. Each participant underwent two familiarization sessions (10 min each) with the driving simulator to ensure that they were comfortable with the simulator controls and environment as well as with the activation and deactivation of the conditional driving mode. To introduce the participants to autonomous overtaking, their vehicles approached a blocked lane with traffic cones. Accordingly, the system decelerated and overtook the traffic cones using the opposing lane.
The 12 testing scenarios were presented in a randomized order to minimize potential order effects. After each scenario, participants were required to answer Likert-scale and open-ended questions to assess their subjective experiences, perceptions, expectations, and feelings of safety, contributing to a comprehensive evaluation of driver interactions with conditional automation in the given scenarios.
The participants were given a 10-minute rest after completing six of the 12 scenarios. The total duration of the experiment was two hours per participant. Throughout the experiment, participants were informed that the system would not issue an RtI; therefore, they had the option to continue automated driving unless they felt the need to intervene for safety or preference reasons.
2. 5 Data Analysis
A power analysis was conducted to determine the sample size required to detect any significant effects. Accordingly, a selected sample size of 23 expert participants was deemed sufficient (non-centrality parameter λ= 8.40, critical F-test = 2.11, numerator df = 3, denominator df = 30, and actual power = 0.80). Quantitative data obtained from the driving simulator, including driving behavior metrics and driving performance measures, were analyzed using statistical methods. Descriptive statistics and inferential analyses, such as t-tests and ANOVA, were employed to compare conditions and assess significant differences. Likert-scale questionnaires were analyzed using the rank-sum method. Qualitative data from the open-ended questions were analyzed thematically using Atlas.ti (version 22.0.2) to identify recurring patterns and themes related to driver perceptions and experiences during the simulated scenarios.
3. Results
3. 1 Objective Data
Table 1 details the number of system disengagements due to driver interventions, which also represents the number of manual overtaking maneuvers categorized by the three experimental conditions. Of the 276 overtaking events, 219 were performed by the system and 57 were performed by the participants who intervened. Among the 12 scenarios, the minimum number of driver interventions was 1/23 (scenarios 4 and 7) and the maximum number was 9/23 (scenarios 3 and 9). In terms of the SV’s lateral position, there were 30 driver interventions when the SV was in the center of the lane, and 27 driver interventions when the SV was located to the left of the lane center. There were 31 driver interventions when there was no LV, compared to 26 interventions that occurred when the AV was following an LV.
More takeovers occurred during two-step overtaking scenarios than during one-step overtaking scenarios. Such a difference can be attributed to drivers’ safety concerns owing to approaching OVs in the opposing lane. Drivers tended to override the system more when there was a distant OV than when there were nearby OVs. They expressed concerns regarding the system’s ability to detect distant OVs.
Table 1 Number of driver interventions categorized by driving conditions (stopped vehicle position, existence of a leading vehicle, and overtaking gap)
| SV Position | No LV | LV | Total | ||||
|---|---|---|---|---|---|---|---|
| No OV | Near OV | Far OV | No OV | Near OV | Far OV | ||
| Center | 3/23 | 6/23 | 9/23 | 1/23 | 3/23 | 8/23 | 30/138 |
| Left | 1/23 | 3/23 | 9/23 | 3/23 | 3/23 | 8/23 | 27/138 |
| Total | 31/138 | 26/138 | 57/276 | ||||
The behavior of AVs during an overtaking event can be delineated into four discrete stages: approaching the SV, changing lanes toward the opposing lane, passing the SV, and returning to the original lane. More than half of the driver interventions occurred during the approaching stage. Specifically, 32% of the interventions occurred when the AV veered into the opposing lane, 5% during the passage through the opposing lane, and 12% during the return to the original lane. These intervention patterns indicated diverse individual perceptions and preferences in comparable situations. For instance, some drivers intervened because they perceived a considerable longitudinal gap between the AV and SV during the approaching stage, whereas others intervened because they perceived the distance as too close.
Fig. 4. presents the average time taken by the driver and system to complete an overtaking maneuver starting from the point where the vehicle started deviating toward the opposing lane, intending to overtake the SV to the point where the vehicle returned to its original lane and started traveling straight forward. The data indicate that drivers completed the overtaking maneuvers faster than the ADS. However, the analysis revealed significant differences only when the overtaking gap was critical for the system and confusing for the driver (Scenarios 3, 6, 9, and 12).

Fig. 4 Mean and standard deviation of the time required to complete a full overtaking maneuver by the driver and ADS.
Fig. 5 shows the AV’s maximum lateral speed (bottom) and acceleration (top) during overtaking maneuvers by the driver compared with those performed by the ADS. The maximum lateral speed and acceleration were measured as the maximum values of the AV’s speed and acceleration on the y-axis while changing lanes toward the opposing lane (positive values) and returning to its driving lane after passing SV (negative values). The lateral speed and acceleration of the ADS were set for a smooth lane change and lane return performance, considering the lateral position of the SV and the overtaking gap. ADS performed one-step overtaking at a higher longitudinal speed, and hence, a higher lateral speed. Generally, human drivers maintain a higher lateral speed than the ADS. The analysis indicated significant differences in the lateral speeds of the driver and ADS in all scenarios, except for Scenarios 1 and 5.

Fig. 5 Mean and standard deviation of lateral vehicle speed (bottom) and acceleration (top) during autonomous and manual overtaking maneuvers. Positive values refer to lane changes, and negative values refer to lane returns.
In all scenarios, the lateral acceleration values were within the normal range required to perform nonhazardous overtaking maneuvers at speeds lower than 40 km/h23). In accordance with the lateral speed values, the lateral accelerations maintained by the drivers were generally higher than those of ADS. The T-test revealed significant differences (p < 0.05) in the lateral accelerations between the driver and ADS in Scenarios 1, 3, 4, 7, 9, and 11.
3. 2 Subjective Data
The participants’ trust in and willingness to use automated vehicles were subjectively assessed before the driving experiment (i.e., based on the participants’ general knowledge and experience) and after the driving experiment (i.e., based on experiencing the current experiment). The results indicated that trust in automated vehicles after the driving experiment (mean = 4.56, SD = 0.63) was higher than before the driving experiment (mean = 3.69, SD = 0.61). However, their willingness to use automated vehicles before the driving experiment (mean = 4.34, SD = 0.73) was comparable to their ratings after the experiment (mean = 4.80, SD = 0.61). Previous studies have found that driving experience can increase self-reported trust in automation 24). However, depending on the context, driver experience may lead to a decrease in other measured constructs such as the feeling of safety and willingness to use 25).
Fig. 6 illustrates the drivers’ ratings on how satisfied they were with the ADS overall performance, and whether ADS driving behavior was consistent with their expectations and why. While most of the ratings were above the ideal average (3.5), the participants tended to rate the system in scenarios where the SV was located to the left of the lane center higher than in scenarios where the SV was in the lane center. Statistically significant differences were found between Scenarios 1 and 7 and Scenarios 2 and 8 (p < 0.05), indicating the potential effect of the lateral position of the SV. The effect of the overtaking gap on the participants’ ratings became stronger in the presence of a leading vehicle, particularly when the overtaking gap was insufficient. In addition, the data show that the effect of the LV’s existence became stronger when the SV was in the lane center, reducing the driver’s ability to check the oncoming traffic.

Fig. 6 Subjective evaluation of driver satisfaction and expectations of ADS in the situation.
Fig. 7 presents the driver’s desire to intervene and resume control over the vehicle. In general, there were 57 “I intervened” responses, 108 “I wanted to intervene” responses, 110 “I did not want to intervene” responses, and one “I do not know” response. In terms of the SV’s lateral position, the results of the rank-sum test indicated a significant difference between Scenarios 1 and 7 and between Scenarios 2 and 8 (p < 0.05). Considering the existence of an LV, the analysis revealed significant differences between Scenarios 1 and 4, 2 and 5, and 7 and 10 (p < 0.05). The analysis showed a significant effect (p < 0.05) of the overtaking gap on driver motivation to intervene under all the driving conditions. It is apparent from this figure that drivers are more motivated to intervene under challenging overtaking gap conditions (far oncoming vehicles) than under sufficient or insufficient overtaking gap conditions (no oncoming and near oncoming vehicles, respectively). It can also be observed that the driver’s desire to intervene when the SV is in the lane center is greater than when the SV is to the left of the lane center. Interestingly, the effect of the LV existence on driver intervention when the SV was in the lane center was the opposite of its effect when the SV was to the left of the lane center. The former effect caused a decrease in driver intervention, whereas the latter caused an increase in driver intervention and a desire to intervene.

Fig. 7 Driver reaction or feelings towards system decisions and behavior under each driving condition.
Fig. 8 provides summary statistics for the drivers’ expectations of the AV’s response to a stopped vehicle. The responses rates were 83% of the responses were “I expected that AV will overtake SV,” 11% of the responses were “I did not expect that AV will overtake SV,” and 6% of the responses were “Neither.” No significant differences were observed between the scenarios. This can be attributed to participants’ prior knowledge of the system’s capability to perform overtaking maneuvers. In addition, participants experienced automated overtaking during the familiarization drive. Interestingly, the participants’ responses to question three and question four did not show similar trends. For example, the majority of those who intervened or wanted to intervene expected the system to overtake the stopped vehicle. Therefore, it can be inferred that the drivers’ tendency to override the system was not affected by their expectation of whether the system could perform the maneuver required in the situation. In terms of the investigated scenarios, the drivers’ tendency to override the system can be related more to trust and complacency or HMI issues, leading to miscommunication between the driver and system.

Fig. 8 Evaluation of driver expectations of the system’s ability to overtake the stopped vehicle.
Table 2 summarizes the participants’ responses to the open-ended questions. Participants expressed their preferences for faster deceleration and smoother overtaking maneuvers as well as the desire for the system to provide more timely and accurate information about the surrounding traffic. There were concerns about the system’s ability to perceive and respond to the situation properly, particularly regarding far-approaching oncoming vehicles and lane-change timings. While some participants expressed a willingness to take control in specific situations where they felt the system was too slow or cautious, others indicated satisfaction with the system’s overall behavior, particularly in managing the overtaking process and recognizing the surrounding traffic.
Table 2 Categorization of participants’ responses to self-report questionnaires after each driving condition. The count column represents the number of participant responses in each category for the corresponding question.
| Questions | Category | Description | Count |
|---|---|---|---|
|
|||
| A | Positive Feedback | Participants were satisfied with the system’s overall performance | 120 |
| B | Concerns about Speed | Participants expressed concerns about the system’s speed (higher or slower than required) | 30 |
| C | Concerns about Deceleration | Participants expressed concerns about the system’s deceleration when approaching the stopped vehicle (harder, slower, or earlier than required) | 48 |
| D | Concerns about Lane Change | Participants expressed concerns about the system’s overtaking behavior using the opposite lane | 60 |
| E | Concerns about Perception | Participants expressed concerns about the system’s ability to perceive oncoming vehicles | 48 |
|
|||
| A | Positive feedback | Participants expressed satisfaction with the system’s driving | 120 |
| B | Concerns about Speed and Spacing | Participants expressed concerns about the system’s speed, inter-vehicle distance, and lateral clearance distance | 31 |
| C | Concerns about Deceleration and Braking | Participants expressed concerns about the system’s deceleration when approaching the stopped vehicle | 48 |
| D | Concerns about Lane Change and Lane Return | Participants expressed concerns about the system’s lane changing to the opposite lane and returning to the original lane. | 60 |
| E | Concerns about Perception | Participants expressed concerns about the system’s ability to perceive oncoming vehicles | 30 |
|
|||
| A | Safety Concerns | Responses that express safety concerns about the system’s performance | 216 |
| B | Driving Control | Responses that express a desire to take over control due to concerns about the system’s speed and reaction to oncoming vehicles | 192 |
| C | Trust in System | Responses that express trust in the system’s performance and no need to intervene | 36 |
|
|||
| A | Expectations Met | Responses that express that the system met their expectations | 108 |
| B | Expectations Unmet | Responses that express that the system did not meet their expectations | 108 |
| C | Concerns about Safety | Responses that express safety concerns about the system’s ability to overtake | 60 |
|
|||
| A | Safe | Responses that express a feeling of safety | 198 |
| B | Unsafe | Responses that express a feeling of unsafety | 48 |
| C | Slightly Unsafe | Responses that express a feeling of having slight safety concerns | 30 |
Fig. 9 captures the range of responses from the participants and provides a basis for understanding their overall perceptions of ADS. Participants’ feedback on the system behavior during the experiment encompassed several key themes. Positive appraisals were frequent, with participants commending with the stability of the system and smooth driving. They noted its effective waiting behavior for oncoming vehicles, appropriate reactions to stopped or front vehicles, and commendable timing and deceleration, particularly in scenarios requiring lane changes and overtaking maneuvers. The participants also appreciated the system’s adherence to safety protocols, such as proper stopping to allow oncoming traffic to pass before changing lanes. Additionally, the participants found the system’s behavior to be reflective of their driving styles, a factor contributing to their overall positive perceptions.

Fig. 9 Summary of participants’ responses to the open-ended questions after each scenario.
However, concerns regarding the speed of certain maneuvers were prevalent. Participants expressed dissatisfaction with the perceived slowness of lane changes and braking, along with perceived delays in returning to the original lane after completing the overtaking maneuvers. These concerns underscore the importance of efficient and timely system response to ensure driver confidence and comfort.
Safety-related apprehensions were also prominent among the participants. These included concerns regarding the ability of the system to accurately confirm the presence of oncoming vehicles, leading to feelings of uncertainty and unease during overtaking maneuvers. Participants also raised visibility issues related to the lead vehicle and expressed worries about the system’s proximity to oncoming vehicles, emphasizing the critical role of clear communication and perception in enhancing driver trust in automated systems.
Additionally, participants identified HMI issues, particularly instances in which the HMI failed to display oncoming vehicles or provide sufficient information for safe maneuver execution. These observations suggest the need for intuitive and informative HMIs in ADS to enhance driver situational awareness and decision making.
Suggestions for system improvement included enhancing the system’s proactive deceleration capabilities and providing more detailed information, such as indicating the distance to the lead vehicle, through the HMI. These recommendations highlight the potential of iterative refinement of ADS to address user concerns and improve the overall system usability and safety.
Overall, the participants’ responses exhibited mixed opinions, with some expressing satisfaction with the system’s performance, whereas others remained neutral or identified areas for improvement. These findings underscore the multifaceted nature of user perceptions and experiences with ADS, and highlight the importance of addressing usability and safety concerns to enhance user acceptance and trust in such systems.
Based on these responses, we established specific categories by grouping similar responses, as shown in Fig. 10. The categorization of responses provides valuable insights into user trust and the acceptance of autonomous driving systems. By analyzing these categories, developers and researchers can prioritize areas of development and user education to increase ADS adoption.
(1) Safe and Satisfied: Participants who felt safe and satisfied with the autonomous driving system’s performance, with no major concerns or issues. This group’s positive feedback is crucial for promoting technology.
(2) Safe with Concerns: Participants who felt safe overall but had specific concerns about certain aspects of the system’s behavior or performance. Addressing these concerns is essential for system improvements and user reassurance.
(3) Unsafe and Unsatisfied: Participants who expressed feelings of unsafety or dissatisfaction with the system’s performance, citing specific instances where they felt the system did not meet their expectations or caused discomfort. Understanding the issues faced by this group is critical for enhancing safety measures and user experience.

Fig. 10 User perception categories. The proportion of each category was calculated by gathering similar responses.
4. Discussions
This study investigated driver interventions in automated driving without RtI, compared drivers’ overtaking behaviors with those of ADS in similar traffic situations, and assessed the impact of mismatch between driver perception and ADS action on subjective system assessments. Driver interventions primarily occurred when the AV approached the SV for overtaking. The study revealed a higher frequency of interventions during two-step overtaking scenarios, attributed to driver safety concerns owing to the presence of oncoming vehicles. Furthermore, in scenarios with far-oncoming vehicles, drivers tended to override the system more frequently, expressing worries about the system’s ability to detect far-oncoming vehicles.
The lateral position of the SV, the presence of the LV, and the availability of an overtaking gap significantly influenced driver intervention. Drivers tended to intervene more when the SV was positioned at the center of the lane than when it was positioned slightly to the left of the lane center. Moreover, the presence of an LV affected driver interventions, showing varying behaviors in response to differences in other traffic participants.
The durations of manual and automated overtaking maneuvers were compared. While the drivers completed the overtaking maneuvers faster, no significant differences were found. Additionally, an analysis of the lateral vehicle speed and acceleration during overtaking revealed significant differences between the human drivers and the automated system in various scenarios.
Participant feedback indicated varying levels of satisfaction and concerns regarding the ADS. While most participants expressed satisfaction with the system’s overall performance, concerns were raised about the system’s ability to perceive and respond to the surrounding traffic, emphasizing the need for smoother overtaking maneuvers and timely and accurate information about traffic conditions.
In summary, the results showed that drivers were more likely to intervene in automated driving without a request issued by the system when they perceived the system’s behavior as unsafe or when there was uncertainty regarding its ability to handle the situation. Additionally, drivers were more likely to intervene if they encountered complex traffic conditions, such as heavy traffic or unpredictable behaviors of other road participants. The findings suggest that driver perception of the system’s behavior and surrounding traffic conditions plays a crucial role in driver-initiated automation disengagements. Participant feedback indicated varying levels of satisfaction and concerns regarding the ADS. While most participants expressed satisfaction with the system’s overall performance, concerns were raised about the system’s ability to perceive and respond to the surrounding traffic, emphasizing the need for smoother overtaking maneuvers and timely and accurate information about traffic conditions.
The results of this study have implications for the development of automated driving technologies. To improve user experience and encourage the adoption of ADS, it is crucial to address users’ concerns and preferences for smoother and safer overtaking maneuvers. However, it should be noted that the results were obtained from participants who are experts in driving automation. The results may differ if the experiment involves general participants without any academic or professional background in the field. Moreover, the study only focused on car-to-car interactions and did not consider conflicts with other traffic participants, such as pedestrians, cyclists, and motorcyclists, who are commonly present in urban areas.
In future research, it may be beneficial to concentrate on the development of safer and more intuitive ADS and educate users to increase their trust in and acceptance of ADS technology. In summary, our findings emphasize the importance of comprehending driver interventions, satisfaction, and concerns in shaping the future of automated driving. Addressing these aspects is critical for improving safety and user experience and gaining widespread acceptance of ADS technology.
5. Conclusions
The drivers did not override the ADS because they wanted to perform a maneuver that was considered unsafe by the system. Rather, they interrupted the automated overtaking, considered safe by the system, to perform it manually because they perceived the ADS performance as unsafe. The driving performance results of the participants were inconsistent with their subjective assessments, which were influenced by mismatches between driver perception and ADS actions. Overall, the drivers maintained full engagement in all scenarios regardless of the experimental conditions. This behavior may be attributed to the relatively short duration of each driving scenario. However, such behavior is expected in urban settings because of the more dynamic environment compared with highway driving.
The findings of this study recommend that the system should operate with flexible safety boundaries, similar to those of human drivers. Otherwise, drivers may be reluctant to use a system that deviates from their natural driving behavior, even if the system is safe. In summary, tailoring automation to align driver expectations and natural behaviors is important for enhancing user acceptance and safety.