Abstract
Aims: T-cadherin (T-cad) is a specific binding partner of adiponectin (APN), adipocyte-specific secretory protein. APN exhibits organ protection via the T-cad-dependent accumulation onto several tissues such as the aorta, heart, and muscle. Recently, for the first time, we showed that three forms (130, 100, and 30 kDa) of soluble T-cad existed in human serum and correlated with several clinical parameters in patients with type 2 diabetes. Nevertheless, the significance of soluble T-cad has not been elucidated in the acute stage of cardiovascular diseases. We herein examined soluble T-cad concentrations and investigated their clinical significance in patients with emergency hospital admission due to ST-segment elevation myocardial infarction (STEMI).
Methods: This observational study enrolled 47 patients with STEMI who were treated via primary percutaneous coronary intervention (PCI). Soluble T-cad and APN concentrations were measured by using an enzyme-linked immunosorbent assay. This study is registered with the University Hospital Medical Information Network (Number: UMIN 000014418).
Results: Serum concentrations of soluble 130 and 100 kDa T-cad rapidly and significantly decreased after hospitalization and reached the bottom at 72 h after admission (p<0.001 and p<0.001, respectively). The patients with high soluble T-cad and low APN concentrations on admission showed a significantly higher area under the curve of serum creatine kinase-MB (p<0.01).
Conclusion: Serum soluble T-cad concentration changed dramatically in patients with STEMI, and the high T-cad and low APN concentrations on admission were associated with the myocardial infarction size. Further study is needed to investigate the usefulness of categorizing patients with STEMI by serum T-cad and APN for the prediction of severe prognoses.
Introduction
Adiponectin (APN) is present in the peripheral circulation with 103–106 times higher concentrations compared with other typical hormones or cytokines. APN concentration inversely correlates with body fat mass, especially visceral fat mass although APN is exclusively secreted from adipocytes1-4). There are numerous reports that the low level of serum APN is associated with not only metabolic syndrome but also type 2 diabetes and cardiovascular diseases5-11). Transplantation of APN-producing adipocyte cell-sheet onto myocardium ameliorated cardiac dysfunction in a mouse myocardial infarction model12). We previously investigated the time-dependent change of serum APN in patients with ST-segment elevation myocardial infarction (STEMI) and showed that serum APN concentrations rapidly decreased and reached the bottom at 24 h after recanalization13). Interestingly, such APN reduction was inversely correlated with the area under the curve (AUC) of serum creatine kinase-MB (CK-MB), which is associated with the infarct area and predicts mortality13, 14).
Several molecules have been demonstrated as a receptor and/or a binding protein of APN15, 16). Among them, T-cadherin (T-cad) is a specific binding partner of high molecular weight adiponectin (HMW-APN), which plays a crucial role in exhibiting a biological function of APN, and its serum level is correlated significantly with metabolic syndrome and atherosclerosis17-19). T-cad is mainly expressed in the aorta, heart, and skeletal muscle20-22). T-cad belongs to a cadherin family characterized by highly conserved cadherin repeats, but T-cad is a unique cadherin possessing a glycosylphosphatidylinositol (GPI) anchor and is expressed on the cell surface without prodomain cleavage23). Interestingly, T-cad lacks a transmembrane domain, but T-cad is required to exhibit the protective effect of APN on various organs24-28). Importantly, genome-wide association study demonstrated the significant association of T-cad gene with circulating APN level, metabolic syndrome, and cardiovascular diseases, by several independent groups29-32). We recently showed that the binding of APN and cell surface T-cad promoted the exosome biogenesis and secretion33), and such APN-T-cad-exosome pathway may be accounted for a cardiovascular protective role of APN34, 35).
Recently, we for the first time identified three forms (130, 100, and 30 kDa) of soluble T-cad in human serum and established the new enzyme-linked immunosorbent assay (ELISA), which can separately measure out the three forms of soluble T-cad36). The soluble form is also reported for the other cadherins and suggested as disease biomarkers or functional molecules37-39). In our previous study, each form of soluble T-cad was differently but significantly associated with clinical parameters, and 130 kDa T-cad concentration was correlated with serum APN level in Japanese patients with type 2 diabetes36). However, the clinical significance of soluble T-cad has not been elucidated in the acute stage of cardiovascular diseases.
In the present study, we measured the three forms of soluble T-cad in patients with STEMI to investigate the time-series change of soluble T-cad and the association between serum AUC of CK-MB and soluble T-cad levels.
Materials and Methods
Subjects
The present study is an additional analysis of our previous report13). All subjects were patients with ST-segment elevation myocardial infarction (STEMI) and were admitted to Senri Critical Care Medical Center in Osaka Saiseikai Senri Hospital for treatment of emergent PCI from November 2013 to February 2015. Written consent was obtained from all subjects. Subjects with insufficient serum samples were excluded. This study was approved by the human ethics committees of Osaka Saiseikai Senri Hospital (approval number: 250803) and Osaka University Hospital (approval number: 13127) and was also registered with the University Hospital Medical Information Network (UMIN 000014418).
Clinical Examinations and Laboratory Tests
The baseline information of the patients including age, gender, body mass index (BMI), coronary risk factors (diabetes, hypertension, dyslipidemia, and smoking), medication, and onset time of STEMI were collected on admission13). Blood samples were collected on admission (0 h) and at 3, 6, 12, 24, 48, 72, 168 h after admission. The estimated glomerular filtration rate (eGFR) was calculated using the simplified Modification of Diet in Renal Disease equation modified by the appropriate coefficient for Japanese populations by gender40). Serum CK-MB and AUC of serum CK-MB were measured and calculated as reported previously13). Serum adiponectin (APN) concentration was measured with human adiponectin ELISA kit (Otsuka Pharmaceutical Co. Ltd.). Serum 130/100/30 kDa T-cadherin (T-cad) concentrations were measured and calculated using Human T-cadherin (130K) Assay kit, Human T-cadherin (100K+130K) Assay kit, and Human T-cadherin (30K+130K) Assay kit (Immuno-Biological Laboratories Co., Ltd.), as reported previously36). Diabetes, hypertension, and dyslipidemia were diagnosed according to the criteria commonly used Japanese guidelines: 1) diabetes: HbA1c(NGSP) ≥ 6.5% and fasting glucose ≥ 126 mg/dL (or continuous high glucose levels are observed), 2) hypertension: systolic blood pressure (BP) ≥ 140 mmHg and/or diastolic BP ≥ 90 mmHg, 3) dyslipidemia: low-density lipoprotein cholesterol (LDL-C) concentrations ≥ 140 mg/dL, triglyceride (TG) concentrations ≥ 150 mg/dL, and/or high-density lipoprotein cholesterol (HDL-C) concentrations ≤ 40 mg/dL. Subjects were considered to have diabetes, hypertension, or dyslipidemia if they received each medication.
Statistical Analysis
Data are presented as mean±standard deviation for variables with normal distribution, median (lower–higher quartile) for variables with skewed distribution, or frequency (%). In simple linear regression analyses, logarithmic transformation was performed for the variables with skewed distribution. Dunnet’s test was used for multiple comparisons. In all cases, the probability (P) values of <0.05 were considered statistically significant. All analyses were performed with JMP Pro 14.3.0 software (SAS Institute Inc., Cary, NC, USA).
Results
Baseline Characteristics on Admission
Of the 49 subjects in our previous report13), we excluded two patients whose serum sample volumes were insufficient for the assay of T-cad ELISA, and thus, 47 subjects were enrolled and analyzed in the present study. Table 1 shows their clinical characteristics and serum soluble T-cad concentrations on admission. The mean concentrations of the 130+100, 130+30, and 130 kDa T-cad (directly measured) were 2559.0, 1310.7, and 601.4 pmol/L, respectively. The mean concentrations of the 100 and 30 kDa T-cad (calculated by subtraction of [130k+100k]−[130k] and [130k+30k]−[130k], respectively, as in our previous study36)) were 1957.6 and 709.3 pmol/L, respectively.
Table 1.
Clinical characteristics of the study subjects on admission
| Variables |
|
| n [males/females]
|
47 [32/15] |
| Age (years) |
66.2±12.7 |
| BMI (kg/m2)
|
24.5±3.6 |
| Diabetes (%) |
34 |
| Hypertension (%) |
55 |
| Dyslipidemia (%) |
77 |
| Current smoker (%) |
41 |
| Glucose (mg/dL) |
198.1±66.1 |
| HbA1c (%) |
6.3±0.9 |
| LDL-C (mg/dL) |
131.8±38.5 |
| HDL-C (mg/dL) |
45.3±12.1 |
| TG (mg/dL) |
146 (88-225.5) |
| AST (U/L) |
27 (21-68) |
| ALT (U/L) |
23 (15-43) |
| eGFR (mL/min/1.73m2)
|
63.2±20.4 |
| WBC (x1000/μL) |
9.4 (8.1-12.8) |
| Hemoglobin (g/dL) |
13.7±1.9 |
| Albumin (g/dL) |
3.9±0.4 |
| CRP (mg/dL) |
0.12 (0.06–0.59) |
| BNP (pg/mL) |
39.0 (21.7–112) |
| Onset to Door Time (min) |
88 (55-278) |
| Adiponectin (μg/mL) |
6.6 (4.3–9.7) |
| 130-kDa T-cadherin (pmol/L) |
601.4±203.5 |
| 100-kDa T-cadherin (pmol/L) |
1957.6±591.4 |
| 30-kDa T-cadherin (pmol/L) |
709.3±335.0 |
Data are represented as mean±SD for values with normal distribution, median (minimum-maximum) for values with skewed distribution, or frequency. The concentrations of serum soluble T-cadherin are represented as recombinant 130-kDa T-cadherin equivalent.
Abbreviations: BMI; body mass index, LDL-C; low-density lipoprotein cholesterol, HDL-C; high-density lipoprotein cholesterol, TG; triglyceride, AST; aspartate aminotransferase, ALT; alanine aminotransferase, eGFR; estimated glomerular filtration rate, WBC; white blood cell, CRP; C-reactive protein, BNP; brain natriuretic peptide.
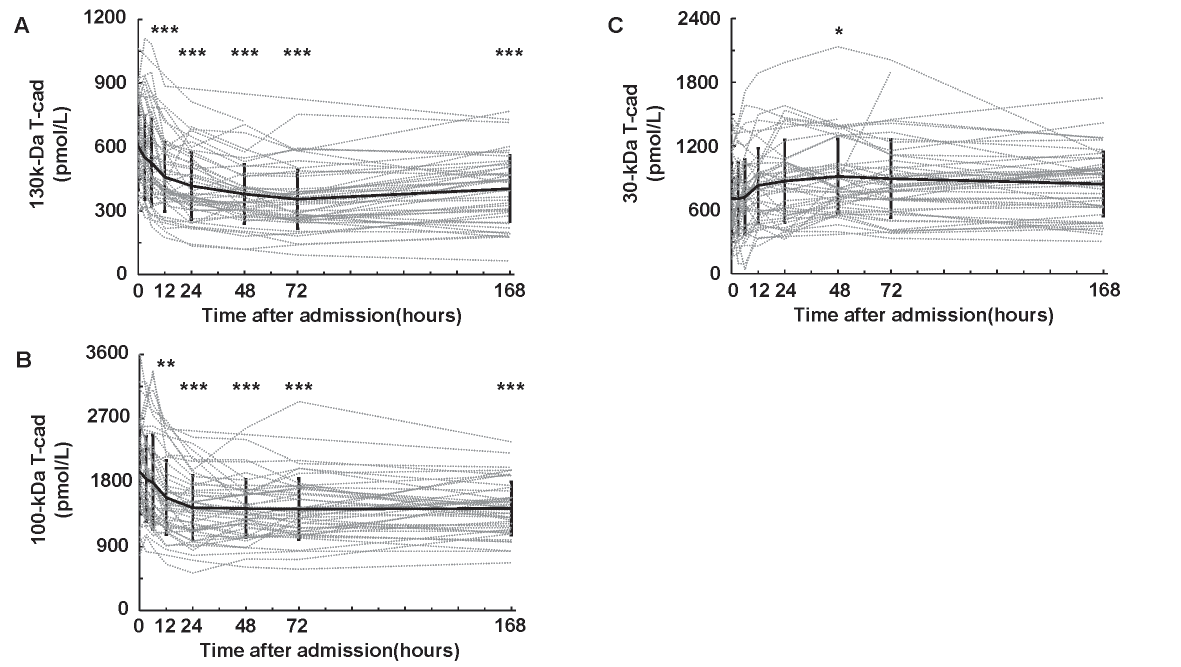
First, we examined the time course of serum soluble T-cad concentrations in patients with STEMI (Fig.1). Interestingly, the serum 130 (Fig.1A) and 100 kDa (Fig.1B) T-cad concentrations decreased and reached the bottom at 72 h after admission. Serum 130 and 100 kDa T-cad levels at 12, 24, 48, 72, and 168 h were significantly lower than those on admission. Conversely, 30 kDa T-cad concentration increased and showed the highest value at 48 h after admission (Fig.1C).
Correlations between Serum T-Cadherin Concentrations and Clinical Parameters on Admission
Next, we performed univariate analyses between serum 130/100/30 kDa T-cad and clinical parameters on admission (Table 2). The concentration of 130 kDa T-cad was significantly correlated with WBC (r=−0.349, p=0.016). No significant correlations with the clinical parameters were observed in 100 kDa T-cad. Conversely, the concentration of 30 kDa T-cad showed significant correlations with age (r=0.426, p=0.003), LDL-C (r=−0.355, p=0.015), eGFR (r=−0.514, p<0.001), hemoglobin (r=−0.379, p=0.009), and albumin (r=−0.363, p=0.012).
Table 2.
Univariate analysis for correlations between serum 130-kDa/100-kDa/30-kDa T-cadherin levels on admission and clinical parameters
|
vs 130-kDa T-cad |
vs 100-kDa T-cad |
vs 30-kDa T-cad |
| Variable |
r |
p
|
r |
p
|
r |
p
|
| Age |
0.026 |
0.864 |
0.135 |
0.365 |
0.426
|
0.003
|
| BMI |
0.042 |
0.782 |
0.153 |
0.306 |
-0.140 |
0.349 |
| Glucose |
-0.121 |
0.419 |
0.130 |
0.383 |
-0.007 |
0.963 |
| HbA1c |
-0.169 |
0.255 |
0.073 |
0.625 |
-0.013 |
0.933 |
| LDL-C |
-0.042 |
0.781 |
-0.023 |
0.882 |
-0.355
|
0.015
|
| HDL-C |
0.132 |
0.381 |
0.041 |
0.786 |
-0.178 |
0.236 |
| log (TG) |
-0.212 |
0.161 |
-0.075 |
0.623 |
-0.004 |
0.980 |
| log (AST) |
0.054 |
0.721 |
-0.006 |
0.971 |
-0.016 |
0.915 |
| log (ALT) |
-0.057 |
0.701 |
-0.277 |
0.059 |
-0.018 |
0.906 |
| eGFR |
-0.116 |
0.438 |
-0.147 |
0.325 |
-0.514
|
<0.001
|
| log (WBC) |
-0.349
|
0.016
|
-0.275 |
0.062 |
-0.125 |
0.403 |
| Hemoglobin |
-0.072 |
0.629 |
-0.009 |
0.952 |
-0.379
|
0.009
|
| Albumin |
0.123 |
0.411 |
0.227 |
0.126 |
-0.363
|
0.012
|
| log (CRP) |
-0.050 |
0.740 |
-0.164 |
0.277 |
0.181 |
0.229 |
| log (BNP) |
0.104 |
0.490 |
0.027 |
0.858 |
0.134 |
0.376 |
| Onset to Door Time |
-0.117 |
0.434 |
-0.057 |
0.702 |
-0.006 |
0.967 |
| log (Adiponectin) |
0.084 |
0.573 |
-0.045 |
0.766 |
0.171 |
0.251 |
| AUC of CK-MB |
0.130 |
0.382 |
0.102 |
0.493 |
-0.066 |
0.662 |
Pearson correlation coefficient (r) and each probability value (p) are shown. Logarithmic transformation was performed for the skewed values. Abbreviations: BMI; body mass index, LDL-C; low-density lipoprotein cholesterol, HDL-C; high-density lipoprotein cholesterol, TG; triglyceride, AST; aspartate aminotransferase, ALT; alanine aminotransferase, eGFR; estimated glomerular filtration rate, WBC; white blood cell, CRP; C-reactive protein, BNP; brain natriuretic peptide, AUC of CK-MB; area under the concentration-time curve of creatine kinase-myocardial band.
In our previous report, we showed that serum APN concentration was inversely correlated with AUC of CK-MB in patients with STEMI13) and was strongly associated with serum 130 kDa T-cad concentration in Japanese patients with type 2 diabetes36). However, no correlation was observed between the 130/100/30 kDa T-cad concentrations on admission and APN or AUC of CK-MB (data not shown). There is a possibility that serum soluble T-cad concentrations in the acute phase of STEMI temporarily changed from their stable phase, and we thus examined T-cad concentrations at 168 h after admission and the difference of T-cad levels from baseline to the minimum (or maximum). However, we found no significant correlations of each soluble T-cad form with the AUC of CK-MB (data not shown).
Comparison of AUC of CK-MB in the Four Groups Categorized with Serum Soluble T-Cadherin and Adiponectin Concentrations
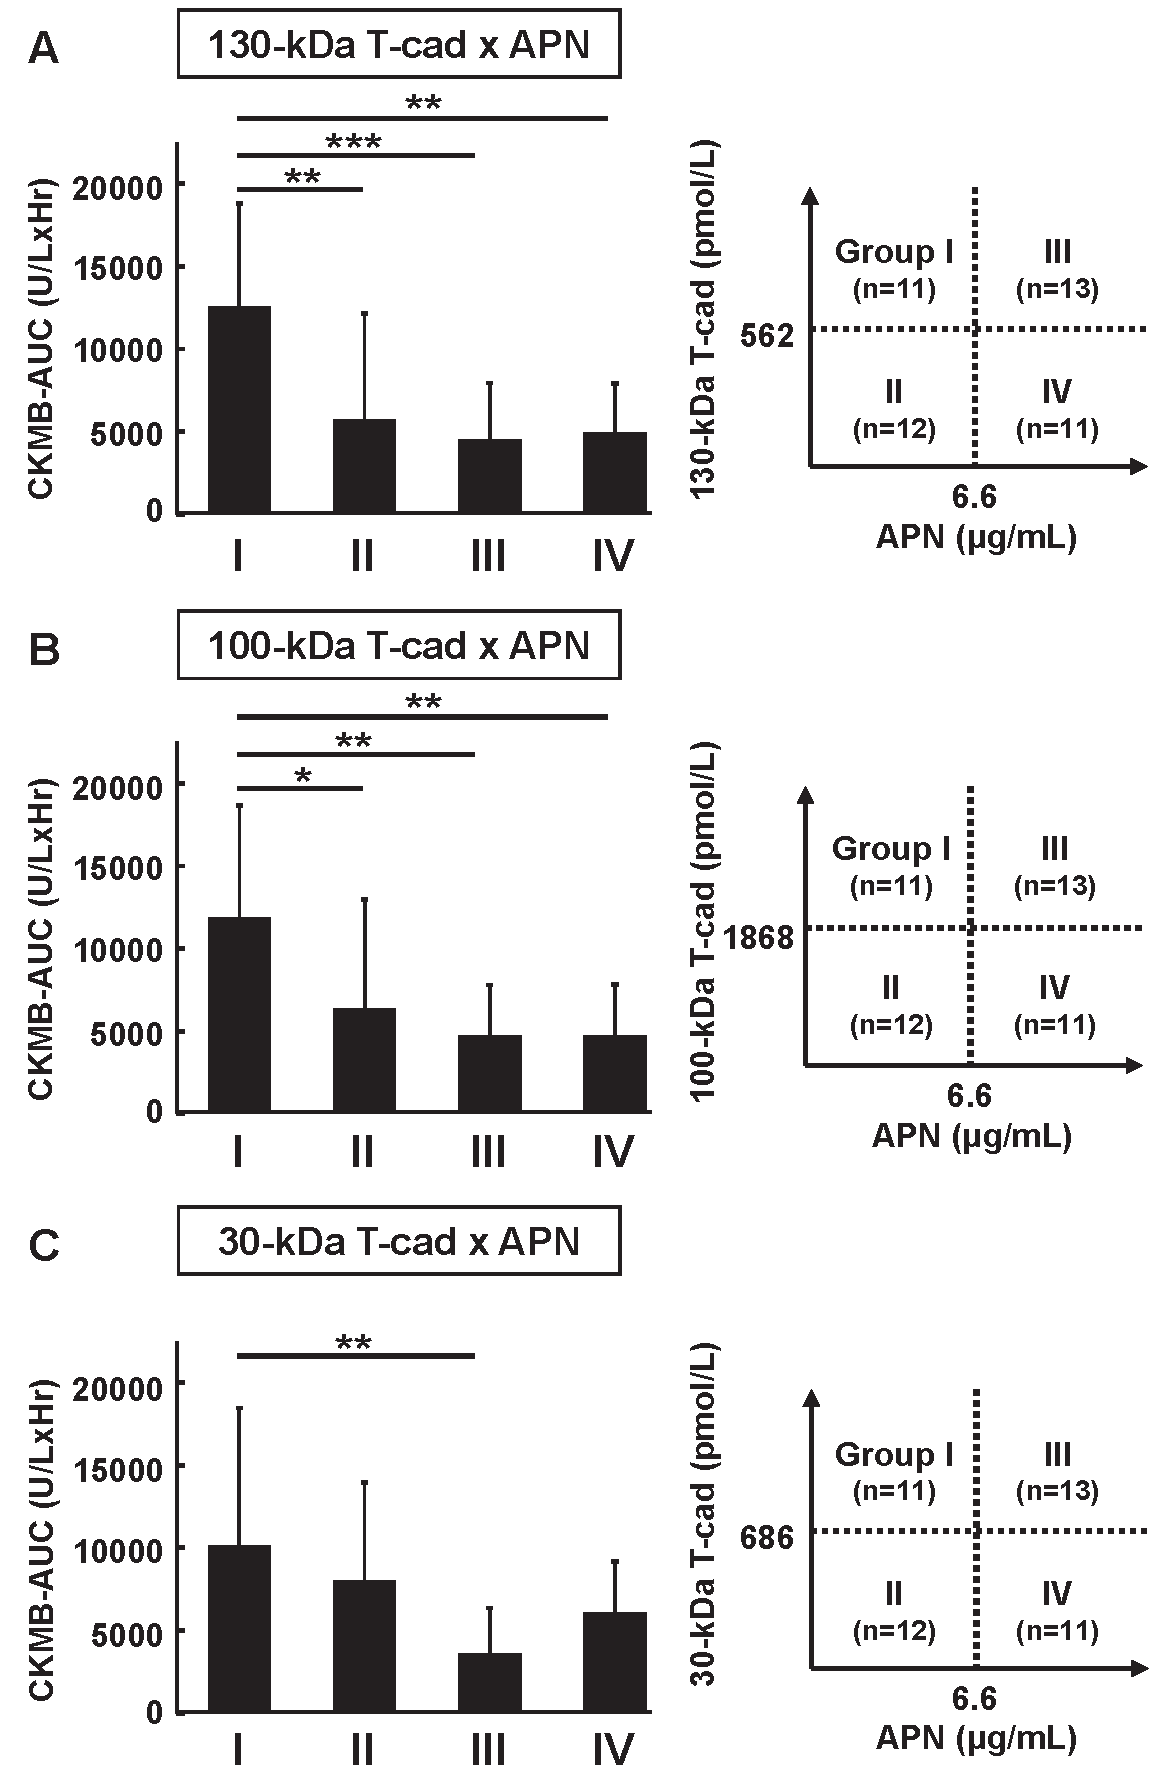
We previously demonstrated that low APN level on admission was a risk for high AUC of CK-MB when subjects were divided into four groups according to APN concentration on admission13). Finally, we here categorized the subjects into four groups divided by the median concentrations of serum soluble T-cad and APN on admission (Fig.2). We found that the AUC of CK-MB in group I (high T-cad & low APN) was significantly higher than that of other groups, categorized using the 130 kDa T-cad (Fig.2A) and 100 kDa T-cad (Fig.2B). A similar tendency was also observed in 30 kDa T-cad (Fig.2C).
We also determined the clinical features in each group (Supplemental Table 1, 2, 3). Using 130 or 100 kDa T-cad for the categorization (Supplemental Table 1, 2), the subjects in Group I were relatively young and obese and showed relatively high blood glucose levels compared with the subjects of the other groups. However, there was no significant clinical feature in the categorization with 30 kDa T-cad (Supplemental Table 3).
Supplemental Table 1.
Clinical characteristics of the study subjects categorized by 130-kDa T-cadherin and adiponectin on admission
|
Group |
P value
|
| Variables |
Ⅰ |
Ⅱ |
Ⅲ |
Ⅳ |
Ⅰ vs Ⅱ |
Ⅰ vs Ⅲ |
Ⅰ vs Ⅳ |
| n (males/females)
|
11 (8/3) |
12 (12/0) |
13 (6/7) |
11 (6/5) |
0.093 |
0.240 |
0.659 |
| Age (years) |
59.2±13.5 |
60.4±13.0 |
73.3±10.0 |
71.3±8.2 |
0.987 |
0.011
|
0.043
|
| BMI (kg/m2)
|
26.9±4.0 |
24.6±3.3 |
22.7±2.1 |
24.2±3.9 |
0.179 |
0.010
|
0.109 |
| Diabetes (n (%))
|
6 (55) |
4 (33) |
3 (23) |
3 (27) |
0.414 |
0.206 |
0.387 |
| Hypertension (n (%))
|
4 (37) |
5 (42) |
9 (69) |
8 (73) |
1.000 |
0.217 |
0.198 |
| Dyslipidemia (n (%))
|
9 (82) |
9 (75) |
9 (69) |
9 (82) |
1.000 |
0.649 |
1.000 |
| Current smoker (n (%))
|
4 (36) |
7 (58) |
5 (38) |
3 (27) |
0.414 |
1.000 |
1.000 |
| Glucose (mg/dL) |
243.9±74.5 |
197.9±55.1 |
165.9±61.6 |
199.5±61.7 |
0.368 |
0.029
|
0.420 |
| HbA1c (%) |
6.7±1.3 |
6.5±1.1 |
5.8±0.5 |
6.2±0.5 |
0.952 |
0.038
|
0.524 |
| LDL-C (mg/dL) |
136.8±40.7 |
140.8±46.7 |
134.0±38.5 |
114.8±23.7 |
0.990 |
0.996 |
0.417 |
| HDL-C (mg/dL) |
40.9±7.3 |
41.3±5.7 |
51.2±17.4 |
46.5±11.1 |
1.000 |
0.101 |
0.544 |
| TG (mg/dL) |
154 (115-238) |
204 (124-274) |
83.5 (69-149) |
141 (84-228) |
0.860 |
0.059 |
0.649 |
| AST (U/L) |
33 (22-70) |
43 (27-74.8) |
22 (18-65.5) |
23 (15-66) |
0.926 |
0.628 |
0.428 |
| ALT (U/L) |
21 (18-57) |
29.5 (24-43) |
16 (13.5-30.5) |
23 (12-72) |
0.958 |
0.093
|
0.960 |
| eGFR (mL/min/1.73m2)
|
61.1±16.2 |
72.2±23.7 |
59.7±22.2 |
59.4±17.5 |
0.417 |
0.997 |
0.995 |
| WBC (x1000/μL) |
10.4 (8-12.1) |
12.0 (9.5-13.5) |
8.3 (7.3-9.8) |
9.2 (8.3-13.1) |
0.440 |
0.508 |
0.960 |
| Hemoglobin (g/dL) |
14.9±1.3 |
14.8±1.1 |
12.7±2.4 |
12.6±1.4 |
0.998 |
0.005
|
0.005
|
| Albumin (g/dL) |
4.1±0.5 |
4.1±0.3 |
3.9±0.5 |
3.7±0.3 |
1.000 |
0.456 |
0.078 |
| CRP (mg/dL) |
0.10 (0.05-0.24) |
0.09 (0.06-0.40) |
0.19 (0.07-1.12) |
0.14 (0.07-2.26) |
0.985 |
0.362 |
0.332 |
| BNP (pg/mL) |
23.6 (6.1-28.7) |
38.6 (14.8-161) |
78.4 (38.4-160.2) |
39.0 (22.7-104.8) |
0.442 |
0.009
|
0.297 |
| Onset to Door Time (min) |
68 (55-190) |
214 (60.3-470) |
57 (44-310) |
98 (41-160) |
0.402 |
0.999 |
0.982 |
Data are represented as mean±SD for values with normal distribution, median (minimum-maximum) for values with skewed distribution, or frequency. Dunnet’s test was used for values with normal distribution, Steel’s test was used for values with skewed distribution, and, Fisher’s exact
test was used for analysis of data classified into two categories. P value <0.05 is considered as statistically significant and shown in bold font.
Abbreviations: BMI; body mass index, LDL-C; low-density lipoprotein cholesterol, HDL-C; high-density lipoprotein cholesterol, TG; triglyceride, AST; aspartate aminotransferase, ALT; alanine aminotransferase, eGFR; estimated glomerular filtration rate, WBC; white blood cell, CRP; C-reactive protein, BNP; brain natriuretic peptide.
Supplemental Table 2.
Clinical characteristics of the study subjects categorized by 100-kDa T-cadherin and adiponectin on admission
|
Group |
P value
|
| Variables |
Ⅰ |
Ⅱ |
Ⅲ |
Ⅳ |
Ⅰ vs Ⅱ |
Ⅰ vs Ⅲ |
Ⅰ vs Ⅳ |
| n (males/females)
|
11 (8/3) |
12 (12/0) |
13 (6/7) |
11 (6/5) |
0.093 |
0.240 |
0.659 |
| Age (years) |
61.4±13.6 |
58.4±12.8 |
73.5±9.8 |
71.1±8.4 |
0.864 |
0.033
|
0.123 |
| BMI (kg/m2)
|
27.2±3.7 |
24.4±3.3 |
22.5±2.1 |
24.4±3.8 |
0.109 |
0.003
|
0.129 |
| Diabetes (n (%))
|
8 (73) |
2 (17) |
2 (15) |
4 (36) |
0.012
|
0.011
|
0.198 |
| Hypertension (n (%))
|
5 (45) |
4 (33) |
10 (77) |
7 (64) |
0.680 |
0.206 |
0.670 |
| Dyslipidemia (n (%))
|
9 (82) |
9 (75) |
9 (69) |
9 (82) |
1.000 |
0.649 |
1.000 |
| Currentsmoker (n (%))
|
3 (27) |
8 (67) |
5 (38) |
3 (27) |
0.060 |
0.289 |
1.000 |
| Glucose (mg/dL) |
251.9±66.3 |
182.3±47.7 |
177.8±63.1 |
185.5±64.9 |
0.024
|
0.013
|
0.037
|
| HbA1c (%) |
7.0±1.4 |
6.2±0.7 |
5.7±0.4 |
6.3±0.5 |
0.041
|
0.001
|
0.095 |
| LDL-C (mg/dL) |
134.7±40.2 |
142.5±46.8 |
129.6±37.5 |
120.0±28.7 |
0.933 |
0.978 |
1.000 |
| HDL-C (mg/dL) |
41.3±7.3 |
40.9±5.7 |
47.8±12.2 |
50.5±17.8 |
1.000 |
0.406 |
0.184 |
| TG (mg/dL) |
212 (116-292) |
163 (117-227) |
88 (69-159) |
141 (82-203) |
0.737 |
0.050
|
0.173 |
| AST (U/L) |
40 (27-70) |
34 (26-70) |
23 (19-114) |
22 (17-66) |
0.926 |
0.378 |
0.149 |
| ALT (U/L) |
24 (18-57) |
30 (21-43) |
15 (14-31) |
23 (13-72) |
1.000 |
0.121 |
0.743 |
| eGFR (mL/min/1.73m2)
|
57.9±16.2 |
75.1±21.7 |
55.6±22.2 |
64.3±16.2 |
0.100 |
0.982 |
0.780 |
| WBC (x1000/μL) |
11.5 (8-12.1) |
11.1 (9.0-13.5) |
8.7 (8-13.7) |
8.4 (7.4-11) |
0.778 |
0.983 |
0.493 |
| Hemoglobin (g/dL) |
15.0±1.3 |
14.8±1.1 |
12.6±2.4 |
12.7±1.3 |
0.985 |
0.003
|
0.006
|
| Albumin (g/dL) |
4.1±0.5 |
4.1±0.3 |
3.8±0.5 |
3.7±0.3 |
1.000 |
0.345 |
0.102 |
| CRP (mg/dL) |
0.10 (0.05-0.24) |
0.09 (0.06-0.50) |
0.19 (0.07-2.23) |
0.14 (0.07-1.35) |
0.993 |
0.330 |
0.493 |
| BNP (pg/mL) |
23.2 (6.1-28.7) |
39.2 (19.1-161.4) |
78.4 (28.8-201.7) |
44.0 (23.1-95.8) |
0.241 |
0.011
|
0.131 |
| Onset to Door Time (min) |
68 (46-278) |
119 (60-470) |
144 (49-483) |
88 (41-146) |
0.421 |
0.873 |
0.864 |
Data are represented as mean±SD for values with normal distribution, median (minimum-maximum) for values with skewed distribution, or frequency. Dunnet’s test was used for values with normal distribution, Steel’s test was used for values with skewed distribution, and, Fisher’s exact
test was used for analysis of data classified into two categories. P value <0.05 is considered as statistically significant and shown in bold font.
Abbreviations: BMI; body mass index, LDL-C; low-density lipoprotein cholesterol, HDL-C; high-density lipoprotein cholesterol, TG; triglyceride, AST; aspartate aminotransferase, ALT; alanine aminotransferase, eGFR; estimated glomerular filtration rate, WBC; white blood cell, CRP; C-reactive protein, BNP; brain natriuretic peptide.
Supplemental Table 3.
Clinical characteristics of the study subjects categorized by 30-kDa T-cadherin and adiponectin on admission
|
Group |
P value
|
| Variables |
Ⅰ |
Ⅱ |
Ⅲ |
Ⅳ |
ⅠvsⅡ |
ⅠvsⅢ |
ⅠvsⅣ |
| n (males/females)
|
11 (8/3) |
12 (12/0) |
13 (5/8) |
11 (7/4) |
0.093 |
0.123 |
1.000 |
| Age (years) |
64.5±15.3 |
55.5±9.0 |
73.4±7.4 |
71.2±11.0 |
0.053 |
0.054 |
0.160 |
| BMI (kg/m2)
|
24.8±3.0 |
26.6±4.2 |
22.8±2.2 |
24.1±3.9 |
0.227 |
0.150 |
0.632 |
| Diabetes (n (%))
|
5 (45) |
5 (42) |
3 (23) |
3 (27) |
1.000 |
0.391 |
0.659 |
| Hypertension (n (%))
|
3 (27) |
6 (50) |
9 (69) |
8 (73) |
0.400 |
0.100 |
0.086 |
| Dyslipidemia (n (%))
|
8 (73) |
10 (83) |
9 (69) |
9 (82) |
0.640 |
1.000 |
1.000 |
| Currentsmoker (n (%))
|
7 (64) |
4 (33) |
3 (23) |
7 (64) |
0.220 |
0.095 |
1.000 |
| Glucose (mg/dL) |
218.3±77.3 |
213.2±57.9 |
181.5±66.9 |
181.2±60.6 |
0.995 |
0.388 |
0.414 |
| HbA1c (%) |
6.7±1.3 |
6.5±1.0 |
5.9±0.6 |
6.0±0.6 |
0.855 |
0.110 |
0.162 |
| LDL-C (mg/dL) |
140.1±42.2 |
138.0±45.7 |
115.1±27.5 |
137.2±36.9 |
0.998 |
0.285 |
0.996 |
| HDL-C (mg/dL) |
38.7±4.9 |
43.1±6.9 |
45.5±12.0 |
53.3±17.1 |
0.683 |
0.343 |
0.014 |
| TG (mg/dL) |
172 (115-249) |
180 (132-253) |
141 (72-159) |
86 (76-172) |
0.981 |
0.321 |
0.086 |
| AST (U/L) |
27 (26-48) |
48 (30-97) |
21 (18-82) |
23 (20-34) |
0.440 |
0.328 |
0.448 |
| ALT (U/L) |
29 (21-43) |
24 (18-85) |
17 (14-74) |
16 (13-36) |
0.999 |
0.488 |
0.207 |
| eGFR (mL/min/1.73m2)
|
59.9±13.3 |
73.3±24.7 |
51.4±14.9 |
69.2±21.1 |
0.233 |
0.558 |
0.526 |
| WBC (x1000/μL) |
10.4 (8.1-12.9) |
11.7 (9.2-13.0) |
8.5 (7.8-12.1) |
8.5 (7.4-12.8) |
1.000 |
0.711 |
0.722 |
| Hemoglobin (g/dL) |
14.7±1.3 |
15.0±1.1 |
12.2±2.0 |
13.2±1.8 |
0.922 |
0.001
|
0.078 |
| Albumin (g/dL) |
4.0±0.4 |
4.1±0.4 |
3.7±0.4 |
3.9±0.4 |
0.736 |
0.116 |
0.899 |
| CRP (mg/dL) |
0.09 (0.06-0.24) |
0.10 (0.05-0.50) |
0.31 (0.07-2.80) |
0.11 (0.06-0.35) |
0.985 |
0.146 |
0.912 |
| BNP (pg/mL) |
23.2 (6.1-51.8) |
28.3 (16.8-94.9) |
56.6 (25.6-699.7) |
47.7 (31.2-100.8) |
0.818 |
0.086 |
0.451 |
| Onset to Door Time (min) |
61 (55-397) |
128 (69-402) |
88 (49-175) |
98 (41-152) |
0.673 |
0.983 |
1.000 |
Data are represented as mean±SD for values with normal distribution, median (minimum-maximum) for values with skewed distribution, or frequency. Dunnet’s test was used for values with normal distribution, Steel’s test was used for values with skewed distribution, and, Fisher’s exact
test was used for analysis of data classified into two categories. P value <0.05 is considered as statistically significant and shown in bold font.
Abbreviations: BMI; body mass index, LDL-C; low-density lipoprotein cholesterol, HDL-C; high-density lipoprotein cholesterol, TG; triglyceride, AST; aspartate aminotransferase, ALT; alanine aminotransferase, eGFR; estimated glomerular filtration rate, WBC; white blood cell, CRP; C-reactive protein, BNP; brain natriuretic peptide.
Discussion
In the present study, we showed that serum concentrations of soluble T-cad in the patients with STEMI were remarkably changed after the hospital admission and the AUC of CK-MB was significantly high in the subjects with high T-cad and low APN concentrations on admission.
Compared with our previous report36), there were little or no associations between the serum soluble T-cad levels and metabolic parameters, such as HDL-C, CRP, and APN levels, at the hospitalization (Table 2). A similar result was observed at 168 h after admission, in which time-point could be regarded as a completely recovered state (data not shown). The systemic change in the acute phase and the treatment for STEMI might influence their associations. Reportedly, serum soluble T-cad levels were associated with angiographic severity of acute coronary syndrome41), HMW-APN in stable coronary artery disease42), and obese type 2 diabetes43). However, in these reports, it is unclear which forms of T-cad (130, 100, or 30 kDa) concentration were associated with those factors because their T-cad ELISA systems were different from our newly developed ELISA system.
As shown in Fig.1, serum 130 and 100 kDa T-cad levels significantly decreased and serum 30 kDa T-cad levels slightly increased within 24–48 h after hospitalization. Those changes (approximately 30%–40% from baseline) were larger than the APN change (~20% from baseline) in our previous study13). Compared with the hospitalized patients with type 2 diabetes in our previous report36), patients with STEMI showed higher 100 kDa (STEMI 1957.6±591.4 pmol/L vs. diabetes 1136.2±419.2 pmol/L) and lower 30 kDa (STEMI 709.3±335.0 pmol/L vs. diabetes 1182.9±685.9 pmol/L) T-cad levels, suggesting a possibility that serum soluble T-cad levels could be changed in the acute clinical condition such as STEMI. Such acute and large changes of soluble T-cad could be derived from not only the injured cardiac tissue but also various tissues in the whole body, such as vascular endothelium, skeletal muscle, and nerve tissue, in which T-cad is abundantly expressed22-23). A precise mechanism for the circulating T-cad dynamics will be clarified in the future using further experimental investigations.
The present study did not show the significant associations of AUC of CK-MB with serum soluble T-cad levels or their changes (data not shown), whereas serum APN was significantly associated with the AUC of CK-MB13). Nevertheless, GPI-anchored tissue T-cad plays crucial roles in cardiovascular protection, muscle regeneration, and increasing exosome biogenesis24-28, 33-35). Baltrūnienė et al demonstrated that the decreased myocardial T-cad levels can indicate the severity of heart failure in human subjects44). Although we could not measure the amount of tissue T-cad in the present study protocol, there is a possibility that the myocardial T-cad level sequentially decreases in the acute phase of STEMI.
T-cad is originally expressed on the cell surface of the heart, muscle, and endothelial cells as GPI-anchored form22, 23). We previously demonstrated that APN bound to T-cad on the cell surface with a considerable high affinity and preferentially increased 130 kDa T-cad in tissues and cells21). Interestingly, tissue T-cad protein level, not mRNA level, was dramatically decreased in APN-null mice and APN supplementation significantly recovered such T-cad reduction22). The importance of T-cad on cardiovascular protection is reported by our group and other investigators24-26). We thus hypothesized that circulating T-cad level might reflect the tissue amount of GPI-anchored T-cad. As shown in Fig.2, Group I (high T-cad and low APN) showed the highest AUC of CK-MB level among all groups. In high T-cad groups (Groups I and III), low APN level (Group I) may be one of the risks for the enlargement of infarct area, as reported previously13). Even in low APN groups (Groups I and II), subjects with high T-cad (Group I) could be recognized as having a higher risk for severe prognosis. There is a possibility that the increase of serum soluble T-cad reflects the reduction of myocardial T-cad protein level especially in ischemia or infarct area and thus APN and T-cad-dependent cardioprotective effect is weakened, finally resulting in a large AUC of CK-MB (Group I vs. II). It will be needed to elucidate whether circulating soluble T-cad concentration reflects the amount of tissue T-cad in the future. Also, Group I included relatively young and obese subjects with relatively high blood glucose levels. This clinical feature of Group I may affect the AUC of CK-MB. A larger prospective study will be needed to investigate the usefulness of categorizing patients with STEMI with serum soluble T-cad and APN on admission for the prediction of severe prognoses, in comparison with the other well-known biomarkers (such as CK-MB, cardiac troponin, brain natriuretic peptide, and a ratio of lymphocyte to white cells) for STEMI.
This study has several limitations. First, the study was observational, has a relatively small population, and was performed in a single institution. The influence of gender, culprit lesions of the coronary artery, medication, treatment for STEMI, and other residual or unmeasured factors on the concentration and the time course of serum soluble T-cad cannot be fully excluded. Further investigations are needed to clarify whether serum soluble T-cad predicts the severity or prognosis of STEMI.
In conclusion, we showed that serum soluble T-cad concentration dramatically changed with time in patients with STEMI, and the high T-cad and low APN concentration on admission was associated with the myocardial infarction size.
Acknowledgements
We thank Yasue Fukushima for excellent technical assistance and all members of the Third Laboratory (Adiposcience Laboratory, Department of Metabolic Medicine, Osaka University) for their helpful discussion of the project. This work was supported in part by a Joint Research with Kowa Pharmaceutical Co., Ltd. (to IS), by Grants-in-Aid for Scientific Research (C) No. 18K16229 (to YF), No.19K09023 (to HN), No. 19K08980 (to NM), and No. 19K08978 (to SK), Grants-in-Aid for Scientific Research (B) No. 18H02863 (to IS), Japan Foundation for Applied Enzymology (to YF), MSD Life Science Foundation (to YF), Japan Heart Foundation & Astellas Grant for Research on Atherosclerosis Update (to YF), and Uehara Memorial Life Science Foundation (to IS).
Conflict of Interests
All authors declared to have no conflict of interests in this study.
References
- 1) Arita Y, Kihara S, Ouchi N, Takahashi M, Maeda K, Miyagawa J, Hotta K, Shimomura I, Nakamura T, Miyaoka K, Kuriyama H, Nishida M, Yamashita S, Okubo K, Matsubara K, Muraguchi M, Ohmoto Y, Funahashi T, Matsuzawa Y. Paradoxical decrease of an adipose-specific protein, adiponectin, in obesity. 1999. Biochem Biophys Res Commun, 2012; 425: 560-564
- 2) Matsuzawa Y. Therapy Insight: adipocytokines in metabolic syndrome and related cardiovascular disease. Nat Clin Pract Cardiovasc Med, 2006; 3: 35-42
- 3) Matsuzawa Y, Funahashi T, Nakamura T. The concept of metabolic syndrome: contribution of visceral fat accumulation and its molecular mechanism. J Atheroscler Thromb, 2011; 18: 629-639
- 4) Maeda N, Funahashi T, Matsuzawa Y, Shimomura I. Adiponectin, a unique adipocyte-derived factor beyond hormones. Atherosclerosis, 2020; 292: 1-9
- 5) Hotta K, Funahashi T, Arita Y, Takahashi M, Matsuda M, Okamoto Y, Iwahashi H, Kuriyama H, Ouchi N, Maeda K, Nishida M, Kihara S, Sakai N, Nakajima T, Hasegawa K, Muraguchi M, Ohmoto Y, Nakamura T, Yamashita S, Hanafusa T, Matsuzawa Y. Plasma concentrations of a novel, adipose-specific protein, adiponectin, in type 2 diabetic patients. Arterioscler Thromb Vasc Biol, 2000; 20: 1595-1599
- 6) Lindsay RS, Funahashi T, Hanson RL, Matsuzawa Y, Tanaka S, Tataranni PA, Knowler WC, Krakoff J. Adiponectin and development of type 2 diabetes in the Pima Indian population. Lancet, 2002; 360: 57-58
- 7) Kumada M, Kihara S, Sumitsuji S, Kawamoto T, Matsumoto S, Ouchi N, Arita Y, Okamoto Y, Shimomura I, Hiraoka H, Nakamura T, Funahashi T, Matsuzawa Y; Osaka CAD Study Group. Coronary artery disease. Association of hypoadiponectinemia with coronary artery disease in men. Arterioscler Thromb Vasc Biol, 2003; 23: 85-89
- 8) Pischon T, Girman CJ, Hotamisligil GS, Rifai N, Hu FB, Rimm EB. Plasma adiponectin levels and risk of myocardial infarction in men. JAMA, 2004; 291: 1730-1737
- 9) Ohashi T, Shibata R, Morimoto T, Kanashiro M, Ishii H, Ichimiya S, Hiro T, Miyauchi K, Nakagawa Y, Yamagishi M, Ozaki Y, Kimura T, Daida H, Murohara T, Matsuzaki M. Correlation between circulating adiponectin levels and coronary plaque regression during aggressive lipid-lowering therapy in patients with acute coronary syndrome: subgroup analysis of JAPAN-ACS study. Atherosclerosis, 2010; 212: 237-242
- 10) Juonala M, Saarikoski LA, Viikari JS, Oikonen M, Lehtimäki T, Lyytikäinen LP, Huupponen R, Magnussen CG, Koskinen J, Laitinen T, Taittonen L, KähÖnen M, Kivimäki M, Raitakari OT. A longitudinal analysis on associations of adiponectin levels with metabolic syndrome and carotid artery intima-media thickness. The Cardiovascular Risk in Young Finns Study. Atherosclerosis, 2011; 217: 234-239
- 11) Ai M, Otokozawa S, Asztalos BF, White CC, Cupples LA, Nakajima K, Lamon-Fava S, Wilson PW, Matsuzawa Y, Schaefer EJ. Adiponectin: an independent risk factor for coronary heart disease in men in the Framingham offspring Study. Atherosclerosis, 2011; 217: 543-548
- 12) Imanishi Y, Miyagawa S, Maeda N, Fukushima S, Kitagawa-Sakakida S, Daimon T, Hirata A, Shimizu T, Okano T, Shimomura I, Sawa Y. Induced adipocyte cell-sheet ameliorates cardiac dysfunction in a mouse myocardial infarction model: a novel drug delivery system for heart failure. Circulation, 2011; 124: S10-S17
- 13) Natsukawa T, Maeda N, Fukuda S, Yamaoka M, Fujishima Y, Nagao H, Sato F, Nishizawa H, Sawano H, Hayashi Y, Funahashi T, Kai T, Shimomura I. Significant Association of Serum Adiponectin and Creatine Kinase-MB Levels in ST-Segment Elevation Myocardial Infarction. J Atheroscler Thromb, 2017; 24: 793-803
- 14) Shimabukuro M. Adiponectin and T-Cadherin: a Tree for Biomarkers in ST-Elevation or Non-ST-Elevation Myocardial Infarction. J Atheroscler Thromb, 2017; 24: 788-790
- 15) Yamauchi T, Kamon J, Ito Y, Tsuchida A, Yokomizo T, Kita S, Sugiyama T, Miyagishi M, Hara K, Tsunoda M, Murakami K, Ohteki T, Uchida S, Takekawa S, Waki H, Tsuno NH, Shibata Y, Terauchi Y, Froguel P, Tobe K, Koyasu S, Taira K, Kitamura T, Shimizu T, Nagai R, Kadowaki T. Cloning of adiponectin receptors that mediate antidiabetic metabolic effects. Nature, 2003; 423: 762-769
- 16) Takemura Y, Ouchi N, Shibata R, Aprahamian T, Kirber MT, Summer RS, Kihara S, Walsh K. Adiponectin modulates inflammatory reactions via calreticulin receptor-dependent clearance of early apoptotic bodies. J Clin Invest, 2007; 117: 375-386
- 17) Basu R, Pajvani UB, Rizza RA, Scherer PE. Selective downregulation of the high molecular weight form of adiponectin in hyperinsulinemia and in type 2 diabetes: differential regulation from nondiabetic subjects. Diabetes, 2007; 56: 2174-2177
- 18) Hirose H, Yamamoto Y, Seino-Yoshihara Y, Kawabe H, Saito I. Serum high-molecular-weight adiponectin as a marker for the evaluation and care of subjects with metabolic syndrome and related disorders. J Atheroscler Thromb, 2010; 17: 1201-1211
- 19) Baessler A, Schlossbauer S, Stark K, Strack C, Riegger G, Schunkert H, Hengstenberg C, Fischer M. Adiponectin multimeric forms but not total adiponectin levels are associated with myocardial infarction in non-diabetic men. J Atheroscler Thromb, 2011; 18: 616-627
- 20) Hug C, Wang J, Ahmad NS, Bogan JS, Tsao TS, Lodish HF. T-cadherin is a receptor for hexameric and high-molecular-weight forms of Acrp30/adiponectin. Proc Natl Acad Sci U S A, 2004; 101: 10308-10313
- 21) Fukuda S, Kita S, Obata Y, Fujishima Y, Nagao H, Masuda S, Tanaka Y, Nishizawa H, Funahashi T, Takagi J, Maeda N, Shimomura I. The unique prodomain of T-cadherin plays a key role in adiponectin binding with the essential extracellular cadherin repeats 1 and 2. J Biol Chem, 2017; 292: 7840-7849
- 22) Matsuda K, Fujishima Y, Maeda N, Mori T, Hirata A, Sekimoto R, Tsushima Y, Masuda S, Yamaoka M, Inoue K, Nishizawa H, Kita S, Ranscht B, Funahashi T, Shimomura I. Positive feedback regulation between adiponectin and T-cadherin impacts adiponectin levels in tissue and plasma of male mice. Endocrinology, 2015; 156: 934-946
- 23) Ranscht B, Dours-Zimmermann MT. T-cadherin, a novel cadherin cell adhesion molecule in the nervous system lacks the conserved cytoplasmic region. Neuron, 1991; 7: 391-402
- 24) Denzel MS, Scimia MC, Zumstein PM, Walsh K, Ruiz-Lozano P, Ranscht B. T-cadherin is critical for adiponectin-mediated cardioprotection in mice. J Clin Invest, 2010; 120: 4342-4352
- 25) Parker-Duffen JL, Nakamura K, Silver M, Kikuchi R, Tigges U, Yoshida S, Denzel MS, Ranscht B, Walsh K. T-cadherin is essential for adiponectin-mediated revascularization. J Biol Chem, 2013; 288: 24886-24897
- 26) Fujishima Y, Maeda N, Matsuda K, Masuda S, Mori T, Fukuda S, Sekimoto R, Yamaoka M, Obata Y, Kita S, Nishizawa H, Funahashi T, Ranscht B, Shimomura I. Adiponectin association with T-cadherin protects against neointima proliferation and atherosclerosis. FASEB J, 2017; 31: 1571-1583
- 27) Tanaka Y, Kita S, Nishizawa H, Fukuda S, Fujishima Y, Obata Y, Nagao H, Masuda S, Nakamura Y, Shimizu Y, Mineo R, Natsukawa T, Funahashi T, Ranscht B, Fukada SI, Maeda N, Shimomura I. Adiponectin promotes muscle regeneration through binding to T-cadherin. Sci Rep, 2019; 9: 16
- 28) Tsugawa-Shimizu Y, Fujishima Y, Kita S, Minami S, Sakaue TA, Nakamura Y, Okita T, Kawachi Y, Fukada S, Namba-Hamano T, Takabatake Y, Isaka Y, Nishizawa H, Ranscht B, Maeda N, Shimomura I. Increased vascular permeability and severe renal tubular damage after ischemia-reperfusion injury in mice lacking adiponectin or T-cadherin. Am J Physiol Endocrinol Metab, 2021; 320: E179-E190
- 29) Chung CM, Lin TH, Chen JW, Leu HB, Yang HC, Ho HY, Ting CT, Sheu SH, Tsai WC, Chen JH, Lin SJ, Chen YT, Pan WH. A genome-wide association study reveals a quantitative trait locus of adiponectin on CDH13 that predicts cardiometabolic outcomes. Diabetes, 2011; 60: 2417-2423
- 30) Morisaki H, Yamanaka I, Iwai N, Miyamoto Y, Kokubo Y, Okamura T, Okayama A, Morisaki T. CDH13 gene coding T-cadherin influences variations in plasma adiponectin levels in the Japanese population. Hum Mutat, 2012; 33: 402-410
- 31) Gao H, Kim YM, Chen P, Igase M, Kawamoto R, Kim MK, Kohara K, Lee J, Miki T, Ong RT, Onuma H, Osawa H, Sim X, Teo YY, Tabara Y, Tai ES, van Dam RM. Genetic variation in CDH13 is associated with lower plasma adiponectin levels but greater adiponectin sensitivity in East Asian populations. Diabetes, 2013; 62: 4277-4283
- 32) Kitamoto A, Kitamoto T, Nakamura T, Matsuo T, Nakata Y, Hyogo H, Ochi H, Kamohara S, Miyatake N, Kotani K, Mineo I, Wada J, Ogawa Y, Yoneda M, Nakajima A, Funahashi T, Miyazaki S, Tokunaga K, Masuzaki H, Ueno T, Chayama K, Hamaguchi K, Yamada K, Hanafusa T, Oikawa S, Sakata T, Tanaka K, Matsuzawa Y, Hotta K. CDH13 Polymorphisms are Associated with Adiponectin Levels and Metabolic Syndrome Traits Independently of Visceral Fat Mass. J Atheroscler Thromb, 2016; 23: 309-319
- 33) Obata Y, Kita S, Koyama Y, Fukuda S, Takeda H, Takahashi M, Fujishima Y, Nagao H, Masuda S, Tanaka Y, Nakamura Y, Nishizawa H, Funahashi T, Ranscht B, Izumi Y, Bamba T, Fukusaki E, Hanayama R, Shimada S, Maeda N, Shimomura I. Adiponectin/T-cadherin system enhances exosome biogenesis and decreases cellular ceramides by exosomal release. JCI Insight, 2018; 3: e99680
- 34) Nakamura Y, Kita S, Tanaka Y, Fukuda S, Obata Y, Okita T, Nishida H, Takahashi Y, Kawachi Y, Tsugawa-Shimizu Y, Fujishima Y, Nishizawa H, Takakura Y, Miyagawa S, Sawa Y, Maeda N, Shimomura I. Adiponectin Stimulates Exosome Release to Enhance Mesenchymal Stem-Cell-Driven Therapy of Heart Failure in Mice. Mol Ther, 2020; 28: 2203-2219
- 35) Kita S, Maeda N, Shimomura I. Interorgan communication by exosomes, adipose tissue, and adiponectin in metabolic syndrome. J Clin Invest, 2019; 129: 4041-4049
- 36) Fukuda S, Kita S, Miyashita K, Iioka M, Murai J, Nakamura T, Nishizawa H, Fujishima Y, Morinaga J, Oike Y, Maeda N, Shimomura I. Identification and Clinical Associations of 3 Forms of Circulating T-cadherin in Human Serum. J Clin Endocrinol Metab, 2021; 106: 1333-1344
- 37) De Wever O, Derycke L, Hendrix A, De Meerleer G, Godeau F, Depypere H, Bracke M. Soluble cadherins as cancer biomarkers. Clin Exp Metastasis, 2007; 24: 685-697
- 38) Hu QP, Kuang JY, Yang QK, Bian XW, Yu SC. Beyond a tumor suppressor: Soluble E-cadherin promotes the progression of cancer. Int J Cancer, 2016; 138: 2804-2812
- 39) Tang MKS, Yue PYK, Ip PP, Huang RL, Lai HC, Cheung ANY, Tse KY, Ngan HYS, Wong AST. Soluble E-cadherin promotes tumor angiogenesis and localizes to exosome surface. Nat Commun, 2018; 9: 2270
- 40) Matsuo S, Imai E, Horio M, Yasuda Y, Tomita K, Nitta K, Yamagata K, Tomino Y, Yokoyama H, Hishida A; Collaborators developing the Japanese equation for estimated GFR. Revised equations for estimated GFR from serum creatinine in Japan. Am J Kidney Dis, 2009; 53: 982-992
- 41) Pfaff D, Schoenenberger AW, Dasen B, Erne P, Resink TJ, Philippova M. Plasma T-cadherin negatively associates with coronary lesion severity and acute coronary syndrome. Eur Heart J Acute Cardiovasc Care, 2015; 4: 410-418
- 42) Schoenenberger AW, Pfaff D, Dasen B, Frismantiene A, Erne P, Resink TJ, Philippova M. Gender-Specific Associations between Circulating T-Cadherin and High Molecular Weight-Adiponectin in Patients with Stable Coronary Artery Disease. PLoS One, 2015; 10: e0131140
- 43) GÖddeke S, Knebel B, Fahlbusch P, HÖrbelt T, Poschmann G, van de Velde F, Benninghoff T, Al-Hasani H, Jacob S, Van Nieuwenhove Y, Lapauw B, Lehr S, Ouwens DM, Kotzka J. CDH13 abundance interferes with adipocyte differentiation and is a novel biomarker for adipose tissue health. Int J Obes (Lond), 2018; 42: 1039-1050
- 44) Baltrūnienė V, Rinkūnaitė I, Bogomolovas J, Bironaitė D, Kažukauskienė I, Šimoliūnas E, Ručnskas K, Puronaitė R, Bukelskienė V, Grabauskienė AV. The Role of Cardiac T-Cadherin in the Indicating Heart Failure Severity of Patients with Non-Ischemic Dilated Cardiomyopathy. Medicina (Kaunas). 2020; 56: 27