Abstract
Aim: To date, no studies representing the Southeast Asian population have validated the Pulmonary Embolism Severity Index (PESI) and 2019 European Society of Cardiology (ESC) risk stratification. Therefore, this study aimed to validate the PESI score, simplified PESI (sPESI), PESI risk classification, and 2019 ESC risk stratification in Southeast Asian patients with acute pulmonary embolism (APE).
Methods: The present study is a 10-year cross-sectional study. Here, risk regressions were conducted to identify the PESI risk classification, sPESI, and 2019 ESC risk stratification as predictors for 30-day all-cause and PE-related mortalities. Receiver operating characteristic (ROC) curves were constructed to determine the diagnostic ability of the PESI score, sPESI score, PESI risk classification, and 2019 ESC risk stratification to predict 30-day mortality.
Results: A total of 696 patients (male, 286; female, 410; mean age, 57.7±15.7 years) were included in this study from 2011 to 2020. The risk of 30-day all-cause mortality progressively increased with the 2019 ESC risk stratification, being approximately 6-fold higher in the high-risk than in the low-risk class [risk ratio: 6.24 (95% confidence interval (CI), 3.12, 12.47), P<0.001]. The risk of 30-day all-cause mortality with the PESI risk classification also increased with the risk classes, being approximately 6-fold higher in class V than in class I [adjusted risk ratio: 5.91 (95% CI, 2.25, 15.51), P<0.001]. The highest area under the receiver operating characteristic curve (AuROC) of the predictive model was the PESI score [AuROC=0.733 (95% CI, 0.685, 0.782)].
Conclusion: Our study represents a good validation of the PESI and 2019 ESC risk stratification to predict 30-day mortality after APE diagnosis in the Southeast Asian population.
Introduction
Acute pulmonary embolism (APE) has a broad spectrum of clinical presentation, ranging from asymptomatic (an incidental finding on computed tomography [CT]) to severe hemodynamic instability and sudden death1). APE patients presenting with hemodynamic instability have an average short-term mortality of 14%–50%1, 2). The prevalence of APE in Asian countries is not as high as in Western countries. The recently published population-wide estimates of annual symptomatic venous thromboembolism rates in Korea, Taiwan, and Hong Kong were 13.8, 15.9, and 19.9 per 100,000 people, respectively. These are approximately 15%–20% of the level recorded in Western countries (~100 per 100,000 people)3, 4).
Various prediction rules based on clinical parameters have been shown to be helpful in the prognostic assessment of APE patients. Of those, the pulmonary embolism severity index (PESI) is the most extensively validated score to date5). The PESI has been used to help stratify the risk of unfavorable outcomes over the clinical course of APE6). The PESI is aimed at stratifying the risk of death after APE identification on the basis of objective clinical parameters to help guide treatment and identify low-risk patients who may be candidates for management as outpatient. The simplified pulmonary embolism severity index (sPESI ) score has been reported to be useful in predicting 30-day mortality for APE patients, which helps in the identification of low-risk patients for early hospital discharge7, 8). The PESI has been validated in population-based samples from different countries9-11). In 2019, the European Society of Cardiology (2019 ESC) guidelines for the diagnosis and treatment of APE included this tool in their treatment guidance flowchart12). The ESC 2019 guidelines proposed a prognostic model for early mortality (i.e., within 30 days) after APE diagnosis based on integrated clinical, laboratory, and instrumental parameters, which stratify into four categories of early mortality risk as high, intermediate-high, intermediate-low, and low risks12). Risk category is defined based on hemodynamic instability, PESI class, evidence of right ventricle dysfunction, and elevated cardiac biomarker levels, that is, troponins or pro-B-type natriuretic peptide (pro-BNP)12). This model allows the differentiation of patients who can undergo home treatment (low-risk category), reducing hospital costs, from those who need admission into intensive care units from the early stages of the acute event (high-risk category). Previous studies were focused on the predictive ability of the PESI score, sPESI, and 2019 ESC risk class stratification8, 13-15). For example, Soriano et al. suggested that the original version of the PESI showed a greater area under the receiver operating characteristic curve (AuROC) than the simplified version (0.70 vs. 0.60)14). Moor et al. demonstrated that the discriminatory power for overall mortality was lower in the 2019 ESC algorithm (AUC: 0.64) compared with the PESI (AUC: 0.75) but did not reach statistical significance13). However, to the best of our knowledge, there were no studies validating the PESI and 2019 ESC risk class stratification in Thailand, which might represent the Southeast Asian population. Therefore, this study aimed to validate the PESI score, sPESI, PESI risk classification, and 2019 ESC risk stratification in patients with a diagnosis of APE in tertiary care hospital in northern Thailand which represent the Southeast Asian population.
Methods
Study Design and Setting
This study was a 10-year cross-sectional study that involved retrospective data collection. It was conducted between January 2011 to December 2020 at Chiang Mai University Hospital, Chiang Mai, Thailand, a tertiary care university hospital.
Subject Selection
All patients aged 15 years or above who were admitted with ICD-10 coding I 26.0 (pulmonary embolism with mention of acute cor pulmonale) and I 26.9 (pulmonary embolism without mention of acute cor pulmonale) were recruited into the study. Medical records were reviewed to confirm the diagnosis of APE. APE diagnosis was made when one of the following criteria (confirmed by a radiologist) was present: thrombus in the pulmonary artery and its branches detected via computed tomographic angiography (CTPA) or multi-detector CT of the chest with contrast. Right ventricular dysfunction was diagnosed when the right ventricle (RV) and left ventricle (LV) diameter ratios were >1.
The patients with APE who had evidence of hemodynamic instability (defined as systolic blood pressure [SBP] of <90 mmHg for >15 min, drop in SBP of 40 mmHg or more from baseline, or requiring hemodynamic support) or cardiac arrest within 24 h of the APE diagnosis were defined as high-risk PE. Intermediate-high-risk, intermediate-low-risk, and low-risk PE were classified along with the 2019 ESC guideline in the absence of hemodynamic instability.
Variables, Data sources/Measurement
Patient’s data, including demographics, symptoms, signs (observed within the first 24 h of diagnosis), risk factors, co-morbidities, investigations (including electrocardiography, chest radiography, arterial blood gas, Troponin-T, pro-BNP, and echocardiography), treatments and outcomes, PESI score, and simplified PESI score (sPESI) were recorded and reviewed. The 2019 ESC risk stratifications were also evaluated, and any subjects with missing data required to calculate either the PESI or sPESI score were excluded. The variables in the PESI, sPESI, and 2019 ESC risk stratification are presented in Supplemental Tables 1 and 2. PE-related deaths were recorded when death was caused by PE. The study protocol was approved by the ethics committee of Chiang Mai University Hospital [Institutional Review Board approval number: MED-2564-08294].
Supplemental Table 1. PESI, sPESI and PESI, sPESI classification
6, 7)
| Parameter |
Original PESI |
Simplified version (sPESI) |
| Age |
Age in years |
1 point (if age > 80 years) |
| Male sex |
+10 |
- |
| Cancer |
+30 |
1 point |
| Chronic heart failure |
+10 |
1 point |
| Chronic pulmonary disease |
+10 |
|
| Heart rate ≥ 110 beats/min |
+20 |
1 point |
| Systolic blood pressure <100 mm Hg |
+30 |
1 point |
| Respiratory rate >30 breaths/min |
+20 |
- |
| Temperature <36℃ |
+20 |
- |
| Altered mental status |
+60 |
- |
| Arterial oxygen saturation <90% |
+20 |
1 point |
|
Risk strata
|
|
|
Class I: ≤ 65 points
|
0 point = Low risk
|
|
Class II: 66-85 points
|
≥ 1 points = High risk
|
|
Class III: 86-105 points
|
|
|
Class IV: 106-125 points
|
|
|
Class V: > 125 points
|
|
Abbreviations: PESI, Pulmonary Embolism Severity Index; sPESI, simplified pulmonary embolism severity index
Supplemental Table 2. 2019 ESC risk stratification of pulmonary embolism severity and the risk of early (in-hospital or 30 day) death
12)
| Early mortality risk |
Indicators of risk |
| Hemodynamic instability |
PESI class III-V or sPESI ≥ 1 |
RV dysfunction on TTE or CTPA |
Elevated cardiac troponin level |
| High |
|
+ |
(+) |
+ |
(+) |
| Intermediate |
Intermediate-high |
- |
+ |
+ |
+ |
|
Intermediate-low |
- |
+ |
One (or none) positive |
| Low |
|
- |
- |
- |
Assessment optional;
if assessed, negative
|
Abbreviations: PESI, Pulmonary Embolism Severity Index; RV, right ventricle; TTE, transthoracic echocardiography; CTPA, computed tomographic pulmonary angiography.
Categorical data are expressed as numbers and percentages and continuous data as mean and standard deviation or median and interquartile range based on their distributions. Fisher’s exact test was employed to compare the categorical data between the survivor and non-survivor groups. Risk regressions were conducted to identify the PESI risk classification, sPESI, and 2019 ESC risk stratification as a predictor for 30-day all-cause mortality and PE-related death. The results were expressed as risk ratio (RR) together with a 95% confidence interval (CI) for RR. To determine the diagnostic ability of the PESI score, sPESI score, PESI risk classification, and 2019 ESC risk stratification to predict 30-day mortality, receiver operating characteristic (ROC) curves were constructed by plotting the true-positive rate (sensitivity) against the false-positive rate (1-specificity) for each scale level of the predictor variables for two dichotomous outcomes (non-survivor and survivor). The ROCs across the PESI score, sPESI score, PESI risk classification, and 2019 ESC risk stratification were compared. Statistical significance was accepted at P<0.05. All statistical analyses were conducted using STATA version 16 (StataCorp, College Station, TX, USA).
Results
A total of 1,560 patient records were obtained from the ICD-10 coding diagnosis from January 2011 to December 2020, of which 864 were excluded due to age below 15 years, non-Asian ethnicity, repeated cases and lack of CT confirming the APE diagnosis, wrong or ambiguous diagnosis, incorrect coding, diagnosis of chronic thromboembolic pulmonary hypertension, and missing data required to calculate either the PESI or sPESI score (Fig.1). A total of 696 patients (male, 41.1%) were included in the study. Their age varied from 15 to 98 years old, and the mean age was 57.7±15.7 years. The baseline characteristics of the patients with APE divided according to the survival status at 30 days from the acute event are presented in Table 1. Non-survivors had higher PESI (132.3±36.0 vs. 103.9±31.6) and sPESI (2.5±1.0 vs. 1.7±1.0) scores. More data are presented in Table 1.

Table 1. Baseline characteristics of the 696 patients with Acute PE divided according to the survival status at 30 days from the acute event
| Characteristics |
Non-survivors (n = 133)
|
Survivors (n = 563)
|
p-value
|
| Age (years) |
59.2±14.3 |
57.4±15.9 |
0.228 |
| Male sex, n (%)
|
67 (50.4) |
219 (38.9) |
0.019 |
| Female sex, n (%)
|
66 (49.6) |
344 (61.1) |
|
| Underlying diseases |
|
|
|
| Heart failure |
8 (6.0) |
34 (6.0) |
1.000 |
| Hypertension |
54 (40.6) |
251 (44.6) |
0.438 |
| DM |
23 (17.3) |
91 (16.2) |
0.419 |
| Obesity |
2 (1.5) |
10 (1.8) |
1.000 |
| OSA |
0 (0.0) |
15 (2.7) |
0.088 |
| COPD |
11 (8.3) |
27 (4.8) |
0.135 |
| Clinical APE |
|
|
|
| Suspected PE |
101 (75.9) |
356 (63.2) |
0.006 |
| Incidental PE |
29 (21.8) |
199 (35.4) |
0.003 |
| Risk factors |
|
|
|
| Active malignancy |
100 (75.2) |
283 (50.4) |
<0.001 |
| Surgery (<4 week) |
21 (15.8) |
120 (21.4) |
0.187 |
| Immobilization |
50 (37.6) |
161 (28.6) |
0.047 |
| Long travel |
1 (0.8) |
9 (1.6) |
0.696 |
| Unprovoked PE |
13 (9.8) |
123 (21.8) |
0.004 |
| Current DVT (Acute DVT proven by imaging) |
51 (38.3) |
194 (34.5) |
0.674 |
| Previous DVT, PE |
7 (5.3) |
38 (6.8) |
0.100 |
| Symptoms and signs |
|
|
|
| Dyspnea |
109 (82.0) |
344 (61.3) |
<0.001 |
| Chest pain |
14 (10.5) |
98 (17.5) |
0.018 |
| Syncope |
14 (10.5) |
40 (7.1) |
0.207 |
| Tachycardia (Heart rate ≥ 110 ) |
89 (66.9) |
237 (42.2) |
<0.001 |
| Tachypnea (Respiratory rate ≥ 30 ) |
51 (38.3) |
107 (19.0) |
<0.001 |
| Systolic BP (mmHg) |
110.4±22.2 |
117.8±21.7 |
0.001 |
| Diastolic BP (mmHg) |
68.9±14.3 |
73.1±13.7 |
0.002 |
| Shock (BP<90/60 mmHg ) |
30 (22.6) |
47 (8.3) |
<0.001 |
| SpO2 <90%
|
89 (67.4) |
244 (43.8) |
<0.001 |
| Respiratory failure (need ETT & MV support) |
48 (36.1) |
81 (14.4) |
<0.001 |
| Investigations |
|
|
|
| Sinus tachycardia |
|
|
|
| S1Q3T3 |
35 (26.3) |
125 (22.2) |
0.470 |
| Right ventricular strain pattern EKG |
21 (15.8) |
91 (16.2) |
0.728 |
| RV dysfunction (n = 332)
|
26 (42.6) |
106 (39.1) |
0.665 |
| RV/LV >1 |
43 (32.3) |
147 (26.1) |
0.160 |
| Mediastinal (central) level emboli |
51 (38.3) |
259 (46.0) |
0.121 |
| Troponin-T (median, IQR) (N = 228) |
122.0 (34.0, 233.3) |
40.2 (16.0, 114.5) |
0.002 |
| D-dimer (median, IQR) (N = 129) |
12,820.0 (7,058.0, 32,909.0) |
7,316.0 (3,898.0, 14,389.0) |
0.024 |
| Clinical scores |
|
|
|
| PESI score |
132.3±36.0 |
103.9±31.6 |
<0.001 |
| Simplified PESI score |
2.5±1.0 |
1.7±1.0 |
<0.001 |
Note: Data are presented as mean±SD or n (%) and median, IQR for D-dimer, Troponin-T
Abbreviations: DM, diabetes mellitus; OSA, obstructive sleep apnea; COPD, chronic obstructive pulmonary disease; PE, pulmonary emboli; DVT, deep vein thrombosis, BP, blood pressure; RV, right ventricle; LV, left ventricle; SpO2, pulse oximetry; PESI, Pulmonary Embolism Severity Index
The number of patients according to the PESI classification and 2019 ESC risk stratification are presented in Table 2. The lowest proportion was PESI class I (8.9%), and the highest proportion was PESI class V (27.9%). The 2019 ESC risk stratification was as follows: low-risk, 146 (21.0%); intermediate-low-risk, 376 (54.0%); intermediate-high-risk, 96 (13.8%); and high-risk, 78 (11.2%). More data are presented in Table 2.
Table 2. Number of patients according to PESI score, PESI classification and 2019 ESC risk stratification
| PESI classification (n = 696)
|
N (%) |
| I |
62 (8.9) |
| II |
98 (14.1) |
| III |
191 (27.4) |
| IV |
151 (21.7) |
| V |
194 (27.9) |
| 2019 ESC risk stratification (n = 696)
|
|
| Low-risk |
146 (21.0) |
| Intermediate-low |
376 (54.0) |
| Intermediate-high |
96 (13.8) |
| High-risk |
78 (11.2) |
Abbreviations: PESI, Pulmonary Embolism Severity Index; ESC, European Society of Cardiology
The PESI classification according to high-risk of the 2019 ESC stratification is presented in Table 3. Most of the high-risk cases of the 2019 ESC risk stratification were in PESI class V. There were no high-risk cases of the 2019 ESC risk stratification in PESI classes I and II. More data are presented in Table 3.
Table 3. PESI classification according to high-risk of 2019 ESC risk stratification
| PESI classification |
High-risk (n = 78)
|
p-value
|
| I |
0 (0.0) |
|
| II |
0 (0.0) |
|
| III |
1 (1.3) |
<0.001 |
| IV |
12 (15.4) |
|
| V |
65 (83.3) |
|
Abbreviations: PESI, Pulmonary Embolism Severity Index; ESC, European Society of Cardiology
The 30-day all-cause and PE-related mortalities are presented in Table 4. The all-cause mortality according to the PESI classification and the 2019 ESC risk stratification was the lowest and highest in the low- and high-risk classes, respectively. The PE-related mortality was also the lowest and highest in the low- and high-risk classes, respectively. More data are presented in Table 4.
Table 4. All-causes mortality and PE-related mortality according to PESI classification and 2019 ESC risk stratification at 1 month
| Classification |
All-causes death at 1 month (n = 133)
|
PE-related death at 1 month (n = 39)
|
p-value
|
| PESI classification (n = 696)
|
|
|
<0.001 |
| I (n = 62)
|
4 (6.5) |
0 (0.0) |
|
| II (n = 98)
|
6 (6.1) |
1 (1.0) |
|
| III (n = 191)
|
22 (11.5) |
2 (1.0) |
|
| IV (n = 151)
|
27 (17.9) |
3 (2.0) |
|
| V (n = 194)
|
74 (38.1) |
33 (17.0) |
|
| 2019 ESC risk stratification (n = 696)
|
|
|
<0.001 |
| Low-risk (n = 146)
|
9 (6.2) |
1 (0.7) |
|
| Intermediate-low (n = 376)
|
72 (19.1) |
3 (0.8) |
|
| Intermediate-high (n = 96)
|
22 (22.9) |
12 (12.5) |
|
| High-risk (n = 78)
|
30 (38.5) |
23 (29.5) |
|
Note: Data are n (%)
Abbreviations: PESI, Pulmonary Embolism Severity Index; ESC, European Society of Cardiology
The risk of 30-day all-cause mortality progressively increased with the 2019 ESC risk stratification, being approximately 6-fold higher in the high-risk than in the low-risk class [adjusted risk ratio (ARR): 6.24 (95% CI; 3.12, 12.47), P<0.001]. The risk of 30-day all-cause mortality with the PESI risk class also increased with the risk class, being approximately 6-fold higher in class V than in class I ((ARR: 5.91 (95% CI; 2.25, 15.51), P<0.001), as presented in Table 5.
Table 5. Risk of all-causes mortality at 30-day after acute PE according to the 2019 ESC risk stratification, PESI classification, and sPESI classification
| Classification |
Risk ratio |
95%CI |
p-value
|
| 2019 ESC risk stratification |
|
|
|
| Low-risk |
1 (reference) |
|
|
| Intermediate-low |
3.11 |
1.59, 6.05 |
0.001 |
| Intermediate-high |
3.72 |
1.79, 7.73 |
<0.001 |
| High-risk |
6.24 |
3.12, 12.47 |
<0.001 |
| PESI classification |
|
|
|
| I |
1 (reference) |
|
|
| II |
0.95 |
0.28, 3.23 |
0.933 |
| III |
1.79 |
0.64, 4.98 |
0.268 |
| IV |
2.77 |
1.01, 7.59 |
0.047 |
| V |
5.91 |
2.25, 15.51 |
<0.001 |
| sPESI |
|
|
|
| sPESI score |
1.66 |
1.50, 1.83 |
<0.001 |
| sPESI classification |
|
|
|
| 0 |
1 (reference) |
|
|
| ≥ 1 |
4.46 |
1.46, 13.62 |
0.009 |
Notes: Data obtained from the 696 patients with acute PE (all the 133 Non-survivors and 563 of the survivors)
Abbreviations: PESI, Pulmonary Embolism Severity Index; sPESI, simplified Pulmonary Embolism Severity Index; ESC, European Society of Cardiology
The 1-month PE-related mortality also progressively increased with the 2019 ESC risk stratification and PESI risk classification, being 43-fold higher in the high-risk than in the low-risk class [ARR=43.05 (95% CI 5.93, 312.79), P<0.001] being 27-fold higher in class V than in classes I and II [ARR=27.22 (95% CI; 3.76, 196.81), P=0.001] as presented in Table 6.
Table 6. Risk of 30-day PE-related death (
n = 39) after acute PE according to the 2019 ESC risk stratification, PESI classification, and sPESI
| Classification |
Risk ratio |
95%CI |
p-value
|
| 2019 ESC risk stratification |
|
|
|
| Low-risk |
1 (reference) |
|
|
| Intermediate-low |
1.55 |
0.18, 13.78 |
0.693 |
| Intermediate-high |
19.77 |
2.63, 148.68 |
0.004 |
| High-risk |
43.05 |
5.93, 312.79 |
<0.001 |
| PESI classification |
|
|
|
| I-II |
1 (reference) |
|
|
| III |
2.51 |
0.26, 23.92 |
0.423 |
| IV |
4.24 |
0.48, 37.49 |
0.194 |
| V |
27.22 |
3.76, 196.81 |
0.001 |
| sPESI |
|
|
|
| sPESI score |
2.19 |
1.74, 2.75 |
<0.001 |
| sPESI classification |
|
|
|
| 0 |
1 (reference) |
|
|
| ≥ 1 |
4.12 |
0.58, 29.48 |
0.158 |
Notes: Data obtained from the 696 patients with acute PE (PE related dead 39 and 657 of the survivors)
Abbreviations: PESI, Pulmonary Embolism Severity Score score; sPESI, simplified Pulmonary Embolism Severity Index; ESC, European Society of Cardiology
To estimate the predictive capability of the model, an ROC analysis was conducted, as presented in Fig.2, and comparison of the AuROC is shown in Table 7. The highest AuROC of the predictive model was the PESI score [AuROC=0.733 (95% CI; 0.685, 0.782)], and the AuROC of the sPESI and PESI classification was greater than 0.7, indicating a good discriminative power, except for the ESC risk stratification [AuROC=0.643 (95% CI; 0.596, 0.688)]. The AuROC of the ESC 2019 risk stratification was significantly lower than the others. More data are presented in Table 7.
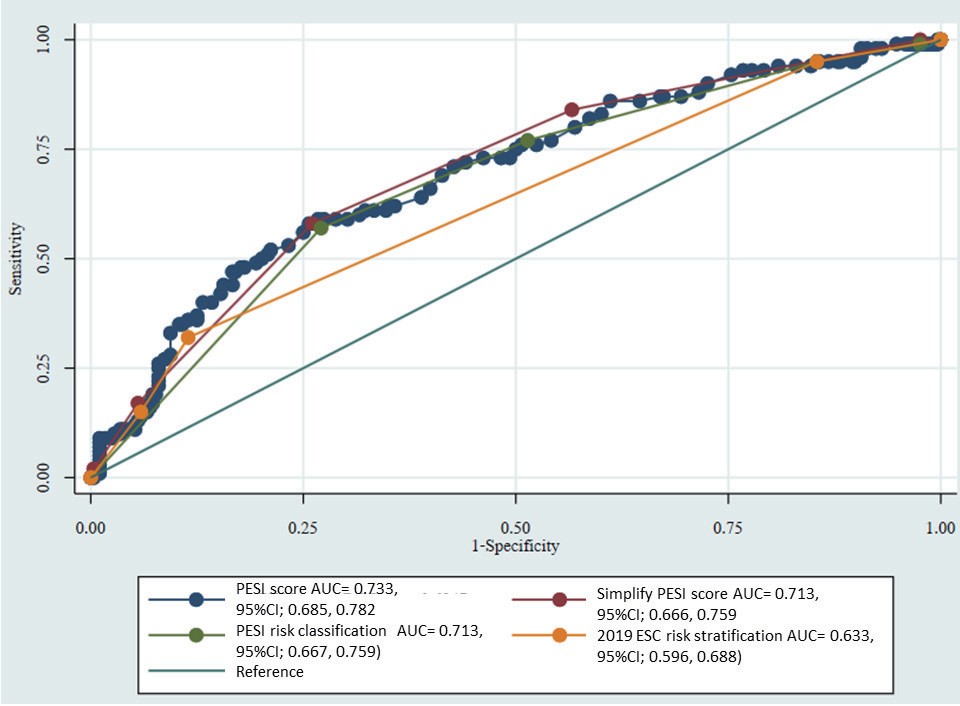
Table 7. Discriminatory power of the PESI score, sPESI score, PESI risk classification and 2019 ESC risk stratification
| Comparison AuROC (95%CI) |
p-value
|
| PESI score (0.733; 0.685, 0.782) |
sPESI score (0.713; 0.666, 0.759) |
0.173 |
| PESI score (0.733; 0.685, 0.782) |
PESI risk classification (0.713; 0.667, 0.759) |
0.010 |
| PESI score (0.733, 95%CI; 0.685, 0.782) |
2019 ESC risk stratification (0.643; 0.596, 0.688) |
<0.001 |
| sPESI score (0.713; 0.666, 0.759) |
PESI risk classification (0.713; 0.667, 0.759) |
0.963 |
| sPESI score (0.713; 0.666, 0.759) |
2019 ESC risk stratification (0.643; 0.596, 0.688) |
0.002 |
| PESI risk classification (0.713; 0.667, 0.759) |
2019 ESC risk stratification (0.643; 0.596, 0.688) |
<0.001 |
Abbreviations: PESI, Pulmonary Embolism Severity Score score; sPESI, simplified Pulmonary Embolism Severity Index; ESC, European Society of Cardiology
Discussion
The prediction of 30-day mortality after an APE diagnosis proposed by the 2019 ESC risk stratification, original PESI, sPESI, and PESI risk classification was validated in our study. We found that the all-cause mortality rate in 1 month was 19.1%, which is comparable to those in previous studies in Thailand (10.0%–21.3%)16-18) but is higher than those in previous studies in Europe and North America (9%–17%)19-24) as well as Korea (7.8%)25). The causes of death were mostly pneumonia, sepsis, and advanced cancers. The PE-related mortality was only 5.9%, and most of the PE-related deaths were massive PE cases (56%) and intermediate-high-risk PE cases (31.7%).
The PESI, sPESI, PESI risk classification, and 2019 ESC risk stratification were validated for the prediction of 30-day all-cause mortality in the Asian population with APE. We found that the 30-day risk of death proportionally increased with the 2019 ESC stratification. Furthermore, we demonstrated that the 30-day all-cause mortality increased by 3.1, 3.7, and 6.2 times in the intermediate-low-risk, intermediate-high-risk, and high-risk categories, respectively, as compared with the low-risk category. We also found that the 30-day risk of death proportionally increased with the PESI severity classification. For example, the 30-day all-cause mortality increased by 5.9 times in the PESI class V compared with the PESI class I. For the 30-day PE-related mortality, we found that it proportionally increased with the 2019 ESC stratification and PESI classification. The 1-month PE-related mortality progressively increased with the 2019 ESC risk stratification and PESI risk classification, being 43-fold higher in the high-risk than in the low-risk class and being 27-fold higher in class V than in classes I and II. Our results were supported by previous findings indicating that the mortality proportionally increased with the higher level of severity according to the PESI classification, sPESI, and 2019 ESC risk stratification8, 13, 14).
According to the AuROC, the predictive model including the PESI, sPESI, and PESI risk class exhibited a good discriminatory power, except for the 2019 ESC risk stratification. The prognostic accuracy from the AuROC was the highest in the original PESI scores (AuROC=0.733), whereas the simplified PESI scores (AuROC=0.713) and PESI risk classification (AuROC=0.713) did not differ but were higher than the 2019 ESC risk stratification (AuROC=0.643). Our results were comparable with the previous studies suggesting that the AuROC of the original PESI and simplified PESI for mortality prediction ranged from 0.70 to 0.78 and from 0.60 to 0.72, respectively13-15). Previous study in Brazil demonstrated that the AuROC of sPESI for mortality prediction was 0.60, which was lower than that in our study14). The AuROC of the 2019 ECS risk stratification for mortality prediction was 0.63 in the previous study, which is consistent with our results13).
Our results indicated that the original PESI, sPESI, PESI risk classification, and 2019 ESC risk stratification could predict 30-day all-cause and PE-related mortalities. The original PESI score had the highest AuROC for mortality prediction. Therefore, we preferred to recommend the use of the PESI score for classifying the 30-day all-cause and 30-day PE-related mortalities. However, the AuROC of the ECS 2019 risk stratification for mortality prediction was lower than 0.7. Thus, the PESI score should be used as the primary tool for the identification of low-risk patients who may be candidates for outpatient management.
The mortality data according to the PESI and sPESI risk classifications between the Western population and our study are presented in Table 8. Both the all-cause and PE-related mortalities according to the PESI and sPESI risk classification in our study were comparable with those in the study of the Western population6, 7). More data are presented in Table 8.
Table 8. The mortality data according to PESI and sPESI risk classification between the Western people and our study
| PESI (Aujesky et al)6)
|
sPESI (Jiminez et al)7)
|
PESI (Bumroongkit et al)
|
sPESI (Bumroongkit et al)
|
|
Class I: ≤ 65 points
very low 30 day mortality risk (0.0-1.6%)
|
0 points = 30 day mortality risk
1.0% (95%CI; 0.0, 2.1)
|
Class I: ≤ 65 points
PE-related death at 1 month = 0%
|
0 points
PE-related death at 1
month = 1.5% (95%CI; 0.0,
8.3)
|
|
Class II: 66-85 points
low mortality risk (1.7-3.5%)
|
|
Class II: 66-85 points
PE-related death at 1 month = 1.0%
(95%CI; 0.0, 5.5)
|
|
|
Class III:
86-105 points
moderate mortality risk (3.2- 7.1%)
|
≥ 1 point(s) = 30 day mortality
risk 10.9% (95%CI; 8.5, 13.2)
|
Class III: 86-105 points
PE-related death at 1 month = 1.0%
(95%CI; 0.0, 3.7)
|
≥1 point(s)
PE-related death at 1 month = 6.3%
(95%CI; 4.6, 8.5)
|
|
Class IV:
106-125 points
high mortality risk (4.0-11.4%)
|
|
Class IV: 106-125 points
PE-related death at 1 month = 2.0%
(95%CI; 0.0, 5.7)
|
|
|
Class V: >125 points
very high mortality risk (10.0- 24.5%)
|
|
Class V: >125 points
PE-related death at 1 month = 17.0%
(95%CI; 12.0, 23.0)
|
|
Abbreviations: PESI, Pulmonary Embolism Severity Score score; sPESI, simplified Pulmonary Embolism Severity Index
The strength of our study is that we enrolled only Southeast Asian patients. Therefore, the heterogeneity of the study population might be minimal. However, our study involved retrospective data collection, which limited the possibility to retrieve all patient information regarding some parameters for the correct definition of the ESC risk class for early mortality, such as biomarkers (for example, some cases in intermediate-risk patients would be classified as intermediate-high- or intermediate-low-risk patients).
Conclusions
Our study represents a good validation of the predictive models for 30-day mortality after APE diagnosis proposed by the sPESI, PESI score, PESI risk classification, and 2019 ESC risk stratification in the Southeast Asian population. However, the prognostic accuracy from the AuROC for the 30-day mortality prediction was higher in the PESI risk classification than in the 2019 ESC risk class stratification. The original PESI score has the highest accuracy.
Acknowledgements
The authors wish to acknowledge the contribution of the staff of the Division of Pulmonary, Critical Care and Allergy, Department of Internal Medicine, Faculty of Medicine, Chiang Mai University to this trial.
Conflict of Interest
The authors declared no potential conflicts of interest with respect to the research, authorship, and/or publication of this article.
Author Contributions
Study conception and design: (C.B.), data acquisition: (C.B., W.C.), data analysis: (C.B., W.C.), manuscript preparation and revision: (C.B., A.L., W.C.). The remaining authors conducted acquisition and interpretation of data and critical reviews of the manuscript. All authors read and approved the final manuscript.
Funding
This research did not receive any grant from funding agencies in the public, commercial, or not-for-profit sectors.
References
- 1) Jiménez D, Bikdeli B, Barrios D, Quezada A, Del Toro J, Vidal G, Mahé I, Quere I, Loring M, Yusen RD, Monreal M; RIETE investigators: Epidemiology, patterns of care and mortality for patients with hemodynamically unstable acute symptomatic pulmonary embolism. Int J Cardiol, 2018; 269: 327-333
- 2) Stein PD, Matta F: Treatment of unstable pulmonary embolism in the elderly and those with comorbid conditions. Am J Med, 2013; 126: 304-310
- 3) ISTH Steering Committee for World Thrombosis Day: Thrombosis: a major contributor to the global disease burden. J Thromb Haemost, 2014; 12: 1580-1590
- 4) Lee LH, Gallus A, Jindal R, Wang C, Wu CC: Incidence of Venous Thromboembolism in Asian Populations: A Systematic Review. Thromb Haemost, 2017; 117: 2243-2260
- 5) Chan CM, Woods C, Shorr AF: The validation and reproducibility of the pulmonary embolism severity index. J Thromb Haemost, 2010; 8: 1509-1514
- 6) Aujesky D, Obrosky DS, Stone RA, Auble TE, Perrier A, Cornuz J, Roy PM, Fine MJ: Derivation and validation of a prognostic model for pulmonary embolism. Am J Respir Crit Care Med, 2005; 172: 1041-1046
- 7) Jiménez D, Aujesky D, Moores L, Gómez V, Lobo JL, Uresandi F, Otero R, Monreal M, Muriel A, Yusen RD; RIETE Investigators: Simplification of the pulmonary embolism severity index for prognostication in patients with acute symptomatic pulmonary embolism. Arch Intern Med, 2010; 170: 1383-1389
- 8) Yamashita Y, Morimoto T, Amano H, Takase T, Hiramori S, Kim K, Oi M, Akao M, Kobayashi Y, Toyofuku M, Izumi T, Tada T, Chen PM, Murata K, Tsuyuki Y, Saga S, Sasa T, Sakamoto J, Kinoshita M, Togi K, Mabuchi H, Takabayashi K, Shiomi H, Kato T, Makiyama T, Ono K, Kimura T: Validation of simplified PESI score for identification of low-risk patients with pulmonary embolism: From the COMMAND VTE Registry. Eur Heart J Acute Cardiovasc Care, 2020; 9: 262-270
- 9) Aujesky D, Roy PM, Verschuren F, Righini M, Osterwalder J, Egloff M, Renaud B, Verhamme P, Stone RA, Legall C, Sanchez O, Pugh NA, N’gako A, Cornuz J, Hugli O, Beer HJ, Perrier A, Fine MJ, Yealy DM: Outpatient versus inpatient treatment for patients with acute pulmonary embolism: an international, open-label, randomised, non-inferiority trial. Lancet, 2011; 378: 41-48
- 10) Fraga M, Taffé P, Méan M, Hugli O, Witzig S, Waeber G, Aujesky D: The inter-rater reliability of the Pulmonary Embolism Severity Index. Thromb Haemost, 2010; 104: 1258-1262
- 11) Donzé J, Le Gal G, Fine MJ, Roy PM, Sanchez O, Verschuren F, Cornuz J, Meyer G, Perrier A, Righini M, Aujesky D: Prospective validation of the Pulmonary Embolism Severity Index. A clinical prognostic model for pulmonary embolism. Thromb Haemost, 2008; 100: 943-948
- 12) Konstantinides SV, Meyer G, Becattini C, Bueno H, Geersing GJ, Harjola VP, Huisman MV, Humbert M, Jennings CS, Jiménez D, Kucher N, Lang IM, Lankeit M, Lorusso R, Mazzolai L, Meneveau N, Áinle FN, Prandoni P, Pruszczyk P, Righini M, Torbicki A, Van Belle E, Zamorano JL; The Task Force for the diagnosis and management of acute pulmonary embolism of the European Society of Cardiology (ESC): 2019 ESC Guidelines for the diagnosis and management of acute pulmonary embolism developed in collaboration with the European Respiratory Society (ERS): The Task Force for the diagnosis and management of acute pulmonary embolism of the European Society of Cardiology (ESC). Eur Respir J, 2019; 54: 1901647
- 13) Moor J, Baumgartner C, Méan M, Stalder O, Limacher A, Rodondi N, Aujesky D: Validation of the 2019 European Society of Cardiology Risk Stratification Algorithm for Pulmonary Embolism in Normotensive Elderly Patients. Thromb Haemost, 2021; 121: 1660-1667
- 14) Soriano LA, Castro TT, Vilalva K, Borges MC, Pazin-Filho A, Miranda CH: Validation of the Pulmonary Embolism Severity Index for risk stratification after acute pulmonary embolism in a cohort of patients in Brazil. J Bras Pneumol, 2019; 45: e20170251
- 15) Venetz C, Jiménez D, Mean M, Aujesky D: A comparison of the original and simplified Pulmonary Embolism Severity Index. Thromb Haemost, 2011; 106: 423-428
- 16) Sompradeekul S, Ittimakin S: Clinical Characteristics and Outcome of Thai Patients with Acute Pulmonary Embolism. J Med Assoc Thai, 2007; 90: 59-67
- 17) Reechaipichitkul W, Wongthawa N: Etiologies and treatment of acute pulmonary embolism at Srinagarind Hospital. Asian Biomedicine, 2012; 6: 111-116
- 18) Palwatwichai A, Gaewtam-Manugul P, Apiratpracha W, Vattanathum A, Tantamacharik D, Wongsa A: Clinical and laboratory findings in patients with pulmonary embolism in Phramongkutklao Hospital. J Med Assoc Thai, 2000; 83: 1463-1470
- 19) Laporte S, Mismetti P, Décousus H, Uresandi F, Otero R, Lobo JL, Monreal M; RIETE Investigators: Clinical predictors for fatal pulmonary embolism in 15,520 patients with venous thromboembolism: findings from the Registro Informatizado de la Enfermedad TromboEmbolica venosa (RIETE) Registry. Circulation, 2008; 117: 1711-1716
- 20) Goldhaber SZ, Visani L, De Rosa M: Acute pulmonary embolism: clinical outcomes in the International Cooperative Pulmonary Embolism Registry (ICOPER). Lancet, 1999; 353: 1386-1389
- 21) Barco S, Mahmoudpour SH, Planquette B, Sanchez O, Konstantinides SV, Meyer G: Prognostic value of right ventricular dysfunction or elevated cardiac biomarkers in patients with low-risk pulmonary embolism: a systematic review and meta-analysis. Eur Heart J, 2019; 40: 902-910
- 22) Hobohm L, Becattini C, Konstantinides SV, Casazza F, Lankeit M: Validation of a fast prognostic score for risk stratification of normotensive patients with acute pulmonary embolism. Clin Res Cardiol, 2020; 109: 1008-1017
- 23) Andrade I, García A, Mercedes E, León F, Velasco D, Rodríguez C, Pintado B, Pérez A, Jiménez D: Need for Transthoracic Echocardiogram in Patients with Low-Risk Pulmonary Thromboembolism: A Systematic Review and Meta-Analysis. Arch Bronconeumol, 2020; 56: 306-313
- 24) Vanni S, Nazerian P, Pepe G, Baioni M, Risso M, Grifoni G, Viviani G, Grifoni S: Comparison of two prognostic models for acute pulmonary embolism: clinical vs. right ventricular dysfunction-guided approach. J Thromb Haemost, 2011; 9: 1916-1923
- 25) Park TY, Jung JW, Choi JC, Shin JW, Kim JY, Choi BW, Park IW: Epidemiological trend of pulmonary thromboembolism at a tertiary hospital in Korea. Korean J Intern Med, 2017; 32: 1037-1044
