Abstract
Aims: Blood pressure variability (BPV) was associated with the clinical outcomes in patients with acute ischemic stroke (AIS) due to large-vessel occlusion (LVO) after endovascular treatment (EVT). This study aimed to investigate whether the use of antihypertensive drugs could affect this association in patients with AIS-LVO after EVT.
Methods: We retrospectively screened consecutive patients with AIS-LVO who had successful recanalization after EVT and calculated their systolic BPV (SBPV) during the first 24 h after EVT using eight statistical methodologies based on previously published literature. Poor outcome was defined as a modified Rankin Scale score of 3–6 at 90 days. Logistic regression analysis was performed to assess this association, and different prediction models were constructed to assess the effect of the use of antihypertensive drugs.
Results: A total of 214 patients were finally included, including 92 (43.0%) with good outcomes, and 136 (63.6%) who received antihypertensive drugs. SBPV indicators were significantly lower in patients with good outcomes versus those with poor outcomes. The logistic analysis showed that all SBPV indicators were consistently associated with poor outcomes (odds ratio, 1.031–1.282, all P<0.05) in all populations, which was confirmed in patients not using antihypertensive drugs. However, no SBPV indicator was found to be associated with poor outcomes in patients using antihypertensive drugs. Receiver operating characteristic curves showed that the area under the curve (AUC) was larger in the model adjusting for antihypertensive drugs (AUC 0.774–0.783) compared with the one not adjusted for antihypertensive drugs (AUC 0.739–0.754).
Conclusion: In the anterior circulation of patients with AIS-LVO who had successful recanalization after EVT, the utilization of antihypertensive drugs may have some impact on the relationship between SBPV and clinical outcomes.
Introduction:
Endovascular treatment (EVT) has become the standard treatment for acute ischemic stroke (AIS) with large-vessel occlusion (LVO)1, 2). Despite highly successful reperfusion after EVT, about half of patients do not regain their functional independence2). Many factors such as age, time from onset to recanalization, hypertension, stroke severity, and blood glucose, among others, are associated with clinical outcomes1). Among them, blood pressure (BP) has been widely investigated, but there is still no consensus on the optimal target BP control for patients with AIS after EVT. For patients with AIS who have achieved successful recanalization after EVT, it has been suggested that the systolic BP should be controlled within 180 mmHg1, 3-5). The ENCHANTED2/MT study suggested that the lower safe limit for BP management is 120 mmHg6), although BP TARGET reported a neutral result7). Therefore, BP control in the acute phase after EVT remains a matter of debate.
In recent years, multiple studies have indicated that BP variability (BPV) is an independent risk factor for a poor prognosis in stroke patients. BPV has emerged as a potential new therapeutic target, independent of the average absolute BP level8, 9). When investigating the impact of BPV on stroke prognosis, many studies have included patients who received antihypertensive drugs, but few have investigated the potential effects of these drugs on BPV and outcomes8, 10). We hypothesize that the utilization of antihypertensive drugs could impact the correlation between BPV and stroke prognosis. In this study, we aimed to investigate whether the use of antihypertensive drugs affects the association between systolic BPV (SBPV) and the prognosis in patients with AIS-LVO who have achieved successful recanalization after EVT.
Methods:
Patient Selection
This retrospective study was approved by the institutional review board of the General Hospital of Northern Theater Command (IRB: y (2021)013) with a waiver of informed consent. We screened consecutive patients with AIS-LVO who underwent EVT in our stroke center between May 2018 and December 2021. The inclusion criteria were as follows: 1) Age ≥ 18 years; 2) Modified Rankin Scale (mRS) score before onset ≤ 1; 3) Patients with acute anterior circulation LVO who underwent EVT within 24 h of onset; 4) Successful reperfusion (modified Thrombolysis in Cerebral Infarction [mTICI] grade 2B-3) after EVT; and 5) A complete BP data (recorded at baseline and hourly for at least 24 h after EVT). Patients were excluded for the following reasons: 1) intra-arterial thrombolysis; 2) unqualified digital subtraction angiography (DSA) data (including poor quality or incomplete DSA imaging); and 3) inadequate clinical data. We followed the Chinese guidelines for the endovascular treatment of AIS 2018 as a basis for the management of patients with AIS-LVO, in which SBP was suggested to be controlled below 140 mmHg after successful revascularization (mTICI 2b-3)11).
Data Collection
Data on demographics, cerebrovascular disease-related history, clinical features, imaging features, procedural variables, and antihypertensive drug use were collected. Intracerebral hemorrhage (ICH) refers to the presence of any ICH (except subarachnoid hemorrhage) on a CT scan within 72 h post-EVT. The reperfusion was graded using the mTICI score system, and successful recanalization was defined as mTICI 2b-3 12).
SBPV Parameters
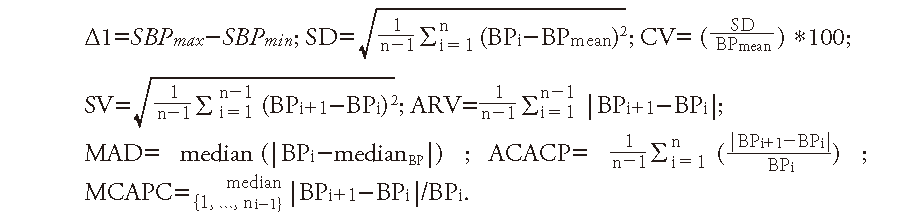
The hourly SBP measurements of all patients were performed using automatic sphygmomanometers prior to EVT and during the first 24 h following EVT. For each patient, the maximum and minimum SBP were calculated. To comprehensively investigate the association of SBPV with clinical outcomes, we calculated the SBPV within 24 h after EVT using eight statistical methodologies based on previously published literature13, 14): BP difference (Δ1), standard deviation (SD), coefficient of variation (CV), successive variation (SVxref ref-type="bibr"), average real variability (ARV), median absolute deviation (MAD), average consecutive absolute change percentage (ACACP), and median continuous absolute percentage change (MCAPC). The SBPV formulas are as follows:
Clinical Outcomes
Good or poor functional outcomes were defined as mRS 0–2 and mRS 3–6 at 90 days after stroke, respectively.
Statistical Analysis
In the case of a normal distribution, continuous data are expressed as the mean±standard deviation, otherwise as the median (interquartile range, IQR). Categorical data are expressed in n (%). The comparison between the good outcome and poor outcome groups was performed using Student’s t-test for continuous variables, Mann–Whitney U test for non-Gaussian continuous or ordinal variables, and the χ2 test for categorical variables. Logistic regression analysis was performed to assess the prediction of SBPV on the prognosis, and two prediction models were constructed (model 1: adjusted for diabetes, admission NIHSS, mTICI, onset-to-reperfusion time (ORT), use of antihypertensive drugs, and ICH; model 2: adjusted for diabetes, admission NIHSS, mTICI, ORT, and ICH), and receiver operating characteristic (ROC) curve analysis was performed to assess whether the use of antihypertensive drugs affects the predictive ability of SBPV on the prognosis. Subgroup analyses were performed based on the use of antihypertensive drugs during or after EVT (yes vs. no). For the subgroup analyses, the multivariate model included diabetes, admission NIHSS, mTICI, ORT, and ICH, and had a significant difference between the good outcome and poor outcome groups (P value <0.05; model 2). Associations are presented as odds ratios (ORs) with corresponding 95% confidence interval (CI). All statistical analyses were done using IBM SPSS version 26.0 (IBM Inc), and a P value of <0.05 was considered statistically significant.
Results:
We retrospectively screened 398 consecutive patients with AIS-LVO who received EVT. After excluding cases related to posterior circulation (n=78), arterial thrombolysis (n=18), unavailable DSA images (n=9), pre-stroke disability (mRS ≥ 2) (n=4), unsuccessful reperfusion after EVT (mTICI 0-2a) (n=57), and incomplete clinical data (n=18), a total of 214 patients were enrolled for the final analysis (Fig.1). Table 1 presents an overview of the baseline demographic characteristics of the study population. Out of the 214 patients, 92 (43%) had good outcomes, 148 (69.2%) achieved complete recanalization (mTICI 3), 48 (22.4%) received combined intravenous thrombolysis, and 136 (63.6%) received antihypertensive drugs either during or within 24 h after EVT. The median NIHSS score at admission was 14 points (12–17). Compared with patients with good outcomes, those with poor outcomes had a higher prevalence of diabetes mellitus and hemorrhagic transformation, and longer onset-to-puncture time and ORT. All SBPV measures were significantly higher in patients with poor outcomes versus those with good outcomes. Univariate logistic regression analysis showed that diabetes, admission NIHSS, mTICI, ORT, antihypertensive drug use, ICH, and SBPV parameters were all significantly associated with poor outcomes after EVT. In the multivariate logistic regression analysis adjusted for diabetes, admission NIHSS, ORT, mTICI, antihypertensive drug use, and ICH, seven of the eight SBPV indicators remained significantly associated with poor outcomes (OR, 1.031–1.282, Table 2).
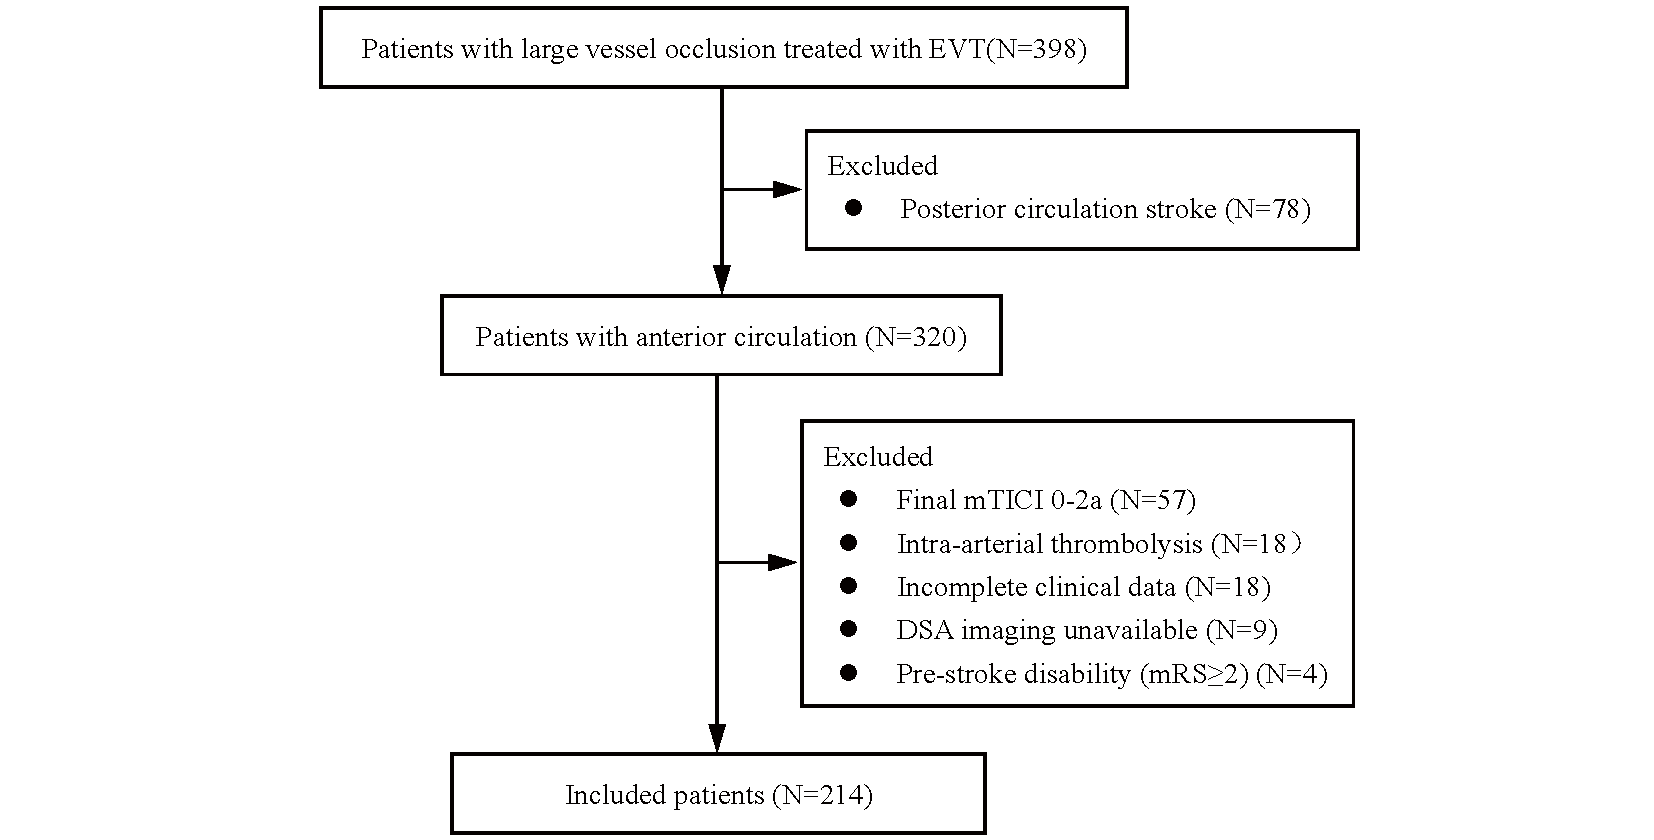
Table 1.Baseline characteristics of 214 patients
|
ALL subjects(N = 214) |
Good outcome(N = 92) |
Poor outcome(N = 122) |
P-value
|
| Demographics |
|
|
|
|
| Male |
156 (72.9%) |
68 (73.9%) |
88 (72.1%) |
0.772 |
| Age |
64 (55.8-73) |
63 (54.5-70.8) |
65 (55.8-75) |
0.112 |
| Hypertension |
110 (51.4%) |
49 (53.3%) |
61 (50.0%) |
0.637 |
| Diabetes |
48 (22.4%) |
14 (15.2%) |
34 (27.9%) |
0.028 |
| Atrial fibrillation |
71 (33.2%) |
31 (33.7%) |
40 (32.8%) |
0.889 |
| Prior stroke |
54 (25.2%) |
22 (23.9%) |
32 (26.2%) |
0.699 |
| Current smoking |
128 (59.8%) |
53 (57.6%) |
75 (61.5%) |
0.568 |
| Current drinking |
102 (47.7%) |
41 (44.6%) |
61 (50.0%) |
0.431 |
| Clinical and imaging features |
|
|
|
|
| Admission SBP |
148 (132-169) |
145 (126.5-165.3) |
151 (135-170) |
0.113 |
| Mean SBP |
126.6±11.5 |
125.6±12.3 |
127.4±10.9 |
0.251 |
| Admission NIHSS |
14 (12-17) |
13 (10-16) |
15 (13-18) |
0.001 |
| Admission ASPECT |
9 (7-10) |
9 (8-10) |
8 (7-10) |
0.286 |
| IVT treatment |
48 (22.4%) |
23 (25%) |
25 (20.5%) |
0.434 |
| Vessel occlusion site |
|
|
|
0.085 |
| ICA |
68 (31.8%) |
26 (28.3%) |
42 (34.4%) |
|
| MCA-M1 |
120 (56.1%) |
59 (64.1%) |
61 (50.0%) |
|
| MCA-M2 |
4 (1.9%) |
0 (0%) |
4 (3.3%) |
|
| ICA+M1 |
22 (10.3%) |
7 (7.6%) |
15 (12.3%) |
|
| mTICI, n (%)
|
|
|
|
0.012 |
| 2b |
66 (30.8%) |
20 (21.7%) |
46 (37.7%) |
|
| 3 |
148 (69.2%) |
72 (78.3%) |
76 (62.3%) |
|
| TOAST type |
|
|
|
0.594 |
| LAA |
118 (55.1%) |
48 (52.2%) |
70 (57.4%) |
|
| Cardio embolism |
71 (33.2%) |
34 (37.0%) |
37 (30.3%) |
|
| Undetermined |
25 (11.7%) |
10 (10.9%) |
15 (12.3%) |
|
| OPT |
340 (243.8-499.3) |
312.5 (226.3-489.5) |
380.5 (255-507.8) |
0.035 |
| DPT |
52 (38-101) |
47.5 (34-97.5) |
57 (40-106.3) |
0.147 |
| ORT |
430 (326.8-598) |
385.5 (298.3-555.8) |
483.5 (360-617) |
0.005 |
| Anti-hypertensive drug |
136 (63.6%) |
43 (46.7%) |
93 (76.2%) |
<0.001 |
| ICH |
62 (29%) |
16 (17.4%) |
46 (37.7%) |
0.001 |
| BPV index |
|
|
|
|
| Δ1 |
37 (29-47) |
33 (28-42.3) |
41 (32-50.3) |
<0.001 |
| SD |
9.2 (7.3-11.8) |
8.5 (7.2-10.8) |
9.9 (7.6-12.7) |
0.004 |
| CV |
7.5 (5.8-9.2) |
6.8 (5.4-8.3) |
7.8 (6.2-9.7) |
0.010 |
| SV |
9.8 (7.9-12.3) |
9.4 (7.1-11) |
10.2 (8.1-13.3) |
0.006 |
| ARV |
7.5 (6.2-9.4) |
7 (5.4-8.7) |
8 (6.6-9.9) |
0.003 |
| MAD |
5.5 (4-7.5) |
5.3 (3.5-7.5) |
6 (4-7.6) |
0.046 |
| ACACP |
6.0 (4.9-7.5) |
5.6 (4.4-7.1) |
6.2 (5.2-7.7) |
0.009 |
| MCAPC |
4.5 (3.7-5.9) |
4.3 (3.3-5.8) |
4.7 (4-6) |
0.025 |
All data were expressed as n (%) or median (IQR). SBP, systolic blood pressure; Mean SBP, mean SBP during the period of BPV ascertainment; NIHSS, National Institutes of Health Stroke Scale; ASPECTS, Alberta Stroke Program Early CT Score; IVT, Intravenous thrombolysis; ICA, internal cervical artery; MCA, middle cerebral artery; mTICI, modified Thrombolysis in Cerebral Infarction; LAA, large artery atherosclerosis; OPT, onset to puncture time; DPT, door to puncture time; ORT, onset-to-reperfusion time; ICH, intracranial hemorrhage; Δ1, SBP max- SBP min; SD, standard deviation; CV, coefficient of variation; SV, successive variation; ARV, average real variability; MAD, median absolute deviation and ACACP, average consecutive absolute change percentage; MCAPC, median continuous absolute percentage change and TOAST.
Table 2.Univariable and multivariable logistic regression analysis to predict poor prognosis
|
Unadjusted |
Adjusted |
| OR (CI 95%) |
P
|
OR (CI 95%) |
P
|
| Diabetes |
2.153 (1.076 - 4.305) |
0.030 |
|
|
| Admission NIHSS |
1.126 (1.052 - 1.206) |
0.001 |
|
|
| mTICI |
2.179 (1.177 - 4.034) |
0.013 |
|
|
| Onset-to-reperfusion time |
1.001 (1.000 - 1.002) |
0.030 |
|
|
| Anti-hypertensive drug |
3.654 (2.037 - 6.556) |
<0.001 |
|
|
| Intracranial hemorrhage |
2.875 (1.498 - 5.516) |
0.001 |
|
|
| BPV index |
|
|
|
|
| Δ1 |
1.039 (1.016 - 1.062) |
0.001 |
1.031 (1.006-1.056) |
0.014 |
| SD |
1.129 (1.041 - 1.225) |
0.003 |
1.103 (1.007-1.209) |
0.035 |
| CV |
1.160 (1.042 - 1.291) |
0.007 |
1.135 (1.006-1.279) |
0.039 |
| SV |
1.138 (1.041 - 1.244) |
0.004 |
1.131 (1.019 - 1.254) |
0.021 |
| ARV |
1.214 (1.069 - 1.378) |
0.003 |
1.203 (1.038 - 1.395) |
0.014 |
| MAD |
1.124 (1.011 - 1.250) |
0.030 |
1.126 (0.995 - 1.274) |
0.059 |
| ACACP |
1.271 (1.077 - 1.499) |
0.005 |
1.282 (1.058 - 1.553) |
0.011 |
| MCAPC |
1.219 (1.019 - 1.460) |
0.031 |
1.232 (1.007 - 1.508) |
0.043 |
Adjusted for diabetes, admission NIHSS, mTICI, onset-to-reperfusion time, intracranial hemorrhage, anti-hypertensive drug. ICH, intracranial hemorrhage; Δ1, SBP max- SBP min; SD, standard deviation; CV, coefficient of variation; SV, successive variation; ARV, average real variability; MAD, median absolute deviation and ACACP, average consecutive absolute change percentage; MCAPC, median continuous absolute percentage change.
Of 136 patients receiving antihypertensive drugs during or the first 24 h after EVT, 48 (35.3%) received nicardipine, 43 (31.6%) received urapidil, and 45 (33.1%) received a combination of nicardipine and urapidil. Table 3 shows the baseline characteristics of the patients who received antihypertensive drugs versus those who did not use antihypertensive drugs. Older age, higher admission SBP and NIHSS, and longer ORT were found in patients who used antihypertensive drugs. A higher proportion of good outcomes was found in the patients who did not use antihypertensive drugs (Table 3, Fig.2). Notably, there was no difference in the baseline SBPV indicators between the two groups (P>0.05, Table 3).
Table 3.Baseline characteristics stratified by antihypertensive medication
|
Antihypertensive drugs (+) |
antihypertensive drugs (-) |
P-value
|
| male, n (%)
|
98 (72.1) |
58 (74.4) |
0.716 |
| Age, median (IQR) |
65.0 (57.3-74.8) |
61.5 (53.0-70.0) |
0.014 |
| Hypertension, n (%)
|
75 (55.1) |
35 (44.9) |
0.148 |
| Diabetes, n (%)
|
35 (25.7) |
13 (16.7) |
0.126 |
| Atrial fibrillation, n (%)
|
46 (33.8) |
25 (32.1) |
0.791 |
| Prior stroke, n (%)
|
34 (25.0) |
20 (25.6) |
0.917 |
| Current smoking, n (%)
|
80 (58.8) |
48 (61.5) |
0.697 |
| Current drinking, n (%)
|
69 (50.7) |
33 (42.3) |
0.235 |
| Admission SBP, median (IQR) |
157.5 (140.0-177.0) |
135.0 (124.5-153.3) |
<0.001 |
| Mean SBP, median (IQR) |
127.5 (120.1-134.4) |
125.2 (116.8-131.3) |
0.091 |
| Admission NIHSS, median (IQR) |
16.0 (12.0-18.0) |
13.0 (10.0-15.3) |
<0.001 |
| Admission ASPECT, median (IQR) |
8.0 (7.0-10.0) |
9.0 (7.0-10.0) |
0.656 |
| IVT treatment, n (%)
|
30 (22.1) |
18 (23.1) |
0.864 |
| Vascular occlusion site, n (%)
|
|
|
0.034 |
| ICA |
49 (36.0) |
19 (24.4) |
|
| MCA-M1 |
67 (49.3) |
53 (67.9) |
|
| MCA-M2 |
2 (1.5) |
2 (2.6) |
|
| ICA+M1 |
18 (13.2) |
4 (5.1) |
|
| mTICI, n (%)
|
|
|
0.347 |
| 2B |
45 (33.1) |
21 (26.9) |
|
| 3 |
91 (66.9) |
57 (73.1) |
|
| TOAST type, n (%)
|
|
|
0.629 |
| LAA |
78 (57.4) |
40 (51.3) |
|
| Cardio embolism |
42 (30.9) |
29 (37.2) |
|
| Undetermined |
16 (11.8) |
9 (11.5) |
|
| OPT, min, median (IQR) |
350.0 (241.3-533.8) |
331.0 (244.5-468.5) |
0.323 |
| DPT, min, median (IQR) |
54.0 (40.0-108.8) |
51.5 (33.5-87.5) |
0.222 |
| ORT, min, median (IQR) |
456.0 (330.0-620.0) |
391.5 (303.0-528.8) |
0.045 |
| BPV index |
|
|
|
| Δ1, median (IQR) |
38.0 (29.0-48.8) |
36.0 (28.0-44.0) |
0.189 |
| SD, median (IQR) |
9.2 (7.3-12.0) |
9.2 (7.4-11.6) |
0.809 |
| CV, median (IQR) |
7.4 (5.6-9.2) |
7.8 (6.1-9.1) |
0.912 |
| SV, median (IQR) |
9.8 (8.0-12.3) |
9.8 (7.7-12.3) |
0.703 |
| ARV, median (IQR) |
7.5 (6.3-9.4) |
7.5 (5.8-9.4) |
0.815 |
| MAD, median (IQR) |
5.5 (4.0-7.5) |
6.0 (4.4-8.0) |
0.274 |
| ACACP, median (IQR) |
6.0 (5.0-7.4) |
6.0 (4.9-7.7) |
0.745 |
| MCAPC, median (IQR) |
4.5 (3.7-5.8) |
4.5 (3.7-6.1) |
0.695 |
| Good outcome, n (%)
|
43 (31.6) |
49 (62.8) |
<0.001 |
All data were expressed as n (%) or median (IQR). SBP, systolic blood pressure; Mean SBP, mean SBP during the period of BPV ascertainment; NIHSS, National Institutes of Health Stroke Scale; ASPECTS, Alberta Stroke Program Early CT Score; IVT, Intravenous thrombolysis; ICA, internal cervical artery; MCA, middle cerebral artery; mTICI, modified Thrombolysis in Cerebral Infarction; LAA, large artery atherosclerosis; OPT, onset to puncture time; DPT, door to puncture time; ORT, onset-to-reperfusion time; ICH, intracranial hemorrhage; Δ1, SBP max- SBP min; SD, standard deviation; CV, coefficient of variation; SV, successive variation; ARV, average real variability; MAD, median absolute deviation and ACACP, average consecutive absolute change percentage; MCAPC, median continuous absolute percentage change and TOAST.

Significantly, the univariate logistic regression analysis revealed a strong association between all SBPV indicators and clinical outcomes in patients who did not use antihypertensive drugs, except for MCAPC. However, in patients who used antihypertensive drugs, none of the SBPV indicators exhibited a significant association (Table 4). This finding was further confirmed by multivariate logistic regression analysis after adjusting for diabetes, admission NIHSS, mTICI, ORT, and ICH (Table 4). We conducted an interaction analysis between the use of antihypertensive drugs and SBPV indices, but no statistical significance was identified although an obvious trend was found for Δ1 and SD (Table 4). As shown in Fig.3, we also performed an ROC curve to evaluate whether the effect of SBPV on the prognosis was affected by the use of antihypertensive drugs. The results showed that the AUC increased after adjusting for antihypertensive drug use (0.774–0.783 in model 1; 0.739–0.754 in model 2), providing additional evidence for the effect of antihypertensive drugs on the association of SBPV with clinical outcomes.
Table 4.Univariable and multivariable logistic regression analysis for 90-day poor outcome stratified by antihypertensive drugs
|
Antihypertensive drugs |
Unadjusted OR (CI 95%) |
P value
|
Adjusted OR (CI 95%) |
P value
|
P interaction
|
| Δ1 |
Yes (n = 136)
|
1.022 (0.996-1.049) |
0.096 |
1.015 (0.986-1.044) |
0.315 |
0.059 |
|
No (n = 78)
|
1.078 (1.026-1.133) |
0.003 |
1.095 (1.034-1.160) |
0.002 |
|
| SD |
Yes (n = 136)
|
1.070 (0.971-1.180) |
0.173 |
1.037 (0.931-1.155) |
0.504 |
0.053 |
|
No (n = 78)
|
1.328 (1.092-1.613) |
0.004 |
1.398 (1.109-1.763) |
0.005 |
|
| CV |
Yes (n = 136)
|
1.107 (0.970-1.264) |
0.130 |
1.059 (0.915-1.225) |
0.444 |
0.161 |
|
No (n = 78)
|
1.343 (1.062-1.699) |
0.014 |
1.443 (1.091-1.910) |
0.010 |
|
| SV |
Yes (n = 136)
|
1.086 (0.972-1.212) |
0.145 |
1.054 (0.932-1.192) |
0.402 |
0.124 |
|
No (n = 78)
|
1.276 (1.072-1.518) |
0.006 |
1.345 (1.098-1.649) |
0.004 |
|
| ARV |
Yes (n = 136)
|
1.152 (0.978-1.357) |
0.089 |
1.096 (0.917-1.310) |
0.313 |
0.222 |
|
No (n = 78)
|
1.377 (1.089-1.742) |
0.008 |
1.478 (1.126-1.941) |
0.005 |
|
| MAD |
Yes (n = 136)
|
1.083 (0.948-1.237) |
0.241 |
1.056 (0.917-1.217) |
0.447 |
0.115 |
|
No (n = 78)
|
1.327 (1.071-1.645) |
0.010 |
1.385 (1.081-1.774) |
0.010 |
|
| ACACP |
Yes (n = 136)
|
1.250 (0.997-1.567) |
0.053 |
1.163 (0.912-1.482) |
0.223 |
0.478 |
|
No (n = 78)
|
1.427 (1.070-1.902) |
0.015 |
1.554 (1.117-2.162) |
0.009 |
|
| MCAPC |
Yes (n = 136)
|
1.262 (0.977-1.630) |
0.075 |
1.158 (0.881-1.521) |
0.293 |
0.965 |
|
No (n = 78)
|
1.273 (0.959-1.689) |
0.095 |
1.340 (0.979-1.834) |
0.067 |
|
Adjusted for diabetes, admission NIHSS, mTICI, onset-to-reperfusion time, intracranial hemorrhage. Δ1, SBP max- SBP min; SD, standard deviation; CV, coefficient of variation; SV, successive variation; ARV, average real variability; MAD, median absolute deviation and ACACP, average consecutive absolute change percentage; MCAPC, median continuous absolute percentage change

Discussion:
In this study, we identified several interesting findings in patients with AIS-LVO who had successful recanalization after EVT: (1) there is a significant correlation between an increase in short-term SBPV (Δ1, SD, CV, SV, ARV, ACACP, and MCAPC) and poor clinical outcomes; (2) the used of antihypertensive drugs during EVT or within 24 h after EVT was associated with poor clinical outcomes; (3) the use of antihypertensive drugs may affect the power of SBPV to predict poor clinical outcomes.
The association of short-term BPV with clinical outcomes has been widely investigated in patients with AIS-LVO after EVT. Most studies found their positive association10, 14, 15); however, some studies denied the association16, 17). In the current study, we also found a positive correlation between short-term SBPV and poor clinical outcomes in patients with AIS-LVO who had successful recanalization after EVT. It is well known that the association between BPV and the prognosis is complex and influenced by various factors, including reperfusion status, infarction severity, collateral circulation status, and the degree of impaired cerebral autoregulation1, 13, 18-20). Cerebral autoregulation plays a key role because increased BP may lead to cerebral perfusion injury20), while decreased BP would reduce perfusion to ischemic tissue, potentially increasing the size of the cerebral infarction21). Studies have shown that even after the reconstruction of occluded vessels, cerebral autoregulation remains impaired22).
In addition to their BP-lowering effect, antihypertensive drugs can also affect cerebral blood flow in patients with AIS23). Previous studies have demonstrated that antihypertensive drugs can affect BPV24, 25). In the current study, the baseline characteristics of BPV were comparable between patients who received or did not receive antihypertensive drugs. Importantly, we observed a notable association between increased SBPV and poor outcomes in patients who did not receive antihypertensive drugs, but this correlation was not found in patients who received antihypertensive drugs. Furthermore, the AUC results suggested that the power of SBPV predicting clinical outcomes was improved after adjusting for antihypertensive drug use. In summary, these results suggest that antihypertensive drugs may have the potential to influence the relationship between SBPV and clinical outcomes. The proposal was further supported by a secondary analysis of the Blood Pressure after Endovascular Stroke Therapy study reporting that all BPV parameters were associated with a worse prognosis, but only one BPV parameter remained significantly correlated with a poor prognosis in a model adjusted for the use of antihypertensive drugs10). The phenomenon may be attributed to the effect of antihypertensive drugs on BPV and cerebral blood flow23-25).
To our knowledge, this study is a pioneer in the examination of the possible connection between short-term BPV and the functional outcomes in patients with AIS-LVO during the initial 24 h following successful recanalization after EVT, impacted by the administration of antihypertensive drugs. The findings imply that the presence of this association could be impacted by the utilization of antihypertensive drugs. However, we acknowledge that this study has certain limitations. The main limitation is that this is a retrospective study, which may inevitably introduce some confounding factors and selection bias, especially the potential bias given that these patients need antihypertensive drugs. Second, a higher proportion of the large artery atherosclerosis subtype (55.1%) was enrolled in this study, compared with other studies such as the OPTIMAL-BP trial (26.5%)26), but the proportion was comparable with the results of the ENCHANTED2/MT study6), which has similar population characteristics to that of the current study (Chinese population). These results suggest that this finding would need to be validated in a non-Chinese population. Third, given the retrospective nature of this study, we refrained from restricting the variety and dosage of antihypertensive drugs, which has made it challenging to ascertain their association with BP fluctuations or prognosis. Lastly, our study data did not measure infarct size nor recorded intraoperative BP data, which are important indicators related to a poor prognosis.
In patients with anterior circulation AIS-LVO who had successful recanalization after EVT, the use of antihypertensive drugs can somewhat influence the association of SBPV with clinical outcomes. Given the complex relationship between antihypertensive drugs, BPV, and clinical outcomes, this finding warrants to be confirmed in further studies.
Declaration of Conflicting Interests
None.
Funding
The work was supported by grants from the Science and Technology Project Plan of Liao Ning Province (2022JH2/101500020).
Contribution
J. Li analyzed the data and wrote the original draft of the manuscript. B.J. Liu, Y.J. Wang and Y. Cui collected and analyzed the data. HS Chen designed the study and critically revised the manuscript. All authors approved the manuscript.
Ethics Approval
This study was approved by the ethics committee of General Hospital of Northern Theater Command.
Data Availability Statement
Data are available upon reasonable request. The dataset used and/or analyzed during the current study is available from the corresponding author on reasonable request.
References
- 1) Powers WJ, Rabinstein AA, Ackerson T, Adeoye OM, Bambakidis NC, Becker K, Biller J, Brown M, Demaerschalk BM, Hoh B, Jauch EC, Kidwell CS, Leslie-Mazwi TM, Ovbiagele B, Scott PA, Sheth KN, Southerland AM, Summers DV, Tirschwell DL. Guidelines for the early management of patients with acute ischemic stroke: 2019 update to the 2018 guidelines for the early management of acute ischemic stroke: A guideline for healthcare professionals from the american heart association/american stroke association. Stroke, 2019; 50: e344-e418
- 2) Goyal M, Menon BK, van Zwam WH, Dippel DW, Mitchell PJ, Demchuk AM, Dávalos A, Majoie CB, van der Lugt A, de Miquel MA, Donnan GA, Roos YB, Bonafe A, Jahan R, Diener HC, van den Berg LA, Levy EI, Berkhemer OA, Pereira VM, Rempel J, Millán M, Davis SM, Roy D, Thornton J, Román LS, Ribó M, Beumer D, Stouch B, Brown S, Campbell BC, van Oostenbrugge RJ, Saver JL, Hill MD, Jovin TG; HERMES collaborators. Endovascular thrombectomy after large-vessel ischaemic stroke: A meta-analysis of individual patient data from five randomised trials. Lancet, 2016; 387: 1723-1731
- 3) Talke PO, Sharma D, Heyer EJ, Bergese SD, Blackham KA, Stevens RD. Society for neuroscience in anesthesiology and critical care expert consensus statement: Anesthetic management of endovascular treatment for acute ischemic stroke*: Endorsed by the society of neurointerventional surgery and the neurocritical care society. J Neurosurg Anesthesiol, 2014; 26: 95-108
- 4) Nogueira RG, Jadhav AP, Haussen DC, Bonafe A, Budzik RF, Bhuva P, Yavagal DR, Ribo M, Cognard C, Hanel RA, Sila CA, Hassan AE, Millan M, Levy EI, Mitchell P, Chen M, English JD, Shah QA, Silver FL, Pereira VM, Mehta BP, Baxter BW, Abraham MG, Cardona P, Veznedaroglu E, Hellinger FR, Feng L, Kirmani JF, Lopes DK, Jankowitz BT, Frankel MR, Costalat V, Vora NA, Yoo AJ, Malik AM, Furlan AJ, Rubiera M, Aghaebrahim A, Olivot JM, Tekle WG, Shields R, Graves T, Lewis RJ, Smith WS, Liebeskind DS, Saver JL, Jovin TG. Thrombectomy 6 to 24 hours after stroke with a mismatch between deficit and infarct. N Engl J Med, 2018; 378: 11-21
- 5) Mistry EA, Sucharew H, Mistry AM, Mehta T, Arora N, Starosciak AK, De Los Rios La Rosa F, Siegler JE 3rd, Barnhill NR, Patel K, Assad S, Tarboosh A, Dakay K, Salwi S, Cruz AS, Wagner J, Fortuny E, Bennett A, James RF, Jagadeesan B, Streib C, O’Phelan K, Kasner SE, Weber SA, Chitale R, Volpi JJ, Mayer S, Yaghi S, Jayaraman MV, Khatri P. Blood pressure after endovascular therapy for ischemic stroke (best): A multicenter prospective cohort study. Stroke, 2019; 50: 3449-3455
- 6) Yang P, Song L, Zhang Y, Zhang X, Chen X, Li Y, Sun L, Wan Y, Billot L, Li Q, Ren X, Shen H, Zhang L, Li Z, Xing P, Zhang Y, Zhang P, Hua W, Shen F, Zhou Y, Tian B, Chen W, Han H, Zhang L, Xu C, Li T, Peng Y, Yue X, Chen S, Wen C, Wan S, Yin C, Wei M, Shu H, Nan G, Liu S, Liu W, Cai Y, Sui Y, Chen M, Zhou Y, Zuo Q, Dai D, Zhao R, Li Q, Huang Q, Xu Y, Deng B, Wu T, Lu J, Wang X, Parsons MW, Butcher K, Campbell B, Robinson TG, Goyal M, Dippel D, Roos Y, Majoie C, Wang L, Wang Y, Liu J, Anderson CS. Intensive blood pressure control after endovascular thrombectomy for acute ischaemic stroke (enchanted2/mt): A multicentre, open-label, blinded-endpoint, randomised controlled trial. Lancet, 2022; 400: 1585-1596
- 7) Rothwell PM, Howard SC, Dolan E, O’Brien E, Dobson JE, Dahlof B, Sever PS, Poulter NR. Prognostic significance of visit-to-visit variability, maximum systolic blood pressure, and episodic hypertension. Lancet, 2010; 375: 895-905
- 8) Qin J, Zhang Z. Prognostic significance of early systolic blood pressure variability after endovascular thrombectomy and intravenous thrombolysis in acute ischemic stroke: A systematic review and meta-analysis. Brain and behavior, 2020; 10: e01898
- 9) Hawkes MA, Anderson CS, Rabinstein AA. Blood pressure variability after cerebrovascular events: A possible new therapeutic target: A narrative review. Neurology, 2022; 99: 150-160
- 10) Mistry EA, Mehta T, Mistry A, Arora N, Starosciak AK, De Los Rios La Rosa F, Starosciak AK, De Los Rios La Rosa F, Siegler JE 3rd, Chitale R, Anadani M, Yaghi S, Khatri P, de Havenon A. Blood pressure variability and neurologic outcome after endovascular thrombectomy: A secondary analysis of the best study. Stroke, 2020; 51: 511-518
- 11) Chinese Sociaty of Neurology, Chinese Stroke Society, Neurovascular Intervention Group of Chinese Society of Neurology. Chinese guidelines for the endovascular treatment of acute ischemic stroke 2018; 13: 706-729
- 12) Yoo AJ, Simonsen CZ, Prabhakaran S, Chaudhry ZA, Issa MA, Fugate JE, Linfante I, Liebeskind DS, Khatri P, Jovin TG, Kallmes DF, Dabus G, Zaidat OO. Refining angiographic biomarkers of revascularization: Improving outcome prediction after intra-arterial therapy. Stroke, 2013; 44: 2509-2512
- 13) Sadan O, Feng C, Vidakovic B, Mei Y, Martin K, Samuels O, Hall CL. Glucose variability as measured by inter-measurement percentage change is predictive of in-patient mortality in aneurysmal subarachnoid hemorrhage. Neurocrit Care, 2020; 33: 458-467
- 14) Manning LS, Rothwell PM, Potter JF, Robinson TG. Prognostic significance of short-term blood pressure variability in acute stroke: Systematic review. Stroke, 2015; 46: 2482-2490
- 15) Nepal G, Shrestha GS, Shing YK, Muha A, Bhagat R. Systolic blood pressure variability following endovascular thrombectomy and clinical outcome in acute ischemic stroke: A meta-analysis. Acta Neurol Scand, 2021; 144: 343-354
- 16) Maïer B, Gory B, Lapergue B, Sibon I, Escalard S, Kyheng M, Escalard S, Kyheng M, Labreuche J, de Havenon A, Petersen N, Anadani M, Gayat E, Boursin P, Ben Maacha M, Desilles JP, Blanc R, Piotin M, Halimi JM, Mazighi M. Effect of blood pressure variability in the randomized controlled bp target trial. Eur J Neurol, 2022; 29: 771-781
- 17) Anadani M, Orabi MY, Alawieh A, Goyal N, Alexandrov AV, Petersen N, Kodali S, Maier IL, Psychogios MN, Swisher CB, Inamullah O, Kansagra AP, Giles JA, Wolfe SQ, Singh J, Gory B, De Marini P, Kan P, Nascimento FA, Freire LI, Pandhi A, Mitchell H, Kim JT, Fargen KM, Al Kasab S, Liman J, Rahman S, Allen M, Richard S, Spiotta AM. Blood pressure and outcome after mechanical thrombectomy with successful revascularization. Stroke, 2019; 50: 2448-2454
- 18) Castro P, Azevedo E, Sorond F. Cerebral autoregulation in stroke. Current atherosclerosis reports, 2018; 20: 37
- 19) Jordan JD, Powers WJ. Cerebral autoregulation and acute ischemic stroke. American journal of hypertension, 2012; 25: 946-950
- 20) Sykora M, Diedler J, Turcani P, Rupp A, Steiner T. Subacute perihematomal edema in intracerebral hemorrhage is associated with impaired blood pressure regulation. J Neurol Sci, 2009; 284: 108-112
- 21) Jeong HG, Kim BJ, Kim H, Jung C, Han MK, Liebeskind DS, Bae HJ. Blood pressure drop and penumbral tissue loss in nonrecanalized emergent large vessel occlusion. Stroke, 2019; 50: 2677-2684
- 22) Reinhard M, Rutsch S, Lambeck J, Wihler C, Czosnyka M, Weiller C, Hetzel A. Dynamic cerebral autoregulation associates with infarct size and outcome after ischemic stroke. Acta Neurol Scand, 2012; 125: 156-162
- 23) Llwyd O, Fan JL, Müller M. Effect of drug interventions on cerebral hemodynamics in ischemic stroke patients. Journal of cerebral blood flow and metabolism: official journal of the International Society of Cerebral Blood Flow and Metabolism, 2022; 42: 471-485
- 24) Webb AJ, Fischer U, Mehta Z, Rothwell PM. Effects of antihypertensive-drug class on interindividual variation in blood pressure and risk of stroke: A systematic review and meta-analysis. Lancet, 2010; 375: 906-915
- 25) Rothwell PM, Howard SC, Dolan E, O’Brien E, Dobson JE, Dahlöf B, Poulter NR, Sever PS; ASCOT-BPLA and MRC Trial Investigators. Effects of beta blockers and calcium-channel blockers on within-individual variability in blood pressure and risk of stroke. Lancet Neurol, 2010; 9: 469-480
- 26) Nam HS, Kim YD, Heo J, Lee H, Jung JW, Choi JK, Lee IH, Lim IH, Hong SH, Baik M, Kim BM, Kim DJ, Shin NY, Cho BH, Ahn SH, Park H, Sohn SI, Hong JH, Song TJ, Chang Y, Kim GS, Seo KD, Lee K, Chang JY, Seo JH, Lee S, Baek JH, Cho HJ, Shin DH, Kim J, Yoo J, Lee KY, Jung YH, Hwang YH, Kim CK, Kim JG, Lee CJ, Park S, Lee HS, Kwon SU, Bang OY, Anderson CS, Heo JH; OPTIMAL-BP Trial Investigators. Intensive vs Conventional Blood Pressure Lowering After Endovascular Thrombectomy in Acute Ischemic Stroke: The OPTIMAL-BP Randomized Clinical Trial. JAMA, 2023; 330: 832-842