Improved isolation method to establish axenic strains of Paramecium
論文ID: JJP16-05
この記事には本公開記事があります。

詳細
論文ID: JJP16-05
Before aseptic isolation, two Paramecium strains with genome sequences compiled in ParameciumDB were rinsed with sterilized saline solution and were starved for 1 day in the same solution. After starvation, the cells were transferred to Klebsiella-dominant green barley infusion for two days to eliminate unknown bacteria of the bacterized culture to some degree. Then cells were processed using an aseptic isolation method combining two classical isolation methods: “tree” and “handwashing.” They were inoculated into the axenic medium. Asepsis of these cultures was examined using an agar plate test and PCR with universal primer for 16S rRNA gene. The maximum cell density of the axenic culture in both species increased linearly with the times of subculture increase. After adaptation to the axenic medium, the maximum cell density reached a plateau level: 3,000–4,000 cells/ml in P. multimicronucleatum and 14,000–15,000 cells/ml in P. tetraurelia. The generation times at the mid-log phase of growth were calculated as 14.2 and 12.2 h in P. multimicronucleatum and P. tetraurelia, respectively. In this study, egg yolk or the soybean lecithin was tested as a substitute for phosphatidylethanolamine, with fixing of the lipid/stigmasterol ratio at 80 : 1. Results show that the maximum cell density, equivalent to that obtained using phosphatidylethanolamine, was obtained using soybean lecithin. This report includes data demonstrating the percentage of cells in a reproductive stage of every axenic strain using DAPI.
A widely known organism explained in junior high-school textbooks and a genus of unicellular ciliate, Paramecium, has been used extensively as a model cell to study basic biological phenomena in many research fields such as cell biology, cell physiology, genetics, developmental biology, ecology, and molecular biology (Görtz, 1988). It remains an outstanding model organism (Arnaiz et al., 2007; Singh et al., 2014). The genus Paramecium includes many species such as P. aurelia species complex, P. bursaria, P. calkinsi, P. caudatum, P. duboscqui, P. multimicronucleatum, P. nephridiatum, P. polycaryum, and P. putrinum. Some of those species are cultivated in the laboratory and are preserved as stocks for research and educational use (ATCC, http://www.atcc.org; NBRP Paramecium, http://nbrpcms.nig.ac.jp/paramecium/).
Maintenance of stocks of the species described above has been conducted mainly with bacterized cultures. Axenic cultures are available for a few species that have been established using methods developed during the 1950–1980s. Although several methods have been reported (Sonneborn, 1950; van Wagtendonk and Soldo, 1970; Allen and Nerad, 1978), establishment of an axenic culture is not so easy. Development of an axenic culture consists of two steps: aseptic isolation of paramecia from other organisms, and adjustment or adaptation to the axenic culture medium by the paramecia themselves.
The following three methods for aseptic isolation have been developed. The first is “handwashing” method (Sonneborn, 1950). This steady and tedious method transfers individual cells under a microscope using a micropipette. Although the method has low yield, its accuracy is high because bacteria or fungi can be detected under a microscope depending on the magnification and the organism size. The second is an “electromigration” method (van Wagtendonk and Soldo, 1970), which relies upon a cell’s intrinsic locomotor response to an electrical stimulus: galvanotaxis. Actually, galvanotaxis has been observed in cells of diverse types, including bacteria (Shi et al., 1996). It is therefore difficult to isolate paramecia from bacteria if the swimming direction matches. The third is “tree” method, developed originally by van Wagtendonk and Soldo (1970) and simplified by Allen and Nerad (1978). The “tree” method relies upon a behavioral trait of cell’s negative geotaxis, where cells swim upward through several meters of upright glass tubing containing a Cerophyl™ infusion and antibiotics. Negative geotaxis has been reported in free-swimming protozoa including Paramecium (Roberts, 1970) and also in zoospores of fungus, Phytophthora megasperma (Cameron and Carlile, 1977), a well-known plant pathogen with many hosts. Contamination of such organisms can occur easily during collection of the paramecia from fields. Moreover, such contamination might be passed to the subsequent subcultures. Isolation is therefore difficult only with the “tree” method. Development of a more accurate method for isolation is necessary.
For adaptation to the axenic culture medium, cells require an appropriate time for adaptation to new circumstances. Adequate growth and resulting longtime maintenance of the species demonstrates that cells can adapt to such culture media. Some popular axenic media for paramecia have been used in many laboratories to date. The most popular medium was developed by Soldo et al. (1966), who produced an original recipe for the axenic medium for Paramecium aurelia. Later, Fok and Allen (1979) modified the recipe by increasing the folic acid ten-fold and also by replacing TEM-4T (a tartaric acid ester of beef tallow monoglyceride) with phosphatidylethanolamine (PE, commercial grade from ovine brain, P4264; Sigma-Aldrich). Fok and Allen (1979) reported that adequate growth was obtained with PE–stigmasterol ratios of 40 : 1 to 400 : 1. Unfortunately, the commercial grade PE is no longer available. Other highly purified PE products are available, but they are too expensive for daily use. Consequently, a new substitute for PE is necessary for use in maintaining the axenic culture of Paramecium. Schönefeld et al. (1986) used 0.25 mg/ml lecithin (a crude extract of soybean phospholipids, P5638; Sigma-Aldrich) as a lipid source in their milk powder medium. They obtained adequate growth characteristics with a lecithin–stigmasterol ratio of 50 : 1.
Aiming to improve isolation methods, we pre-incubated cells with a known bacteria species to reduce the unknown microorganisms and to replace them with known bacteria to the greatest degree possible. This study was conducted to isolate cells with a method combining “tree” and “handwashing.” We also examined the use of lecithin as a substitute for PE and described the effects of lecithin on growth, maximum cell density, and cell reproduction.
Paramecium tetraurelia strain d4-2, a derivative of stock 51 (Sonneborn, 1974), was kindly supplied by Dr. Cohen (Centre de Génétique Moléculaire, Centre National de la Recherche Scientifique, France). In addition, P. multimicronucleatum strain M03c4 was purchased from the Symbiosis Laboratory, Yamaguchi University with partial support from the National Bio-Resource Project of the Ministry of Education, Culture, Sports, Science and Technology, Japan (NBRP-Paramecium, http://nbrpcms.nig.ac.jp/paramecium/). The strain M03c4, a homozygous strain, was kindly provided to NBRP by Dr. A. Yanagi (Ishinomaki Senshu University, Japan) (Yanagi and Haga, 1998). All other chemicals were obtained from Sigma-Aldrich Corp. (St. Louis, MO).
Maintenance of the bacterized cultureBacterized cultures were maintained at 25°C in a static state using a sterilized 50 ml test-tube filled with 12 ml of green barley infusion containing 1 mg/ml Na2HPO4 (pH 7.0). One day before use, 12 ml of fresh green barley infusion containing 1 mg/ml Na2HPO4 (pH 7.0) was pre-inoculated with Klebsiella pneumonia. Then 2 ml of cell suspension drawn from a 7 day culture was inoculated to the green barley infusion that had been pre-incubated with bacteria. Cells were grown for a week in this pre-incubated medium without additional supply.
Green barley infusion was prepared as follows: 3 g of green barley powder (Nippon Flour Mills, Tokyo, Japan), so-called “Aojiru” in Japan, was dissolved in 40 ml DDW in 50 ml conical tube. Then it was autoclaved at 121°C for 20 min. After cooling, the autoclaved tube was centrifuged at 3,000 rpm for 10 min to remove insoluble ingredients. Then 1 g Na2HPO4 was dissolved in the obtained supernatant. After pH adjustment to 7.0 with HCl, the supernatant was diluted up to 1,000 ml with DDW. Then it was autoclaved again at 121°C for 20 min.
The generation time was calculated using the following formula.
 |
To remove bacteria from bacterized cultures, we used three isolation steps. 1) Reduction of unknown microorganisms from bacterized culture: Cells were rinsed three times with sterilized Soldo salt solution (SSS, Soldo et al., 1966). They were then starved for 1 day in the same solution. Starved cells were transferred into the green barley infusion that had been pre-inoculated with K. pneumoniae a day before use to produce a K. pneumoniae-dominant condition. They were subsequently incubated for 2 days in the bacterized medium. 2) Tree method: Cells cultured with K. pneumoniae were rinsed three times with SSS using hand centrifugation. They were re-suspended in a mixed solution of four antibiotics. Then cells were isolated using the “tree” method (Allen and Nerad, 1978). They were incubated in the same antibiotic solution for 3–7 h at 25°C. The antibiotic solution contained a mixture of 100 U/ml penicillin-G, 100 µg/ml streptomycin, 100 µg/ml erythromycin, 100 µg/ml ampicillin, and 0.1% (v/v) ethanol as a solvent for erythromycin. 3) Handwashing method: Cells in the antibiotic solution were isolated again using “handwashing (Sonneborn, 1950),” by which cells were transferred with sterile micropipette among three wells of a three-hole depression slide filled with the antibiotic solution under a microscope at room temperature (24°C).
The 20–50 isolated cells with a small amount of the antibiotic solution (approx. 100 µl) were transferred to a sterile 15 ml culture tube aseptically. Then they were mixed with equal amounts of fresh axenic culture medium (AM) of Fok and Allen (1979) in the same 15 ml culture tube. Cells were grown in the mixture solution (antibiotic solution : AM=1 : 1, volume ratio) for several days at 25°C. Then they were inoculated into fresh 12 ml AM. The axenic culture was maintained at 25°C in a static state using a sterilized 50 ml test tube. A week later, the cell suspension with AM was tested for bacterial contamination using an agar plate (LB Agar Daigo; Wako Pure Chemical, Tokyo, Japan). Plates were incubated at 37°C overnight and were observed for signs of contamination during the 2 wk. Stock cultures were subcultured every week and were stored in an incubator at 25°C, as described by Fok and Allen (1979).
Cell density was estimated by counting live cells from at least three aliquots of an appropriately diluted cell suspension from three identical cultures. The average of cell counts from these aliquots was used to calculate the daily densities, as described by Fok and Allen (1979).
Detection of bacterial rDNAUn-inoculated and post-inoculated culture media were centrifuged for 10 min at 4°C, 1,500×g (Kubota 2800; Kubota, Tokyo, Japan). After centrifugation, 1 ml of culture medium including pellets was used for genomic DNA isolation using a kit (Power Soil DNA; Mo Bio Laboratories, Carlsbad, CA).
To detect bacterial 16S rRNA gene, we used universal primers, (BSF 8/20 5′-AGA GTT TGA TCC TGG CTC AG-3′, BSR 1541/20 5′-AAG GAG GTG ATC CAG CCG CA-3′). PCRs (50 µl) contained 0.5 μM of each primer, all four dNTPs (each at 0.2 mM), and 1 U of Phusion High-Fidelity DNA Polymerase (New England Biolabs, Tokyo, Japan). Reactions were conducted for denaturation at 98°C for 30 s, followed by 30 cycles of denaturation at 98°C for 10 s, annealing at 57°C for 20 s, and extension at 72°C for 90 s, with final extension at 72°C for 5 min. Reactions were done using a Veriti® Thermal Cycler (Applied Biosystems, Foster City, CA). Amplified PCR products and 1 Kb DNA ladder (SibEnzyme, Russia) were electrophoresed in 1.0% agarose gels and were visualized using ethidium bromide staining. In addition, PCR products were cloned into the pGEM-T easy vector (Promega, Madison, WI). Genomic clones were sequenced using FASMAC DNA sequence service (FASMAC, Kanagawa, Japan). The resulting nucleotide sequences were examined for their similarity to known sequences using the GenBank BLAST program.
Fluorescence microscopyFor fluorescence microscopy, cells were fixed in 3% formaldehyde in 50 mM phosphate buffer (PB, pH 7.4) for 30 min at room temperature, as described in an earlier report of the literature (Ishida et al., 1999). For monitoring of the morphological features of the nuclei, cells were stained with 100 ng/ml 4′,6-diamidino-2-phenylindole dihydrochloride (DAPI) for 10 min at room temperature. Then they were washed three times with phosphate buffered saline (PBS, pH 7.4) for 15 min each. Cells were examined using an inverted fluorescence microscope (IX-70; Olympus, Tokyo, Japan).
Fig. 1 presents an example of the growth curves of two species in bacterized cultures at 25°C. Two milliliters of the cell suspension drawn from a 7 day culture containing approximately 800 cells/ml of P. multimicronucleatum (M03c4) or approximately 1,300 cells/ml of P. tetraurelia (d4-2) was inoculated onto 12 ml of fresh green barley infusion that had been pre-inoculated with K. pneumonia. As presented in Fig. 1 and Table 1, the maximum cell densities were observed 4 days after inoculation. They were 1,200±100 cells/ml (n=3) and 2,067±153 cells/ml (n=3) for P. multimicronucleatum and for P. tetraurelia, respectively. The calculated generation times at mid-log phase of growth were 19.10±4.50 h and 8.03±0.24 h for P. multimicronucleatum and P. tetraurelia, respectively. The stationary phase of growth fluctuated. Then the decline phase appeared to start 12 days after inoculation (Fig. 1).

 |
As suggested by Sonneborn (1970), a favorable outcome was obtained by supplementation with 0.4 µg/ml β-sitosterol in the bacterized culture medium in the current study. Even at the same temperature (25°C), the maximum cell density of both species increased and the generation time became shorter (Table 1). At higher temperatures (28°C), the highest maximum cell density was obtained 4 days after inoculation. The obtained maximum cell densities at 28°C with 0.4 µg/ml β-sitosterol culture were 3,640±376 cells/ml (n=3) for P. multimicronucleatum and 9,680±2,489 cells/ml (n=3) for P. tetraurelia, respectively (Table 1).
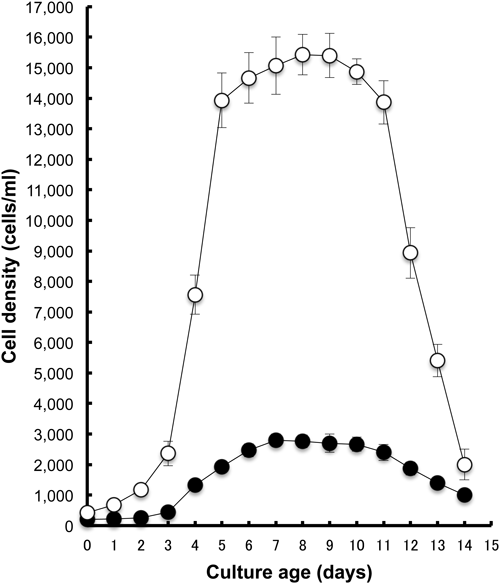
Adaptation to the axenic medium containing phosphatidylethanolamineAccording to a method modified from that presented by Fok and Allen (1979), we used PE purified from dog brain (P-7514; Sigma-Aldrich) as the lipid source and fixed PE–stigmasterol ratio at 80 : 1 in the current study (0.2 mg/ml PE: 2.5 µg/ml stigmasterol). That ratio has been used conventionally for daily culture over the past quarter century in their laboratory (University of Hawaii, personal communication). In reference to their method, the culture temperature was maintained at 25±1°C, except during the experiment, to assess temperature effects on growth. Fig. 2 presents an example of the growth response of Paramecium after 159–173 days adaptation to AM containing 0.2 mg/ml PE at 25°C, where 233±29 cells of P. multimicronucleatum and 367±29 cells of P. tetraurelia were inoculated to 12 ml AM containing 0.2 mg/ml PE at 0 days. After a short (1–2 day) lag phase, the log phase started, where cells grow exponentially, and stopped 6–7 days after inoculation. The maximum cell density was obtained 7 days after inoculation. The respective values were 3,767±252 cells/ml for P. multimicronucleatum and 14,200±721 cells/ml for P. tetraurelia. The stationary phase of growth was stable in P. tetraurelia. Then the decline phase seemed to start 12 days after inoculation.

It is noteworthy that the maximum cell density (shaded area presented in Fig. 2) tended to increase as the subculture times (shown as adaptation period in Fig. 3) increased. Therefore, we presented every maximum cell density (7 days after inoculation) of subcultures (Fig. 3). The first week is follow-up period used to identify signs of contamination. Therefore, no recording of the first week was taken, as depicted in Fig. 3. During the second week (7–14 days in Fig. 3), cells grew slowly and then reached the stationary phase. The obtained maximum cell densities of the second week were only 1,167±289 cells/ml for P. multimicronucleatum and 5,767±252 cells/ml for P. tetraurelia (14 day in Fig. 3). Although the initial cell densities of the respective subculture were adjusted to 300–500 cells/ml, the maximum cell densities increased as the subculture times increased for the respective species. Then they reached a plateau level (dashed lines in Fig. 3). The increase in the maximum cell density fit a linear model (R2=0.95 in P. multimicronucleatum, 0.92 in P. tetraurelia) better than an exponential regression model (R2=0.91 in P. multimicronucleatum, 0.87 in P. tetraurelia). The averaged cell densities at the plateau level (8 plots in Fig. 3) of P. multimicronucleatum and P. tetraurelia were 3,892±206 and 13,954±676 cells/ml, respectively. Using the values of averaged cell density and the equation of regression, the time necessary for reaching the plateau level was calculated. The calculated days to reach the plateau level of P. multimicronucleatum and P. tetraurelia were 55.3 and 71.9 days, respectively.

According to Schönefeld et al. (1986), we substituted lecithin for PE. In their original recipe, the weight ratio of the lecithin–stigmasterol was 50 : 1. The lecithin comprises several lipids other than PE. In the current study, the weight ratio of the PE–stigmasterol ratio was fixed on 80 : 1. We chose the weight ratio rather than the molar ratio and kept 80 : 1 for comparison with PE.
Cells adapted to the AM containing 0.2 mg/ml PE were inoculated into the AM containing 0.2 mg/ml lecithin. In the current study, egg lecithin (EGL) and soybean lecithin (SBL) were used as substitutes for PE. Using EGL and SBL, the change in the maximum cell density was monitored for approximately 4 mo after inoculation to AM with lecithin. Results show that the maximum cell density equivalent to the value with PE was obtained with SBL (Fig. 4). For EGL, approximately 40% of the value with PE was obtained in both species (data not shown). Although the initial cell density was adjusted to 300–500 cells/ml (controlled as depicted in Fig. 3), the maximum cell densities increased as the times of subculture increased in both species. They reached a plateau level after an appropriate time period. Calculated days to reach the plateau level of P. multimicronucleatum and P. tetraurelia were 66.2 and 88.8 days, respectively (Fig. 4). The average cell densities at the plateau level of P. multimicronucleatum and P. tetraurelia were 2,772±142 (eight plots) and 14,500±597 cells/ml (five plots), respectively (Fig. 4).

Fig. 5 presents an example of the growth response of Paramecium after 117–124 days adaptation to AM containing 0.2 mg/ml SBL (AM with SBL) at 25°C, where 203±16 cells of P. multimicronucleatum and 417±27 cells of P. tetraurelia were inoculated to 12 ml AM with SBL at 0 days. After a short (1–2 day) lag phase, the log phase started where cells grew exponentially. Then it stopped. The stationary phases of both species were stable in comparison to AM containing 0.2 mg/ml PE (Fig. 2). The decline phase seemed to start 12 days after inoculation. Generation times at the mid-log phase of growth of P. multimicronucleatum and P. tetraurelia were calculated as 14.80±0.59 h (n=3) and 14.28±1.09 h (n=3), respectively (Table 2).
 |
The maximum cell density and the generation time of the AM with PE or SBL are shown in Table 2, where data obtained from the AM with SBL at 28°C were also added. Different from the case of the bacterized culture (Table 1), the maximum cell density did not increase at 28°C in the axenic culture. For P. multimicronucleatum, the maximum cell density at 25°C was lower in AM with SBL (2,817±225 cells/ml) than that of AM with PE (3,767±252 cells/ml). It was lowest (2,517±161) at 28°C. For P. tetraurelia, the maximum cell density at 25°C was higher in AM with SBL (15,067±945 cells/ml) than that of AM with PE (14,200±721 cells/ml), but it was lowest at 28°C (138,000±721 cells/ml). For the generation time, the value obtained with SBL was longer than that with PE at 25°C in both species, although it became shorter at 28°C.
Detection of bacterial rDNAUsing the current successive isolation method, P. multimicronucleatum strain M03c4 and P. tetraurelia strain d4-2 were inoculated into the AM with PE with a small amount of the antibiotic solution. After a week of culture in AM with PE, neither turbidity nor a foul odor was detected. The acquisition of multiple drug resistance has been reported for K. pneumoniae (Hirsch and Tam, 2010). Therefore, a conventional agar plate test was conducted. The agar plate test showed no colony overnight or following two weeks of incubation at 37°C (data not shown).
To assess the possibility of bacterial contamination in cultures, PCR was conducted with universal primer for 16S rRNA gene. As a positive control, an AM with SBL cultured with K. pneumoniae was used to identify the bacterial PCR products. It was detected as a 1.4 kbp thick band, as depicted in Fig. 6 (Kleb). Detection of the 1.4 kbp band in the sample signifies the existence of the bacterial rDNA in the sample and reflects the possibility of bacterial contamination. The 1.4 kbp PCR product was, however, detected slightly in the medium cultured with P. multimicronucleatum (Pm, Fig. 6) or P. tetraurelia (Pt, Fig. 6) and even in fresh (uncultured) AM itself (Un, Fig. 6). Consequently, all culture media used for PCR experiments contained 16S rDNA. Sterile distilled water was used as a negative control (DW, Fig. 6) in which PCR products were not detected at all.

We further attempted to identify the PCR products before and after the culture of paramecia. The PCR products were cloned into the pGEM-T easy vector. Three genomic clones from each sample were sequenced. Results show that nucleotide sequences obtained from the culture media were 89% identical to 16S rRNA of Tumebacillus sp. (JX233496).
Percentage of cells in the process of vegetative or sexual reproduction within a cultureCells subcultured in the AM with PE were fixed at day 3 of subculture (mid-log phase: 84 days passed from the first inoculation) and day 7 of subculture (stationary phase: 91 days passed from the first inoculation). Then they were subjected to DAPI staining (Fig. 7). Fig. 7 shows that DAPI clearly stained nuclei and the derivatives in cytoplasm of paramecia. However, we failed to detect any bacteria-like label (0.5–1 µm diameter, 1–5 µm long) in the cytoplasm of either species. After comparison of morphological features of macronuclei using DAPI staining, cells were classified to three categories as shown in Table 3: vegetative “interphase,” “dividing” (asexual reproduction), and “reorganizing” (sexual reproduction including both conjugation and autogamy). Typical images of cells from respective categories are portrayed in Fig. 7. Cells with a packed and oval appearance of the macronucleus (Fig. 7A and E) were classified as “interphase.” Cells with an elongated or an hourglass-shaped macronucleus (Fig. 7B and F) were classified as “dividing.” Conjugated pairs or cells with a skein or fragmented macronucleus (Fig. 7C, D, G and H) were classified as “reorganizing.” Table 3 shows the mean values and the standard deviation of respective categories obtained from five trials counting 100 cells.

 |
For P. multimicronucleatum, 5.2±1.9% and 2.0±1.6% of the total cells fixed at the mid-log phase were classified as “dividing” and “reorganizing,” respectively (Table 3). Cells classified as reorganizing at the mid-log phase were only single cells with a fragmented macronucleus. No conjugating pairs were observed. At the stationary phase of growth, the percentage of the cells classified as “reorganizing” increased to 15.4±7.5% of the total, although dividing cells were not detected at all. The reorganizing cells at the stationary phase were mainly single cells (approx. two-thirds of reorganizing) with a fragmented macronucleus (Fig. 7C), but also containing conjugating pairs (approx. one-thirds of reorganizing, Fig. 7D). Conjugating pairs of P. multimicronucleatum were observed frequently during aseptic isolation conducted after starvation in the current study (data not shown). It is noteworthy that, unlike P. caudatum (Ishida et al., 1999), skein formation started within the conjugating pairs of P. multimicronucleatum (Fig. 7D).
For P. tetraurelia, 5.0±2.7% and 25.2±3.3% of all cells fixed at the mid-log phase were classified respectively as “dividing” and “reorganizing” (Table 3). Cells classified as “reorganizing” were only single cells with a fragmented macronucleus (Fig. 7G and H). It is noteworthy that conjugating pairs were not detected in the case of P. tetraurelia. At a stationary phase of growth, the percentage of the cells classified as “reorganizing” increased to 38.2±5.1% of the total, but dividing cells were not detected at all.
To establish the axenic culture of Paramecium, a method combining two classical isolation methods, so-called “tree” and “handwashing,” was used for this study, where the “tree” method was used as a pretreatment to minimize the number of bacteria for the “handwashing” method. Although we failed to show positive results on agar-plate tests and also failed to detect any bacteria-like labels with DAPI staining in cytoplasm (Fig. 7), the possibility of the existence of either the unknown bacterial cyst or bacterial endosymbionts such as Caedibacter species (Springer et al., 1993) and Holospora species (Fokin et al., 1996) cannot be denied. Isolation methods used for this study cannot eliminate these bacteria because they can hide in cytoplasm.
To detect bacterial contamination, we conducted PCR with universal rRNA primer. The PCR with universal rRNA primer demonstrated the existence of an unknown sequence similar to the 16S rDNA gene of a Tumebacillus in all the culture media used for this study (Pm, Pt, and Un in Fig. 6). The PCR product with universal rRNA primer was not detected in the negative control with sterile DW (Fig. 6). This result suggests that contamination of an unknown bacterial sequence did not occur during PCR. The cause of the contamination might therefore be related to the AM itself. Although we did not identify which component of AM caused contamination of the unknown rDNA sequence, this is the only sequence we detected in AM with PCR. These results suggest the possibility of the existence of unknown bacteria in the axenic culture established here. However, neither turbidity nor foul odor of the culture has been observed for over a year. Even assuming that a small amount of unknown bacteria remained because they did not proliferate sufficiently to cause turbidity in the culture, the bacteria can be eliminated eventually by predation or dilution associated with subcultures.
Cells in AM have a longer generation time than that of the cells in a bacterized culture (except for the case without β-sitosterol in P. multimicronucleatum). The obtained maximum cell density of the axenic culture was equivalent to or greater than that of bacterized culture, as a comparison of Tables 1 and 2 demonstrates. We tried to evaluate our results with data from earlier studies, but finding a comparable value from the literature was not possible, as described below. The generation time of P. tetraurelia strain d4-2 has been reported as 5 h at 27°C in bacterized culture (Jerka-Dziadosz et al., 1992). However, the generation time and the maximum cell density vary either by strain or by culture temperature, even in the same species under the same axenic culture condition (Thiele et al., 1980). Furthermore, P. tetraurelia reportedly have clonal age dependence of generation time (Kippert, 1996). Consequently, comparison of the maximum cell density and/or generation time with those of previous studies must incorporate consideration of the culture temperature, clonal age, and strain.
The genomes of certain Paramecium species have been sequenced: the complete macronuclear genome of P. tetraurelia (Aury et al., 2006), the complete mitochondrion genome of P. tetraurelia (Pritchard et al., 1990), and P. caudatum (Barth and Berendonk, 2011). Other Paramecium species such as P. primaurelia, P. biaurelia, P. sexaurelia, P. octaurelia, P. tredecaurelia, P. caudatum, and P. multimicronucleatum are being examined in ongoing projects (ParameciumDB, http://paramecium.cgm.cnrs-gif.fr/). The strains used for this study are currently being examined in genome projects. Therefore, the axenic strains established here might be useful for extended biochemical studies that incorporate molecular techniques such as biochemical evaluation of the effects of RNAi treatment and analysis of artificially expressed gene products.
Adaptation to the axenic mediumFigs. 3 and 4 show that the adaptation process requires a certain duration. In both Paramecium species, the maximum cell densities at the stationary phase of growth increase gradually as the times of subculture increased with AM. Actually, 2–3 mo are necessary for the adaptation. Few reports in the literature describe such long observation periods. Fig. 3 shows that the estimated times necessary for the adaptation were 55.3 days for P. multimicronucleatum and 71.9 days for P. tetraurelia. They were elongated by substitution of PE with SBL (Fig. 4). Table 2 shows that the substitution of PE with SBL greatly reduced the maximum cell density in the case of P. multimicronucleatum, whereas the substitution caused a slight increase in the maximum cell density of P. tetraurelia (25°C). Furthermore, the substitution of PE with SBL caused a slight extension of the generation time in each species (25°C). The change in the lipid source of AM therefore caused these extensions of their generation time or the adaptation time period. Although one might speculate on the participation of cellular changes related either to the lipid uptake or its metabolism, we have insufficient evidence for that discussion. However, these results demonstrate a difficulty in the suitability of SBL as a substitution of PE.
Percentage of cell in the reproductive stages in axenic cultureElucidating the composition of the cell’s reproductive stage in culture is important for studies of molecular biology, cell biology, and cellular physiology. Furthermore, such basic data might provide good solutions for future studies. Fig. 7 and Table 3 exhibit reproductive stages of the cells in the axenic culture. For cells fixed at mid-log phase of growth, cells classified as “interphase” constitute the main component in the culture, which decreased to some degree (approx. 8%) in cells fixed at the stationary phase, whereas cells classified as “reorganizing” increased in cells fixed at the stationary phase. For P. tetraurelia, cells classified as “reorganizing” consisted only of single cells having a fragmented macronucleus, a characteristic morphological feature of macronucleus during sexual reproduction process. In the case of P. multimicronucleatum, cells classified as “reorganizing” consisted mainly of single cells having a fragmented macronucleus and also consisted with conjugating pairs having a skein of macronucleus. M03c4 is a homozygous strain (Yanagi and Haga, 1998). Periodic conversion of the mating type has been reported in P. multimicronucleatum (Barnett, 1966; Clark, 1972). These results suggest that the cells classified as “reorganizing” were sexually matured cells and that sexual reproduction has occurred in the axenic medium. In P. tetraurelia, starvation induces conjugation and autogamy, but the commitment to autogamy blocks mating reactivity (Berger and Rahemtullah, 1990). Consequently, these reproductive phenomena, except for conjugation, could have occurred in the axenic culture of P. tetraurelia.
Research was supported by JSPS KAKENHI Grant No. 21590358 and 15K12238. We thank Dr. J. Cohen and Dr. A. Yanagi for their kind supply of Paramecium species.