ORIGINAL ARTICLE
New data on S-bearing katoite from Tadano, Fukushima Prefecture, Japan: an implication of the presence of both (SO3)2− and (SO4)2− in the garnet structure
2023 年 118 巻 1 号 論文ID: 220724

詳細
2023 年 118 巻 1 号 論文ID: 220724
Katoite, ideally denoted as {Ca3}[Al2](□xSi3−x)(OH)4xO12−4x, where 1.5 < x ≤ 3, was found in skarn xenoliths from Tadano, Fukushima Prefecture, Japan, and investigated by electron microprobe analyses, X-ray single crystal structure refinement, and infrared (IR) spectroscopy. Katoite characteristically contains up to 0.18 atoms per formula unit (apfu) of S and has a range of compositions, wherein Si = 0.96-1.25 apfu, Al = 1.47-1.74 apfu, Fe = 0.13-0.28 apfu, and Mg = 0.01-0.10 apfu. A difference Fourier map revealed the residual electron density near the octahedral Y site (Wyckoff position = 16a), and we interpreted that S with three-fold coordination occurs at the position of the residual electron density, which is represented as the Y’ site (Wyckoff position = 32e). The final refinement introduced the Y’ site to yield R1 [F2 > 2σ(F2)] = 0.0353 with space group Ia3d and unit cell parameter a = 12.24095(8) Å. The IR spectrum in the range of 800-1200 cm−1 shows a band at 1124 cm−1 due to ν3(SO4) and doublet bands at 879 and 931 cm−1 with different absorbances interpreted as ν3(SiO4) overlapping with ν3(SO3). The combined results of IR spectroscopy and structure refinement imply that in the Tadano katoite, S4+ and S6+, forming (SO3)2− and (SO4)2− coordinations, are placed at the Y’ and tetrahedral Z sites, respectively. Assuming that S is preferentially allotted to the Y’ site as S4+ to compensate for the deficiency of the octahedral cations Al, Fe, Mg, Mn, and Ti at the Y site, chemical formulae, including possible S4+ and S6+ contents, may be calculated. The average chemical formula for 14 different spots is as follows: {Ca3}[(Al1.614Fe3+0.208Mg0.063Ti0.019)Σ1.90S4+0.096]Σ2.00(□1.867Si1.120S6+0.013)Σ3.00[(OH)7.192O4.612F0.147Cl0.048]Σ12.00.
Katoite was first identified and described as an isomorphous series, Ca3Al2(SiO4)3-Ca3Al2(OH)12 (the “hydrogrossular series”), and its ideal formula was initially defined as Ca3Al2(SiO4)(OH)8 (Passaglia and Rinaldi, 1984). Recently, the International Mineralogical Association Commission on New Minerals, Nomenclature and Classification approved a nomenclature for the garnet supergroup, and katoite was defined as a member of the “kenogarnet group” in the garnet supergroup (Grew et al., 2013). Cubic garnets have only four symmetrically unique atomic sites: dodecahedral {X}, octahedral [Y], and tetrahedral (Z) cation sites, as well as an anionic site designated as φ to indicate O, OH, and F, thereby providing a generalized chemical formula for the garnet supergroup {X3}[Y2](Z3)φ12 (Grew et al., 2013). Additionally, the three cation sites are at special positions with Wyckoff positions of 24c, 16a, and 24d, respectively (Grew et al., 2013). Grew et al. (2013) redefined the ideal formula for katoite as {Ca3}[Al2](□3)(OH)12, where □ is a vacancy. Therefore, the formula for the “hydrogrossular series” can be expressed as {Ca3}[Al2](Si3−x□x)O12−4x(OH)4x, where 0 (grossular endmember) ≤ x ≤ 3 (katoite endmember) relates to the substitution Z□ + 4OH− = ZSi4+ + 4O2− (Grew et al., 2013). The crystallographic and physical properties of katoite have been extensively investigated in recent years (Antao, 2015; Lacivita et al., 2015; Geiger and Rossman, 2018; Kato and Kyono, 2019; Kyono and Arora, 2019; Kyono et al., 2019; Geiger and Rossman, 2020).
Katoite and hydrous grossular rarely contain significant amounts of sulfur [0.11 S atoms per formula unit (apfu), Passaglia and Rinaldi, 1984; 0.17 S apfu, Rinaldi and Passaglia, 1989; 0.15 S apfu, Galuskin et al., 2009], and all the sulfur in the hydroxyl garnet was presumed to occur in the form of (SO4)2− and be located at the Z site as S6+. This assumption was made using only the electron microprobe data. Therefore, S-bearing hydroxyl garnets should be investigated using crystallographic and spectroscopic methods to confirm this assumption. We found S-bearing katoites in the skarn xenoliths in Tadano, Japan. As it contains a large amount of S (0.18 apfu), the katoite from Tadano is one of the most suitable samples for investigating the crystal chemistry of sulfur in the garnet structure. Here, we present infrared (IR) spectroscopic and X-ray structural data for Tadano katoite and discuss the valence state and site assignment for S in this mineral.
Katoite was found in skarn xenolith specimens within the Tertiary andesite in a quarry in Tadano, Fukushima Prefecture, Japan (37°23′38′′N, 140°15′21′′E). The skarn xenoliths mainly comprised calcite, katoite, wadalite, andradite, and thaumasite. Katoite partially replaced wadalite crystals with sizes of up to 1 mm along its margins and fractures. Moreover, unidentified hydrous minerals containing Ca, Fe, Mg, Al, and Si often replace the wadalite. In many cases, katoite with or without hydrous minerals completely replaces wadalite crystals and occurs as pseudomorphs after wadalite (Banno et al., 2018). Katoite contains magnetite as the inclusion material.
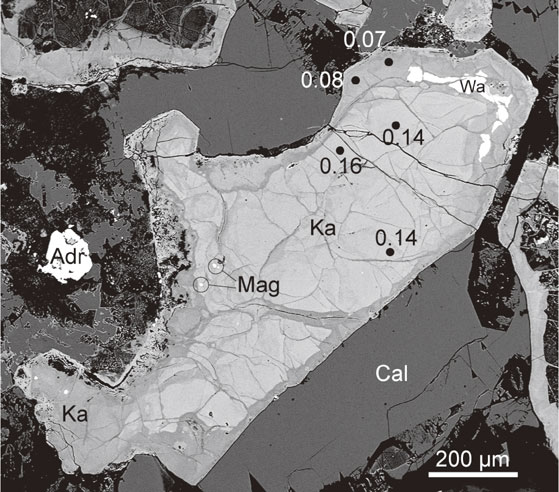
The backscattered electron image of a katoite crystal shows that it is chemically heterogeneous, with bright and dark areas, and the bright area is richer in S than the dark area (Fig. 1). The bright core was surrounded by a dark rim. An additional dark part cuts the bright host to form veins. This texture indicates that the bright parts were formed earlier than the dark parts.
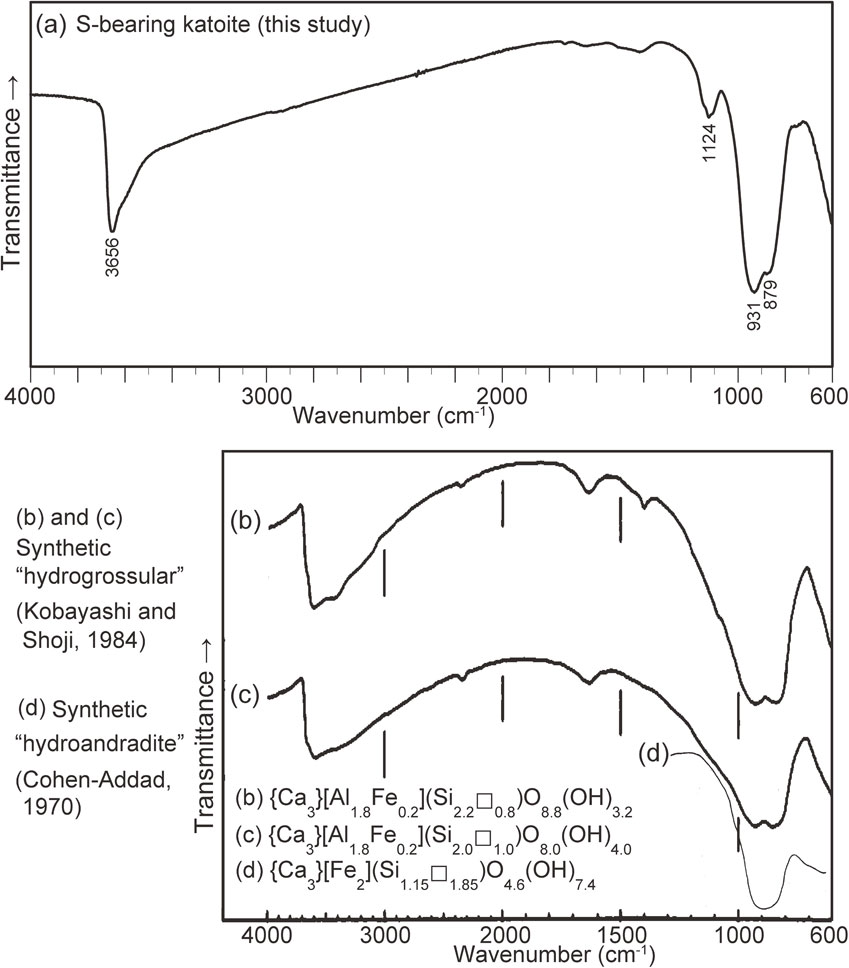
The samples for IR spectroscopy were prepared as follows: first, a single katoite fragment (100 µm × 50 µm × 30 µm) extracted from a thin section was crushed between two diamond plates. Subsequently, a fine-grained portion of the crushed fragments was pressed using a hand press machine. They were then placed on a diamond plate and analyzed. The micro-IR spectrum of katoite was recorded using a JASCO FT/IR-4700 with IRT-5200, employing a transmission method that collected 100 scans over a range of 600-4000 cm−1 with a resolution of 4 cm−1, as shown in Figure 2a. The aperture size was 34 × 109 µm. The IR spectrum was assigned by referring to the data reported by Kobayashi and Shoji (1983, 1984), Nyquist and Kagel (1997), Nyquist et al. (1997a, b), and Makreski et al. (2011). The spectrum of katoite showed absorption bands at 3656 cm−1 attributed to O-H stretching vibrations, and at 1124 cm−1 attributed to the vibration of the (SO4)2− group [the ν3(SO4) mode]. The absorption bands at 931 and 879 cm−1 were tentatively assigned to the ν3(SiO4) mode, but another possible assignment for these bands is discussed later.
The chemical composition of katoite was determined using a JEOL JXA-8900R electron microprobe analyzer installed at the Geological Survey of Japan (GSJ) laboratory, Advanced Industrial Science and Technology (AIST), Tsukuba, Japan. Accelerating voltage, beam current, and beam diameter were 15 kV, 12 nA, and 3 µm, respectively. Synthetic quartz (for Si), rutile (Ti), corundum (Al), MnO (Mn), hematite (Fe), periclase (Mg), wollastonite (Ca), celestine (S), F-phlogopite (F), and natural Cl-rich hastingsite (Cl) were used as the standard materials. Matrix correction was conducted using the ZAF method. The detection limits for Cl and F were ∼0.02 and ∼0.05 wt% (2σ level), respectively. Na was not detected. Tables 1-3 list the chemical composition of katoite. All the analytical positions were carefully selected from the backscattered electron images to avoid contamination by adjacent minerals.
First, the chemical formulae of katoite were normalized by assuming that the sum of the anions, O + OH + F + Cl, was equal to 12.00 apfu, wherein the H2O content was calculated based on the stoichiometric assumption of Si + S + (OH + F + Cl)/4 = 3.00 apfu. This equation implies that (1) the Z cations are Si and S; (2) values of (OH + F + Cl) are controlled by the coupled substitution of Z□ + 4(OH−, F−, Cl−) = ZSi4+ + 4O2−; and (3) the sum of the Z cations and Z□ is equal to the ideal value of 3.00 apfu at the Z site. Vacancies were consequently introduced at the Z site. Table 1 presents these results. In many cases, Ca content was higher than the ideal value of 3.00 apfu at the X site (Table 1). The highest Ca content and analytical uncertainty (2σ) were 3.077 apfu (Table 1, No. 28) and ±0.025 apfu, respectively. As Ca resides exclusively at the X site (Grew et al., 2013), the chemical formula normalized by this method was not considered to be appropriate for katoite. Second, the chemical formula of katoite was normalized based on the assumption that the sum of the X and Y cations, Ca + Al + Fe + Mg + Mn + Ti, was equal to 5.00 apfu. H2O was calculated based on both the charge balance and the assumption that the sum of the anions was equal to 12.00 apfu. Table 2 presents these results. Subsequently, the Ca content was higher than the ideal value of 3.00 apfu at the X site (Table 2). In our study, katoite with higher S content (SO3 = 1.48-3.47 wt%) tends to have higher Ca content than that with lower S content (SO3 = 0.09-0.13 wt%) (Table 2). The highest Ca content and analytical uncertainty (2σ) were 3.119 apfu (Table 2, No. 28) and ±0.025 apfu, respectively. The chemical formula normalized using this method is also unlikely to be appropriate for katoite. Third, the chemical formulae of katoite were normalized based on the assumption that Ca content was equal to 3.00 apfu, implying that the X site was fully occupied by Ca. H2O was calculated based on both the charge balance and the assumption that the sum of the anions was equal to 12.00 apfu with all iron and sulfur ions being treated as Fe3+ and S6+, respectively. Consequently, vacancies were introduced at the Y site. Table 3 presents these results. Another possible normalization method is based on the assumption of (Ca + Fe2+ + Mg + Mn) = 3.00 apfu, implying that the X site is fully occupied by Ca, Fe2+, Mg, and Mn. However, this normalization method leads to higher amounts of vacancies introduced at the Y site compared to the assumption of Ca = 3.00 apfu. Significant number of vacancies at the Y site or significant garnet coupled heterovalent substitutions involving vacancies at the Y site have not been reported from natural garnets (Grew et al., 2013; Deer et al., 1997). From the perspective of both the stoichiometric limit of Ca at the X site (Ca ≤ 3.00 apfu) and the minimum amounts of vacancy at the Y site in the garnet structure, we considered that the normalization method based on the assumption of Ca = 3.00 apfu leads to the most appropriate chemical formula for the katoite in this study. Therefore, we adopted the data presented in Table 3 for the description and discussion of Tadano katoite. All sulfur was tentatively treated as S6+, but another possible valence state is discussed later. The normalization method based on the assumption that the X site is fully occupied by Ca was applied to the S-bearing katoite from the Northern Caucasus, Russia, as well (Galuskin et al., 2009).
| Sample | 1811 | 1901 | 1711 | 1711 | 1811 | 1711 | 1901 | 1901 | 1901 | 1901 | 1711 | 1811 | 1901a | 1811 |
| No. | 49 | 29 | 41 | 40 | 18 | 32 | 4 | 41 | 47 | 62 | 53 | 64 | 76# | 28 |
| Weight percentage | ||||||||||||||
| SiO2 | 14.18 | 14.48 | 16.65 | 16.65 | 15.70 | 16.51 | 16.90 | 16.54 | 15.81 | 17.12 | 17.80 | 16.96 | 17.08 | 15.36 |
| TiO2 | 0.55 | 0.36 | 0.29 | 0.22 | 0.44 | 0.30 | 0.52 | 0.40 | 0.45 | 0.39 | 0.23 | 0.39 | 0.30 | 0.29 |
| Al2O3 | 21.62 | 21.57 | 21.34 | 21.62 | 21.14 | 19.93 | 19.79 | 19.61 | 20.51 | 18.70 | 18.41 | 18.20 | 17.83 | 18.21 |
| Fe2O3 | 4.56 | 4.41 | 2.59 | 2.65 | 2.88 | 3.35 | 4.71 | 3.76 | 3.96 | 3.95 | 4.69 | 5.23 | 4.96 | 4.42 |
| MnO | 0.00 | 0.04 | n.d. | 0.00 | n.d. | n.d. | n.d. | n.d. | n.d. | 0.00 | n.d. | n.d. | n.d. | n.d. |
| MgO | 0.14 | 0.09 | 0.58 | 0.59 | 0.48 | 0.69 | 0.29 | 0.73 | 0.46 | 0.83 | 0.95 | 0.81 | 0.99 | 0.96 |
| CaO | 41.55 | 40.90 | 41.21 | 40.93 | 40.68 | 40.43 | 40.55 | 40.96 | 40.77 | 40.45 | 39.75 | 40.00 | 40.14 | 40.92 |
| SO3 | 0.09 | 0.13 | 1.48 | 1.66 | 1.80 | 2.04 | 2.23 | 2.32 | 2.65 | 2.87 | 2.92 | 2.94 | 2.95 | 3.47 |
| F | 0.93 | 0.80 | 0.78 | 0.71 | 0.86 | 0.72 | 0.58 | 0.80 | 0.53 | 0.49 | 0.54 | 0.51 | 0.54 | 0.66 |
| Cl | 0.11 | 0.09 | 0.26 | 0.23 | 0.58 | 0.28 | 0.20 | 0.63 | 0.90 | 0.85 | 0.47 | 0.41 | 0.44 | 0.33 |
| -O=F+Cl | 0.42 | 0.36 | 0.39 | 0.35 | 0.49 | 0.37 | 0.29 | 0.48 | 0.43 | 0.40 | 0.33 | 0.31 | 0.33 | 0.35 |
| H2O* | 17.67 | 17.17 | 15.06 | 15.12 | 15.28 | 14.35 | 14.52 | 14.35 | 15.16 | 13.43 | 12.94 | 13.62 | 13.33 | 14.46 |
| Total | 100.98 | 99.68 | 99.85 | 100.03 | 99.35 | 98.23 | 100.00 | 99.62 | 100.77 | 98.68 | 98.37 | 98.76 | 98.23 | 98.73 |
| Formulae based on the sum of anions: O + OH + F + Cl = 12.00 apfu | ||||||||||||||
| Ca | 3.002 | 2.996 | 3.038 | 3.006 | 3.009 | 3.046 | 3.008 | 3.054 | 2.986 | 3.065 | 3.028 | 3.028 | 3.062 | 3.077 |
| Al | 1.718 | 1.738 | 1.730 | 1.747 | 1.720 | 1.652 | 1.615 | 1.608 | 1.653 | 1.559 | 1.543 | 1.515 | 1.496 | 1.506 |
| Fe3+ | 0.231 | 0.227 | 0.134 | 0.137 | 0.150 | 0.177 | 0.245 | 0.197 | 0.204 | 0.210 | 0.251 | 0.278 | 0.266 | 0.233 |
| Mg | 0.014 | 0.009 | 0.059 | 0.060 | 0.049 | 0.072 | 0.030 | 0.076 | 0.047 | 0.088 | 0.101 | 0.085 | 0.105 | 0.100 |
| Mn | 0.000 | 0.002 | n.d. | 0.000 | n.d. | n.d. | n.d. | n.d. | n.d. | 0.000 | n.d. | n.d. | n.d. | n.d. |
| Ti | 0.028 | 0.019 | 0.015 | 0.011 | 0.023 | 0.016 | 0.027 | 0.021 | 0.023 | 0.021 | 0.012 | 0.021 | 0.016 | 0.015 |
| Sum Y | 1.991 | 1.995 | 1.939 | 1.955 | 1.942 | 1.917 | 1.918 | 1.902 | 1.926 | 1.877 | 1.907 | 1.900 | 1.883 | 1.856 |
| S | 0.005 | 0.007 | 0.076 | 0.085 | 0.093 | 0.108 | 0.116 | 0.121 | 0.136 | 0.152 | 0.156 | 0.156 | 0.158 | 0.183 |
| Si | 0.956 | 0.990 | 1.146 | 1.141 | 1.084 | 1.161 | 1.170 | 1.151 | 1.081 | 1.211 | 1.266 | 1.198 | 1.216 | 1.078 |
| F | 0.198 | 0.173 | 0.170 | 0.154 | 0.188 | 0.160 | 0.127 | 0.176 | 0.115 | 0.110 | 0.121 | 0.114 | 0.122 | 0.146 |
| Cl | 0.013 | 0.010 | 0.030 | 0.027 | 0.068 | 0.033 | 0.023 | 0.074 | 0.104 | 0.102 | 0.057 | 0.049 | 0.053 | 0.039 |
| O | 3.842 | 3.986 | 4.889 | 4.906 | 4.709 | 5.077 | 5.144 | 5.089 | 4.868 | 5.453 | 5.685 | 5.418 | 5.494 | 5.044 |
| OH | 7.947 | 7.831 | 6.911 | 6.913 | 7.035 | 6.730 | 6.706 | 6.661 | 6.913 | 6.336 | 6.137 | 6.419 | 6.331 | 6.770 |
*H2O was calculated based on both Si + S + (OH + F + Cl)/4 = 3.00 apfu and the assumption that the sum of the anions was equal to 12.00 apfu.
#Used for single-crystal X-ray diffraction study.
n.d., not detected.
| Sample | 1811 | 1901 | 1711 | 1711 | 1811 | 1711 | 1901 | 1901 | 1901 | 1901 | 1711 | 1811 | 1901a | 1811 |
| No. | 49 | 29 | 41 | 40 | 18 | 32 | 4 | 41 | 47 | 62 | 53 | 64 | 76# | 28 |
| Weight percentage | ||||||||||||||
| SiO2 | 14.18 | 14.48 | 16.65 | 16.65 | 15.70 | 16.51 | 16.90 | 16.54 | 15.81 | 17.12 | 17.80 | 16.96 | 17.08 | 15.36 |
| TiO2 | 0.55 | 0.36 | 0.29 | 0.22 | 0.44 | 0.30 | 0.52 | 0.40 | 0.45 | 0.39 | 0.23 | 0.39 | 0.30 | 0.29 |
| Al2O3 | 21.62 | 21.57 | 21.34 | 21.62 | 21.14 | 19.93 | 19.79 | 19.61 | 20.51 | 18.70 | 18.41 | 18.20 | 17.83 | 18.21 |
| Fe2O3 | 4.56 | 4.41 | 2.59 | 2.65 | 2.88 | 3.35 | 4.71 | 3.76 | 3.96 | 3.95 | 4.69 | 5.23 | 4.96 | 4.42 |
| MnO | 0.00 | 0.04 | n.d. | 0.00 | n.d. | n.d. | n.d. | n.d. | n.d. | 0.00 | n.d. | n.d. | n.d. | n.d. |
| MgO | 0.14 | 0.09 | 0.58 | 0.59 | 0.48 | 0.69 | 0.29 | 0.73 | 0.46 | 0.83 | 0.95 | 0.81 | 0.99 | 0.96 |
| CaO | 41.55 | 40.90 | 41.21 | 40.93 | 40.68 | 40.43 | 40.55 | 40.96 | 40.77 | 40.45 | 39.75 | 40.00 | 40.14 | 40.92 |
| SO3 | 0.09 | 0.13 | 1.48 | 1.66 | 1.80 | 2.04 | 2.23 | 2.32 | 2.65 | 2.87 | 2.92 | 2.94 | 2.95 | 3.47 |
| F | 0.93 | 0.80 | 0.78 | 0.71 | 0.86 | 0.72 | 0.58 | 0.80 | 0.53 | 0.49 | 0.54 | 0.51 | 0.54 | 0.66 |
| Cl | 0.11 | 0.09 | 0.26 | 0.23 | 0.58 | 0.28 | 0.20 | 0.63 | 0.90 | 0.85 | 0.47 | 0.41 | 0.44 | 0.33 |
| -O=F+Cl | 0.42 | 0.36 | 0.39 | 0.35 | 0.49 | 0.37 | 0.29 | 0.48 | 0.43 | 0.40 | 0.33 | 0.31 | 0.33 | 0.35 |
| H2O* | 17.59 | 17.08 | 14.82 | 14.71 | 14.76 | 13.97 | 13.75 | 13.89 | 14.24 | 12.85 | 12.28 | 12.88 | 12.78 | 13.77 |
| Total | 100.91 | 99.59 | 99.61 | 99.62 | 98.83 | 97.86 | 99.23 | 99.16 | 99.86 | 98.10 | 97.71 | 98.02 | 97.68 | 98.04 |
| Formulae based on Ca + Al + Fe + Mg + Mn+ Ti = 5.00 apfu | ||||||||||||||
| Ca | 3.006 | 3.001 | 3.052 | 3.030 | 3.039 | 3.069 | 3.054 | 3.081 | 3.039 | 3.101 | 3.068 | 3.072 | 3.096 | 3.119 |
| Al | 1.720 | 1.741 | 1.738 | 1.760 | 1.737 | 1.664 | 1.639 | 1.623 | 1.682 | 1.577 | 1.563 | 1.538 | 1.513 | 1.527 |
| Fe3+ | 0.232 | 0.227 | 0.135 | 0.138 | 0.151 | 0.179 | 0.249 | 0.199 | 0.207 | 0.213 | 0.254 | 0.282 | 0.269 | 0.237 |
| Mg | 0.014 | 0.009 | 0.060 | 0.061 | 0.050 | 0.073 | 0.030 | 0.076 | 0.048 | 0.089 | 0.102 | 0.087 | 0.106 | 0.102 |
| Mn | 0.000 | 0.002 | n.d. | 0.000 | n.d. | n.d. | n.d. | n.d. | n.d. | 0.000 | n.d. | n.d. | n.d. | n.d. |
| Ti | 0.028 | 0.019 | 0.015 | 0.011 | 0.023 | 0.016 | 0.027 | 0.021 | 0.024 | 0.021 | 0.012 | 0.021 | 0.016 | 0.016 |
| Sum Y | 1.994 | 1.999 | 1.948 | 1.970 | 1.961 | 1.931 | 1.946 | 1.919 | 1.961 | 1.899 | 1.932 | 1.928 | 1.904 | 1.881 |
| S | 0.005 | 0.007 | 0.077 | 0.086 | 0.094 | 0.108 | 0.118 | 0.122 | 0.138 | 0.154 | 0.158 | 0.158 | 0.159 | 0.185 |
| Si | 0.957 | 0.992 | 1.151 | 1.150 | 1.095 | 1.170 | 1.188 | 1.161 | 1.100 | 1.225 | 1.282 | 1.216 | 1.230 | 1.093 |
| F | 0.199 | 0.173 | 0.170 | 0.155 | 0.190 | 0.161 | 0.129 | 0.178 | 0.117 | 0.111 | 0.123 | 0.116 | 0.123 | 0.148 |
| Cl | 0.013 | 0.010 | 0.030 | 0.027 | 0.069 | 0.034 | 0.024 | 0.075 | 0.106 | 0.103 | 0.057 | 0.050 | 0.054 | 0.040 |
| O | 3.865 | 4.013 | 4.967 | 5.039 | 4.878 | 5.203 | 5.401 | 5.242 | 5.167 | 5.656 | 5.919 | 5.675 | 5.689 | 5.277 |
| OH | 7.924 | 7.804 | 6.832 | 6.779 | 6.864 | 6.602 | 6.447 | 6.505 | 6.610 | 6.130 | 5.901 | 6.160 | 6.135 | 6.534 |
*H2O was calculated based on both the charge balance and the assumption that the sum of the anions was equal to 12.00 apfu.
#Used for single-crystal X-ray diffraction study.
n.d., not detected.
| Sample | 1811 | 1901 | 1711 | 1711 | 1811 | 1711 | 1901 | 1901 | 1901 | 1901 | 1711 | 1811 | 1901a | 1811 |
| No. | 49 | 29 | 41 | 40 | 18 | 32 | 4 | 41 | 47 | 62 | 53 | 64 | 76# | 28 |
| Weight percentage | ||||||||||||||
| SiO2 | 14.18 | 14.48 | 16.65 | 16.65 | 15.70 | 16.51 | 16.90 | 16.54 | 15.81 | 17.12 | 17.80 | 16.96 | 17.08 | 15.36 |
| TiO2 | 0.55 | 0.36 | 0.29 | 0.22 | 0.44 | 0.30 | 0.52 | 0.40 | 0.45 | 0.39 | 0.23 | 0.39 | 0.30 | 0.29 |
| Al2O3 | 21.62 | 21.57 | 21.34 | 21.62 | 21.14 | 19.93 | 19.79 | 19.61 | 20.51 | 18.70 | 18.41 | 18.20 | 17.83 | 18.21 |
| Fe2O3 | 4.56 | 4.41 | 2.59 | 2.65 | 2.88 | 3.35 | 4.71 | 3.76 | 3.96 | 3.95 | 4.69 | 5.23 | 4.96 | 4.42 |
| MnO | 0.00 | 0.04 | n.d. | 0.00 | n.d. | n.d. | n.d. | n.d. | n.d. | 0.00 | n.d. | n.d. | n.d. | n.d. |
| MgO | 0.14 | 0.09 | 0.58 | 0.59 | 0.48 | 0.69 | 0.29 | 0.73 | 0.46 | 0.83 | 0.95 | 0.81 | 0.99 | 0.96 |
| CaO | 41.55 | 40.90 | 41.21 | 40.93 | 40.68 | 40.43 | 40.55 | 40.96 | 40.77 | 40.45 | 39.75 | 40.00 | 40.14 | 40.92 |
| SO3* | 0.09 | 0.13 | 1.48 | 1.66 | 1.80 | 2.04 | 2.23 | 2.32 | 2.65 | 2.87 | 2.92 | 2.94 | 2.95 | 3.47 |
| F | 0.93 | 0.80 | 0.78 | 0.71 | 0.86 | 0.72 | 0.58 | 0.80 | 0.53 | 0.49 | 0.54 | 0.51 | 0.54 | 0.66 |
| Cl | 0.11 | 0.09 | 0.26 | 0.23 | 0.58 | 0.28 | 0.20 | 0.63 | 0.90 | 0.85 | 0.47 | 0.41 | 0.44 | 0.33 |
| -O=F+Cl | 0.42 | 0.36 | 0.39 | 0.35 | 0.49 | 0.37 | 0.29 | 0.48 | 0.43 | 0.40 | 0.33 | 0.31 | 0.33 | 0.35 |
| H2O** | 17.70 | 17.11 | 15.72 | 15.23 | 15.43 | 15.13 | 14.67 | 15.28 | 14.92 | 14.54 | 13.42 | 14.09 | 14.38 | 15.78 |
| Total | 101.01 | 99.62 | 100.51 | 100.14 | 99.49 | 99.02 | 100.15 | 100.55 | 100.54 | 99.79 | 98.84 | 99.24 | 99.28 | 100.05 |
| Formulae based on Ca = 3.00 apfu | ||||||||||||||
| Ca | 3 | 3 | 3 | 3 | 3 | 3 | 3 | 3 | 3 | 3 | 3 | 3 | 3 | 3 |
| Al | 1.717 | 1.740 | 1.709 | 1.743 | 1.715 | 1.627 | 1.611 | 1.580 | 1.660 | 1.526 | 1.528 | 1.501 | 1.466 | 1.469 |
| Fe3+ | 0.231 | 0.227 | 0.132 | 0.136 | 0.149 | 0.175 | 0.245 | 0.193 | 0.205 | 0.206 | 0.249 | 0.275 | 0.260 | 0.228 |
| Mg | 0.014 | 0.009 | 0.059 | 0.060 | 0.049 | 0.071 | 0.030 | 0.074 | 0.047 | 0.086 | 0.100 | 0.085 | 0.103 | 0.098 |
| Mn | 0.000 | 0.002 | n.d. | 0.000 | n.d. | n.d. | n.d. | n.d. | n.d. | 0.000 | n.d. | n.d. | n.d. | n.d. |
| Ti | 0.028 | 0.019 | 0.015 | 0.011 | 0.023 | 0.016 | 0.027 | 0.021 | 0.023 | 0.020 | 0.012 | 0.021 | 0.016 | 0.015 |
| Sum Y | 1.990 | 1.998 | 1.915 | 1.951 | 1.936 | 1.888 | 1.912 | 1.868 | 1.935 | 1.837 | 1.889 | 1.882 | 1.845 | 1.809 |
| S* | 0.005 | 0.007 | 0.075 | 0.085 | 0.093 | 0.106 | 0.116 | 0.119 | 0.137 | 0.149 | 0.154 | 0.154 | 0.154 | 0.178 |
| Si | 0.956 | 0.991 | 1.131 | 1.139 | 1.081 | 1.143 | 1.167 | 1.131 | 1.086 | 1.185 | 1.254 | 1.187 | 1.191 | 1.051 |
| F | 0.198 | 0.173 | 0.168 | 0.154 | 0.187 | 0.158 | 0.127 | 0.173 | 0.115 | 0.107 | 0.120 | 0.113 | 0.119 | 0.143 |
| Cl | 0.013 | 0.010 | 0.030 | 0.027 | 0.068 | 0.033 | 0.023 | 0.073 | 0.105 | 0.100 | 0.056 | 0.049 | 0.052 | 0.038 |
| O | 3.834 | 4.005 | 4.678 | 4.872 | 4.662 | 4.819 | 5.095 | 4.788 | 4.944 | 5.081 | 5.521 | 5.258 | 5.140 | 4.617 |
| OH | 7.955 | 7.811 | 7.124 | 6.948 | 7.083 | 6.991 | 6.755 | 6.966 | 6.836 | 6.712 | 6.303 | 6.581 | 6.689 | 7.202 |
| S4+*** | 0.005 | 0.002 | 0.075 | 0.049 | 0.064 | 0.106 | 0.088 | 0.119 | 0.065 | 0.149 | 0.111 | 0.118 | 0.154 | 0.178 |
| S6+*** | 0.000 | 0.004 | 0.000 | 0.036 | 0.029 | 0.000 | 0.028 | 0.000 | 0.072 | 0.000 | 0.043 | 0.036 | 0.000 | 0.000 |
| O*** | 3.825 | 4.000 | 4.528 | 4.774 | 4.534 | 4.607 | 4.919 | 4.550 | 4.814 | 4.783 | 5.299 | 5.022 | 4.831 | 4.261 |
| OH*** | 7.964 | 7.816 | 7.275 | 7.046 | 7.211 | 7.203 | 6.931 | 7.204 | 6.966 | 7.010 | 6.525 | 6.817 | 6.998 | 7.558 |
| Weight percentage | ||||||||||||||
| SO2*** | 0.07 | 0.04 | 1.18 | 0.76 | 0.99 | 1.63 | 1.36 | 1.86 | 1.01 | 2.30 | 1.68 | 1.80 | 2.36 | 2.78 |
| SO3*** | 0.00 | 0.08 | 0.00 | 0.71 | 0.56 | 0.00 | 0.53 | 0.00 | 1.39 | 0.00 | 0.82 | 0.70 | 0.00 | 0.00 |
| H2O*** | 17.72 | 17.12 | 16.05 | 15.44 | 15.71 | 15.59 | 15.05 | 15.80 | 15.21 | 15.18 | 13.89 | 14.60 | 15.04 | 16.56 |
| Total*** | 101.01 | 99.62 | 100.55 | 100.16 | 99.53 | 99.07 | 100.19 | 100.61 | 100.57 | 99.86 | 98.89 | 99.29 | 99.35 | 100.13 |
*Total S as SO3.
**H2O was calculated based on both the charge balance and the assumption that the sum of the anions was equal to 12.00 apfu.
***Recalculated (see the text for the recalculation procedures).
#Used for single-crystal X-ray diffraction study.
n.d., not detected.
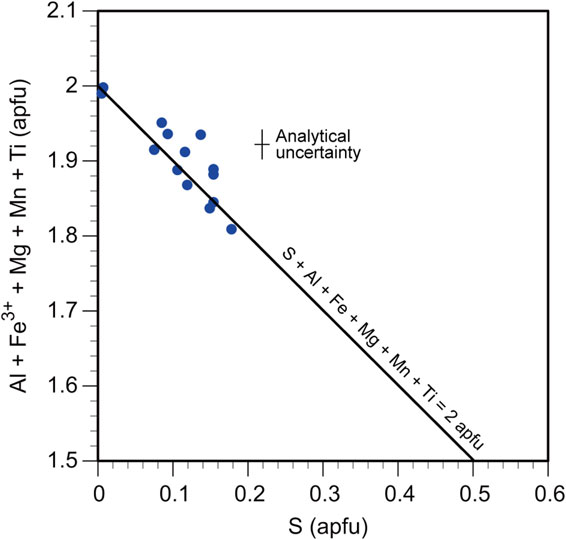
The compositional range of Si is 0.96-1.25 apfu. Katoite has a range of compositions, wherein Al = 1.47-1.74 apfu, Fe = 0.13-0.28 apfu, Mg = 0.01-0.10 apfu, and S = 0.01-0.18 apfu, and contains appreciable amounts of F (0.11-0.20 apfu) and Cl (0.01-0.11 apfu). The compositional variations in S versus (Al + Fe + Mg + Mn + Ti) for the data listed in Table 3 are shown in Figure 3. A negative correlation was observed between these two parameters. The value of (Al + Fe + Mg + Mn + Ti) represents the sum of the cations that can occupy the Y site. This value tends to decrease from 2.00 to 1.81 apfu along the straight line of S + Al + Fe + Mg + Mn + Ti = 2.00 apfu with increasing S content (Fig. 3), implying that sulfur is incorporated into the Y site.
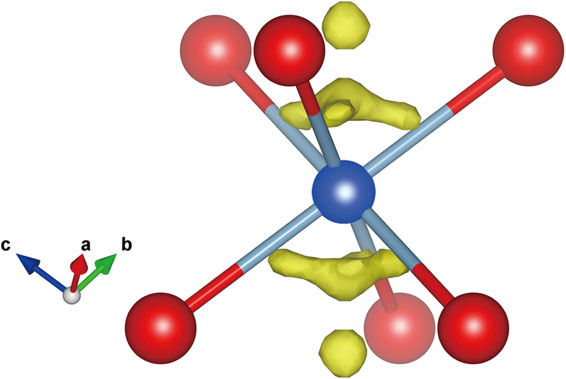
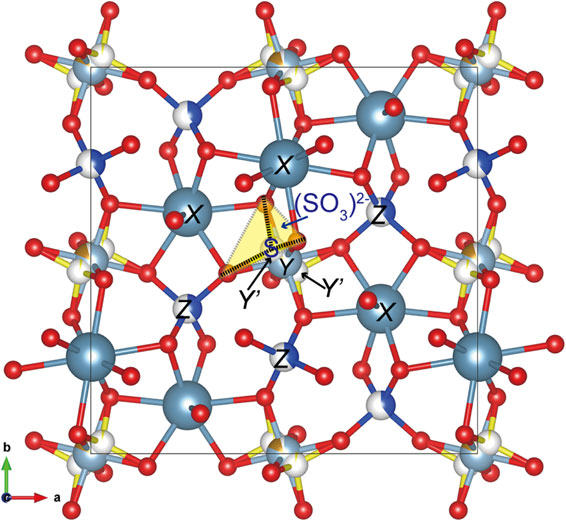
A single-crystal fragment of katoite extracted from a thin section used for electron microprobe analysis was mounted on a glass fiber and analyzed by X-ray diffraction. Single-crystal X-ray studies were conducted at room temperature with monochromated MoKα radiation on a Rigaku Synergy-Custom diffractometer equipped with a HyPix-6000He detector housed at the National Museum of Nature and Science, Tsukuba, Japan. Data collection and reduction, including empirical absorption correction, were conducted using the CrysAlis Pro software. The crystal structure was solved by the charge flipping method using the Superflip software (Palatinus and Chapuis, 2007). After confirming the structure type, structure refinement was conducted using SHELXL (Sheldrick, 2015) using the atomic scattering factors of the neutral atoms. The first refinement was conducted based on a normal model containing X, Y, and Z sites in the garnet structure, yielding an R1 value [F2 > 2σ(F2)] of 0.0380. The occupancies of the Y and Z sites were constrained to 1 and refined as Al versus Fe and Si versus □, respectively. Refinement of the site occupancies yielded [0.861(8)Al + 0.139(8)Fe] for the Y site and 0.403(7)Si for the Z site. The occupancy of Ca at the X site was fixed at 1. However, the position of the H atom could not be determined. The chemical formula of the fragment used for X-ray diffraction was {Ca3}[Al1.466Fe0.260Mg0.103Ti0.016]Σ1.85(□1.655Si1.191S0.154)Σ3.00[(OH)6.689O5.140F0.119Cl0.052]Σ12.00, assuming that all S occurred at the Z site (Table 3, No. 76). Based on the aforementioned formula (model 1), the calculated Y-site-scattering value was found to be smaller than the refined value, whereas the calculated Z-site-scattering value is larger than the refined value (Table 4). Subsequently, we used the formula assuming that all S occurred at the Y site (model 2), and the resultant calculated site-scattering values were close to the refined values (Table 4). The residual electron density near the Y site (Wyckoff position = 16a) was detected on a difference Fourier map after the convergence of the first refinement (Fig. 4). Therefore, we interpreted that S occurred at the position of the residual electron density, which is represented as the Y’ site (Wyckoff position = 32e). We then conducted refinement to introduce the Y’ site, and this yielded a smaller R1 value [F2 > 2σ(F2)] of 0.0353 than the first refinement (0.0380). Based on the chemical formula, the sum of the occupancies of Al and Fe at the Y site was constrained to 0.9225, and the occupancy of S at the Y’ site was fixed at 0.0385. The details of the sample, data collection, and structural refinement are presented in Table 5. The final atomic coordinates, cation occupancies, and displacement parameters are presented in Table 6. The final site populations and a comparison between the refined and calculated site-scattering values are presented in Table 7. The projection of the structure along the [001] direction is shown in Figure 5. The position of the Y’ site and the interatomic distance of Y’-O [1.60(2) Å] suggest that S at the Y’ site has three-fold coordination. We interpreted that S occurs as either (S2O6)2− (two-sulfur model) or (SO3)2− (one-sulfur model) in an octahedron. In the latter case, only one of the two symmetrically equivalent positions is occupied by S because the multiplicity of the Y’ site is double that of the Y site.
| Site | Site population (apfu) | Site-scattering value (epfu*) | |
| Model 1 | Refined | Calculated | |
| Y | 1.466Al + 0.260Fe3+ + 0.103Mg + 0.016Ti | 29.6 | 27.4 |
| Z | 1.191Si + 0.154S | 16.9 | 19.1 |
| Model 2 | Refined | Calculated | |
| Y | 1.466Al + 0.260Fe3+ + 0.103Mg + 0.016Ti + 0.154S | 29.6 | 29.9 |
| Z | 1.191Si | 16.9 | 16.7 |
*Electrons per formula unit.
| a (Å) | 12.24095(8) |
| V (Å3) | 1834.20(4) |
| Space group | Ia3d |
| Z | 8 |
| Dcalc. (g/cm3) | 3.013(5) |
| μ (mm−1) | 2.635 |
| Radiation | MoKα |
| Reflection range | −21 ≤ h ≤ 21 |
| −20 ≤ k ≤ 20 | |
| −20 ≤ l ≤ 21 | |
| No. of measured reflections | 51942 |
| No. of unique reflections | 425 |
| No. of observed reflections [F2 > 2σ(F2)] | 394 |
| Rint | 0.0248 |
| Variable parameters | 23 |
| R1 [F2 > 2σ(F2)], R1 (all reflections) | 0.0353, 0.0388 |
| wR2 (all reflections) | 0.0909 |
| Weighting parameters, a, b | 0.0261, 6.5262 |
| Goodness of Fit | 1.297 |
| Final Δρmax (e/Å3) | 0.368 |
| Final Δρmin (e/Å3) | −0.370 |
R1 = Σ| |Fo| − |Fc| |/Σ|Fo|.
wR2 = {Σ[w(Fo2 − Fc2)2]/Σ[w(Fo2)2]}0.5.
w = 1/[σ2(Fo2) + (aP)2 + bP].
P = (2Fc2 + Fo2)/3.
| Site | W* | Occupancy | x | y | z | Ueq |
| X | 24c | Ca | 0.25000 | 0.12500 | 0 | 0.01666(15) |
| Y | 16a | 0.743(3)Al + 0.180(3)Fe | 0 | 0 | 0 | 0.0181(2) |
| Y’ | 32e | 0.03850S | 0.036(5) | 0.036(5) | 0.036(5) | 0.12(3)** |
| Z | 24d | 0.406(6)Si | 0.37500 | 0 | 0.25000 | 0.0102(5) |
| O | 96h | O | 0.20036(13) | 0.28347(13) | 0.10372(12) | 0.0278(3) |
| Site | U11 | U22 | U33 | U23 | U13 | U12 |
| X | 0.01723(19) | 0.0155(2) | 0.01723(19) | 0 | 0.00415(19) | 0 |
| Y | 0.0181(2) | 0.0181(2) | 0.0181(2) | −0.0009(2) | −0.0009(2) | −0.0009(2) |
| Z | 0.0102(8) | 0.0101(6) | 0.0101(6) | 0 | 0 | 0 |
| O | 0.0240(6) | 0.0333(8) | 0.0260(7) | −0.0114(5) | −0.0062(5) | 0.0072(5) |
*Wyckoff position.
**Isotropic displacement parameter.
| Site | Site population (apfu) | Site-scattering value (epfu) | |
| Refined | Calculated | ||
| Y | 1.466Al + 0.260Fe3+ + 0.103Mg + 0.016Ti | 28.7 | 27.4 |
| Y’ | 0.154S | 2.5* | 2.5 |
| Sum of Y and Y’ | 1.466Al + 0.260Fe3+ + 0.103Mg + 0.016Ti + 0.154S | 31.1 | 29.9 |
| Z | 1.191Si | 17.1 | 16.7 |
*Fixed value based on the electron microprobe analysis.
Based on the results of the aforementioned structural refinements, we examined whether the characteristic bands of (S2O6)2− and (SO3)2− were present or absent in the IR spectrum by referring to the IR data of inorganic materials containing these anions (Ross, 1972; Nyquist and Kagel 1997; Nyquist et al., 1997a, b). As shown in Figure 2a, katoite showed no distinct absorption band at approximately 1200 cm−1, which is one of the strong bands of (S2O6)2−, thereby indicating the absence of (S2O6)2−. Inorganic materials containing (SO3)2−, such as Na2SO3, MgSO3·6H2O, and SrSO3 (Nyquist and Kagel 1997; Nyquist et al., 1997a), have a very strong IR band of the ν3(SO3) mode within 911-980 cm−1; however, this band appears within a range of 800-1000 cm−1 for strong absorbance due to the antisymmetric stretching vibration of the SiO4 tetrahedra [the ν3(SiO4) mode] in synthetic “hydrogrossular” (cf. Kobayashi and Shoji, 1983). Based on the IR spectra of synthetic “hydrogrossular” and “hydrograndite” observed by Kobayashi and Shoji (1983, 1984, 1987), doublet ν3(SiO4) bands near 850 and 910 cm−1 become weaker and more diffuse with decreasing Si content, as indicated by Żabiński (1966) and Passaglia and Rinaldi (1984). The absorbance of the two ν3(SiO4) bands became approximately equivalent when the Si content was ∼2 apfu (Kobayashi and Shoji, 1984) (cf. Figs. 2b and 2c). Moreover, synthetic “hydroandradite” with Si = ∼1 apfu showed only one band near 900 cm−1 (Cohen-Addad, 1970) (cf. Fig. 2d). As the Si content of katoite (Si = 0.96-1.25 apfu) is close to that of the synthetic “hydroandradite” (Si = 1.15 apfu), only one broad band was expected to be observed in the range of 800-1000 cm−1. However, in this study, the two bands were characterized by a much stronger absorbance band at 931 cm−1 than that at 879 cm−1 (Fig. 2a). Hence, the spectral pattern for the doublet ν3(SiO4) bands of the Tadano kaoite seemingly differs from that of the synthetic S-free hydroxyl garnets (Figs. 2b-2d). Thus, we interpret that this is due to the overlap of the ν3(SO3) band with the single ν3(SiO4) band. The absorption band at 1124 cm−1 was attributed to the ν3(SO4) mode. Therefore, the combined results of IR spectroscopy and structure refinement imply that in Tadano katoite, S4+ and S6+, forming (SO3)2− and (SO4)2− coordinations, are placed at the Y’ and Z sites, respectively. The structural refinement results suggest that S is preferentially allotted to the Y’ site as S4+ to compensate for the deficiency of the octahedral cations Al, Fe, Mg, Mn, and Ti at the Y site. The chemical formulae of katoite in Table 3 indicate an appreciable variation in the value of (S + Al + Fe + Mg + Mn +Ti), ranging between 1.99 and 2.07 apfu (cf. Fig. 3). The values of (S + Al + Fe + Mg + Mn +Ti) that are appreciably higher than 2.00 apfu indicate the presence of S6+ at the Z site because the ideal sum of the cations at the Y’ and Y sites is 2.00 apfu. The S4+ and S6+ contents estimated in Table 3 provided the maximum and minimum values, respectively. The numbers of OH groups and O atoms were recalculated based on the S4+ and S6+ contents. The SO2, SO3, and H2O wt% corresponding to the S4+, S6+, and OH contents are presented at the bottom of Table 3. The chemical formula of the averaged compositions listed in Table 3 is as follows {Ca3}[(Al1.614Fe3+0.208Mg0.063Ti0.019)Σ1.90S4+0.096]Σ2.00(□1.867Si1.120S6+0.013)Σ3.00[(OH)7.192O4.612F0.147Cl0.048]Σ12.00.
Passaglia and Rinaldi (1984) reported the IR spectrum of the holotype katoite with S = 0.11 apfu, wherein all sulfur atoms bearing a charge of +6 are located at the Z site. Within the range of 800-1200 cm−1, we observed an absorption band at ∼1100 cm−1 attributed to the ν3(SO4) mode, and two broad bands at ∼860 and ∼940 cm−1 ascribed to the ν3(SiO4) and ν3(SO3) modes, respectively. The band at ∼940 cm−1 shows a higher absorbance than that at ∼860 cm−1. This spectral pattern was very similar to that observed in our data. Moreover, the sum of the octahedral cations in the chemical formula [(Al + Mg) = 1.86 apfu] was less than the ideal value of 2.00 apfu. Therefore, it seems highly likely that in holotype katoite, sulfur atoms not only form (SO4)2− coordination at the Z site but also form (SO3)2− coordination at the Y’ site.
We thank T. Sato, E. Hirabayashi, and H. Fukusako for preparing the polished thin sections used in this study. We are also grateful for the constructive reviews by Prof. S. Kobayashi and Dr. A. Kyono, and to the anonymous reviewer for improving the manuscript.