Abstract
Single crystals of CaW1−xMoxO4 scheelite-powellite solid solutions (x = 0.0, 0.03, 0.08, 0.2, 0.3, 0.5, 0.8, and 1.0) were synthesized using a melting method. The light emission spectra of the solid solutions were measured using a JASCO FP-8300 fluorescence spectrometer. The maximum fluorescence peak at 419 nm in the CaWO4 scheelite end-member greatly decreases in intensity and shifts its peak position to 451 nm with only 3% Mo substitution. The change in near-ultraviolet light emission intensity at 292 and 301 nm are more moderate than those in the strong peak at 419 nm. The tendency of change in intensity and wavelength shift due to the Mo substitution differs among these fluorescence peaks. Single crystal X-ray diffraction experiments for the CaW1−xMoxO4 solid solutions (x = 0.0, 0.2, 0.3, 0.5, 0.8, and 1.0) were carried out using a Rigaku Super-Nova Single source at offset/far HyPix3000 diffractometer. The R1 index for CaW1−xMoxO4 solid solutions were convergent to 1.22-1.71% using anisotropic temperature factors. The expansion of the c-axis and shrinkage of the unit cell volume were induced with an increase in Mo content. The significant increase in the angle ∡Ocloser-Ca-Ocloser was directly related to the expansion of the c-axis. The Debye temperature ΘD for Ca, W, and O atoms in CaWO4 were 381, 198, and 534 K, respectively. The obtained ΘD for Ca, Mo, and O atoms in CaMoO4 were 363, 257, and 503 K, respectively. The phonon density of states estimated from the lattice dynamics calculations coincided with the observed ΘD values.
INTRODUCTION
Scheelite (calcium tungstate, CaWO4) and powellite (calcium molybdate, CaMoO4) are known as primary ore minerals in skarn, hydrothermal and pegmatite ore deposits (Sato, 1980; Brugger et al., 1998). The constituent elements W and Mo in these minerals are industrially important rare metals. Mo is an essential element for humans and other organisms. Excessive intake of W by organisms causes deficiency of Mo. It is thought that the nitrogen-fixed enzyme in higher organisms changed from W to Mo dependence because the life species in the early geological ages use W-containing enzymes for life activities (Kletzin and Adams, 1996; Williams, 2011). We speculate that Mo intake may have been more difficult than W intake following mineralogical factors. Mo and W belong to the same group, 6 homologue. The abundance of lighter Mo elements is higher than that of heavier W. The description of powellite is rare compared to the common occurrence of scheelite. Among the Mo-containing minerals, molybdenite (MoS2) is commonly found, whereas W sulfides are relatively rare. Molybdenite (MoS2) and scheelite (CaWO4) are often found as coexisting minerals in the same ore deposit. W and Mo have different siderophile natures (Goldschmit, 1937), and Mo tends to strongly fractionate into sulfide phases. The partial pressures of sulfur and/or oxidation state alter the occurrence of these mineral species.
Both scheelite and powellite belong to the scheelite group mineral with the general formula of AMO4 (space group I41/a), with W and Mo occupying the M-sites (Aleksandrov et al., 1968; Hazen et al., 1985). The crystal structures of both endmembers have been refined by Hazen et al. (1985). These group 6 elements in the periodic table have similar chemical properties and effective ionic radii (IVW6+ = 0.42 Å, IVMo6+ = 0.41 Å, Shannon, 1976). Therefore, it can be inferred that these two elements readily undergo substitution in solid solutions. However, most large crystals in scheelite and powellite systems have end-member compositions in natural occurrences, and narrow-range solid-solution formations are rare (Orhan, 2017). There are few reports of the solid-solution formation over a wide compositional range. The different siderophile natures of W and Mo (Goldschmit, 1937) related to mineralogical factors are one reason why the solid solution system does not have a wide compositional range. Therefore, synthesis of crystals over the entire range of CaW1−xMoxO4 solid solutions was necessary for the understanding of the systematic structural changes in the solid solution.
Scheelite and powellite are well-known fluorescent minerals; scheelite emits bright bluish-white fluorescence, and powellite emits cream yellow fluorescence. Several synthetic experiments on scheelite-powellite solid solutions were conducted during researches on fluorescent materials (Shoji and Sasaki, 1978; Tyson et al., 1988; Nakamura et al., 2002; Mikhailik et al., 2004, 2005). It has been reported that the fluorescent properties of the solid solution change with the substitution of Mo (Shoji and Sasaki, 1978; Tyson et al., 1988; Nakamura et al., 2002). Different compositional dependencies of unit cell parameters were reported based on the powder X-ray diffraction experiments, especially in the intermediate composition area (Fernández-González et al., 2007; Kitakaze et al., 2014). However, a decrease in the a-axis and an increase in the c-axis were basically observed in solid solutions depending on the amount of Mo substitution. A single crystal structure analysis of the solid solution has not yet been performed.
In this study, we synthesized single crystals of CaW1−xMoxO4 (x = 0.0-1.0) scheelite-powellite solid solutions and performed crystal structural refinements using single-crystal X-ray diffraction. We investigated the fluorescence properties of the synthesized samples and their composition dependence, including the peak intensity of the near-ultraviolet light emission. Detailed structural analyses of the solid solutions over a wide compositional range revealed structural features with unique unit cell parameter changes, based on the crystallographic observations.
EXPERIMENTAL
Syntheses and chemical analyses
Single crystals of CaW1−xMoxO4 scheelite-powellite solid solutions (x = 0.0, 0.03, 0.08, 0.2, 0.3, 0.5, 0.8, and 1.0) were synthesized using a melting method. Stoichiometrically weighed reagents of Na2WO4·2H2O, Na2MoO4·2H2O, and CaCl2 (Wako Pure Chemical Industries, Ltd.) were uniformly mixed using an agate mortar and pelletized. It was heated at 900 °C in argon atmosphere for two hours and gradually cooled to room temperature. Aggregates of polyhedral granular crystals, which were colorless and transparent, and approximately 50-200 µm in size, were synthesized. Chemical compositions were determined using a JEOL scanning electron microscope (SEM, JSM-7001F operated at 15 kV, 1.0 nA) equipped with Oxford energy dispersive X-ray spectroscopy (EDS, INCA SYSTEM). The following standard materials were used; CaSiO3 for Ca, molybdenum metal for Mo, and tungsten metal for W. The deviation from 100% in total weight percent and from the ideal number of the chemical formula obtained by specifying the number of anions was less than 0.5%. Relative analytical errors (1σ) of standard compounds were generally better than ~ 1%. The fluctuation in the Mo/(W + Mo) molar ratio among the synthetic solid-solution crystals was approximately a few percent (Table 1). The chemical composition of each solid-solution sample was almost equal to the charged value.
Table 1. Chemical compositions of synthesized samples used for structure analyses
| wt% |
CaWO4
(9 points data) |
CaW0.78Mo0.22O4
(10 points data) |
CaW0.66Mo0.34O4
(7 points data) |
CaW0.51Mo0.49O4
(12 points data) |
CaW0.21Mo0.79O4
(8 points data) |
CaMoO4
(8 points data) |
| |
Average |
Range |
Average |
Range |
Average |
Range |
Average |
Range |
Average |
Range |
Average |
Range |
| CaO |
19.13(11) |
19.0-19.3 |
20.29(15) |
20.1-20.4 |
21.12(16) |
21.0-21.3 |
22.41(13) |
22.4-22.5 |
25.2(2) |
24.8-25.6 |
27.36(13) |
27.1-27.5 |
| MoO3 |
- |
|
10.1(9) |
9.7-11.3 |
18.3(10) |
17.9-19.3 |
29.9(12) |
29.2-30.6 |
52.4(8) |
51.2-54.4 |
72.4(6) |
71.4-72.9 |
| WO3 |
81.0(3) |
80.5-81.4 |
69.6(7) |
68.3-70.3 |
60.5(6) |
59.5-61.1 |
47.5(8) |
45.8-48.4 |
22.5(7) |
21.2-23.6 |
- |
|
| Total |
100.1(4) |
99.6-100.5 |
99.9(7) |
99.1-100.8 |
99.9(8) |
99.0-100.7 |
99.7(7) |
99.1-100.3 |
99.9(6) |
99.0-100.9 |
99.8(7) |
98.6-100.3 |
| mol% |
(O = 4) |
|
|
| Ca |
0.982(5) |
0.98-0.99 |
0.981(6) |
0.97-0.99 |
0.978(6) |
0.97-0.98 |
0.979(5) |
0.97-0.98 |
0.980(8) |
0.97-0.99 |
0.976(3) |
0.97-0.98 |
| Mo |
- |
|
0.189(8) |
0.18-0.21 |
0.330(6) |
0.32-0.35 |
0.507(7) |
0.50-0.52 |
0.796(7) |
0.78-0.82 |
1.006(4) |
1.00-1.01 |
| W |
1.006(2) |
1.00-1.01 |
0.813(6) |
0.80-0.82 |
0.678(5) |
0.66-0.68 |
0.501(5) |
0.49-0.51 |
0.212(5) |
0.20-0.23 |
- |
|
| Total |
1.988 |
|
1.983 |
|
1.986 |
|
1.987 |
|
1.988 |
|
1.982 |
|
Fluorescence spectrum analysis
Light emission spectra of synthesized crystals of CaW1−xMoxO4 scheelite-powellite solid solutions (x = 0.0, 0.03, 0.08, 0.2, 0.3, 0.5, 0.8, and 1.0) were measured using JASCO FP-8300 Fluorescence Spectrometer with 254.6 nm excitation at 24 °C. The bandwidths on the excitation and fluorescence side were 5 and 2.5 nm, respectively. A xenon lamp was used as the light source. The measurements were carried out in the range of 210-750 nm. Pellets with a diameter of 10 mm and a thickness of 3 mm were prepared. All samples were measured under the same conditions and with the same geometry.
Single crystal structure analyses
Single-crystal X-ray diffraction experiments were performed on the scheelite-powellite CaW1−xMoxO4 solid solutions (x = 0.0, 0.2, 0.3, 0.5, 0.8, and 1.0) using a Rigaku Super-Nova Single source at offset/far HyPix3000 diffractometer. Suitable single crystals were carefully selected for the structure analysis. Systematic absences were consistent with space group I41/a. No evidence of symmetry reduction was detected in any of the crystals. The intensity of reflection was measured using MoKα radiation (λ = 0.71073 Å). Data corrections for Lorentz and polarization effects, and for the absorption were carried out using CrysAlisPro (Rigaku OD, 2017). The absorption correction was performed using an integration method based on the observed arbitrary shape of the specimens. Details of the data collection are listed in Table 2 and the CIF file (Supplementary CIF file available online from https://doi.org/10.2465/jmps.220901). The refinements were performed using the program SHELXL (Sheldrick, 2015). Scattering factors for neutral atoms and anomalous dispersion coefficients were taken from International Tables for Crystallography, Volume C (Wilson, 1992). During least-square refinements, a correction for isotropic extinction was applied. The site occupancy factor, g, for the M site was refined using the atomic scattering factors of W and Mo. A scattering factor, gf(W) + (1 − g)f(Mo), was used for the composite atom at the M site, where f(W) and f(Mo) are the scattering factors of W and Mo respectively. After several refinement cycles, the displacement parameters were converted from isotropic to anisotropic values. The R1 index (=Σ||Fo|−|Fc||/Σ|Fo|) for CaW1−xMoxO4 solid solutions were convergent to 1.22-1.71% using anisotropic temperature factors. Although the diffraction experiment system has an accuracy that can determine the hydrogen atom positions, residual electrons of about ±1.4 e/Å3 remained due to the presence of heavy element W (Table 2). The crystal structure was illustrated using VESTA (Momma and Izumi, 2011). The structural refinement data and selected interatomic distances are listed in Tables 2-5.
Table 2. Crystallographic data, data collection parameters and refinement parameters in the CaW
1−xMo
xO
4 scheelite-pauellite solid solution (
x = 0.0-1.0)
| Crystal data |
CaWO4 |
CaW0.78Mo0.22O4 |
CaW0.66Mo0.34O |
CaW0.51Mo0.49O4 |
CaW0.21Mo0.79MoO4 |
CaMoO4 |
| Space group |
I41/a (No. 88) |
| a (Å) |
5.24270(10) |
5.24000(10) |
5.23680(10) |
5.23380(10) |
5.22700(10) |
5.22360(10) |
| c (Å) |
11.3720(2) |
11.3810(3) |
11.3972(4) |
11.4011(2) |
11.4095(3) |
11.4285(4) |
| V (Å3) |
312.570(13) |
312.495(14) |
312.558(16) |
312.306(13) |
311.725(14) |
311.838(16) |
| Z |
4 |
| Crystal size (mm) |
0.051×0.041×0.030 |
0.043×0.030×0.027 |
0.048×0.043×0.034 |
0.061×0.053×0.048 |
0.037×0.029×0.028 |
0.047×0.043×0.041 |
| μ (mm−1) |
38.417 |
31.873 |
27.607 |
22.055 |
12.242 |
5.670 |
| Wavelength (Å) |
0.71073 |
| Diffractometer |
Rigaku XtaLAB SuperNova |
| Range of h, k, l |
−10 ≤ h ≤ 10 |
−10 ≤ h ≤ 10 |
−10 ≤ h ≤ 10 |
−11 ≤ h ≤ 11 |
−11 ≤ h ≤ 6 |
−11 ≤ h ≤ 11 |
| |
−10 ≤ k ≤ 7 |
−10 ≤ k ≤ 10 |
−10 ≤ h ≤ 10 |
−11 ≤ k ≤ 10 |
−11 ≤ k ≤ 10 |
−10 ≤ k ≤ 7 |
| |
−22 ≤ l ≤ 22 |
−22 ≤ l ≤ 22 |
−22 ≤ h ≤ 18 |
−24 ≤ l ≤ 24 |
−24 ≤ l ≤ 23 |
−24 ≤ l ≤ 24 |
| No. of reflections |
3350 |
3297 |
3316 |
2570 |
3366 |
3486 |
| No. of independent reflections |
653 |
654 |
655 |
833 |
834 |
835 |
| Rint (%) |
2.37 |
2.47 |
2.67 |
1.83 |
2.16 |
1.82 |
| R1 (%) |
1.17 |
1.61 |
1.71 |
1.22 |
1.59 |
1.47 |
| wR (%) |
2.81 |
3.50 |
3.49 |
2.89 |
3.83 |
3.35 |
| Goodness of Fit |
1.101 |
1.038 |
1.011 |
1.026 |
1.039 |
1.022 |
| Δρmax,Δρmin (eÅ−3) |
1.40/−1.04 |
1.67/−0.99 |
1.40/−1.15 |
0.98/−1.05 |
0.87/−0.99 |
0.65/−0.50 |
Table 3. Refined positional parameters of CaW
1−xMo
xO
4 solid solution (
x = 0.0-1.0)
| Sites |
Atoms |
Occupacy |
x |
y |
z |
| CaWO4 |
| A |
Ca |
1.00 |
0.0 |
0.25 |
0.625 |
| B |
W |
1.00 |
0.0 |
0.25 |
0.125 |
| O |
O |
1.00 |
0.1518(2) |
0.4916(2) |
0.21047(11) |
| |
| CaW0.78Mo0.22O4 |
| A |
Ca |
1.00 |
0.0 |
0.25 |
0.625 |
| B |
W
Mo |
0.779(7)
0.221 |
0.0 |
0.25 |
0.125 |
| O |
O |
1.00 |
0.1505(3) |
0.4918(3) |
0.21032(12) |
| |
| CaW0.66Mo0.34O4 |
| A |
Ca |
1.00 |
0.0 |
0.25 |
0.625 |
| B |
W
Mo |
0.660(6)
0.340 |
0.0 |
0.25 |
0.125 |
| O |
O |
1.00 |
0.1505(2) |
0.4921(3) |
0.21005(13) |
| |
| CaW0.51Mo0.49O4 |
| A |
Ca |
1.00 |
0.0 |
0.25 |
0.625 |
| B |
W
Mo |
0.513(4)
0.487 |
0.0 |
0.25 |
0.125 |
| O |
O |
1.00 |
0.15004(14) |
0.49262(13) |
0.21014(7) |
| |
| CaW0.21Mo0.79O4 |
| A |
Ca |
1.00 |
0.0 |
0.25 |
0.625 |
| B |
W
Mo |
0.215(2)
0.785 |
0.0 |
0.25 |
0.125 |
| O |
O |
1.00 |
0.14876(13) |
0.49316(13) |
0.20968(7) |
| |
| CaMoO4 |
| A |
Ca |
1.00 |
0.0 |
0.25 |
0.625 |
| B |
Mo |
1.00 |
0.0 |
0.25 |
0.125 |
| O |
O |
1.00 |
0.14806(10) |
0.49336(10) |
0.20940(5) |
Table 4. Refined mean square displacement parameters (× 10
−3 Å) in CaW
1−xMo
xO
4 solid solution (
x = 0.0-1.0)
| |
Atoms |
U11 |
U22 |
U33 |
U12 |
U13 |
U23 |
Uiso (103 Å2) |
| CaWO4 |
Ca |
7.75(12) |
7.75 |
6.55(16) |
0.00 |
0.00 |
0.00 |
7.35(8) |
| |
W |
5.30(4) |
5.30 |
7.50(5) |
0.00 |
0.00 |
0.00 |
6.03(4) |
| |
O |
9.6(5) |
9.4(5) |
9.4(4) |
−1.9(4) |
0.6(4) |
−1.9(4) |
9.48(18) |
| |
| CaW0.78Mo0.22O4 |
Ca |
7.94(17) |
7.94 |
7.5(2) |
0.00 |
0.00 |
0.00 |
7.79(13) |
| |
W, Mo |
5.70(5) |
5.70 |
8.04(6) |
0.00 |
0.00 |
0.00 |
6.48(4) |
| |
O |
11.5(5) |
9.8(5) |
10.6(5) |
−1.9(4) |
1.0(4) |
−2.1(4) |
10.6(3) |
| |
| CaW0.66Mo0.34O4 |
Ca |
8.23(16) |
8.23 |
7.6(2) |
0.00 |
0.00 |
0.00 |
8.02(13) |
| |
W, Mo |
5.61(5) |
5.61 |
8.44(7) |
0.00 |
0.00 |
0.00 |
6.55(5) |
| |
O |
11.0(5) |
10.4(5) |
11.5(5) |
−1.6(4) |
0.6(5) |
−1.9(5) |
11.0(3) |
| |
| CaW0.51Mo0.49O4 |
Ca |
7.81(9) |
7.81 |
7.41(11) |
0.00 |
0.00 |
0.00 |
7.68(7) |
| |
W, Mo |
5.32(3) |
5.32 |
7.80(4) |
0.00 |
0.00 |
0.00 |
6.14(3) |
| |
O |
9.6(2) |
10.1(2) |
10.5(2) |
−1.6(2) |
0.91(19) |
−2.28(19) |
10.08(12) |
| |
| CaW0.21Mo0.79O4 |
Ca |
7.96(9) |
7.96 |
7.55(12) |
0.00 |
0.00 |
0.00 |
7.82(7) |
| |
W, Mo |
5.71(4) |
5.71 |
7.88(5) |
0.00 |
0.00 |
0.00 |
6.43(3) |
| |
O |
10.0(2) |
10.7(2) |
11.0(2) |
−2.4(2) |
0.7(2) |
−1.48(19) |
10.59(12) |
| |
| CaMoO4 |
Ca |
8.31(5) |
8.31 |
7.90(8) |
0.00 |
0.00 |
0.00 |
8.17(4) |
| |
Mo |
6.11(3) |
6.11 |
8.13(5) |
0.00 |
0.00 |
0.00 |
6.78(3) |
| |
O |
10.43(18) |
10.52(17) |
10.99(18) |
−1.51(14) |
0.73(16) |
−2.41(16) |
10.65(8) |
Table 5. Bond distances and adjacent O-M-O angles in CaW
1−xMo
xO
4 sheelite-pauerite solid-solutions (
x = 0.0-1.0)
| |
CaWO4 |
CaW0.78Mo0.22O4 |
CaW0.66Mo0.34O4 |
CaW0.51Mo0.49O4 |
CaW0.21Mo0.79O4 |
CaMoO4 |
| MO4 tetrahedral |
| M-O × 4 (Å) |
1.7841(12) |
1.7804(14) |
1.7798(14) |
1.7808(7) |
1.7758(7) |
1.7732(5) |
| O-O (1) × 2 (Å) |
2.9918(15) |
2.985(3) |
2.986(3) |
2.9860(11) |
2.9800(10) |
2.9760(8) |
| O-O (2) × 4 (Å) |
2.8732(17) |
2.868(3) |
2.8663(19) |
2.8683(11) |
2.8590(11) |
2.8548(8) |
| O-B-O (wide) (°) |
113.97(9) |
113.89(9) |
114.00(9) |
113.94(5) |
114.08(5) |
114.10(4) |
| O-B-O (narrow) (°) |
107.27(8) |
107.31(10) |
107.25(4) |
107.29(2) |
107.22(3) |
107.208(18) |
| |
| CaO8 dodecahedral |
| Ca-Odistant × 4 (Å) |
2.4722(11) |
2.4755(14) |
2.4727(13) |
2.4722(7) |
2.4711(7) |
2.4713(5) |
| Ca-Ocloser × 4 (Å) |
2.4432(12) |
2.4423(14) |
2.4452(14) |
2.4421(7) |
2.4423(8) |
2.4449(6) |
| Odistant-Ca-Odistant (°) |
133.69(6) |
133.81(6) |
133.84(7) |
133.76(3) |
133.97(4) |
134.06(3) |
| Ocloser-Ca-Ocloser (°) |
125.90(4) |
126.08(4) |
126.23(4) |
126.32(2) |
126.62(2) |
126.818(17) |
The Debye temperature can be derived using the following equation (Willis and Pryor, 1975): <u2>d = (3ħ2T)/(mkBΘD2). The Debye temperature, ΘD, for each atom can be estimated using the dynamic component in Debye-Waller factor and the <u2>d/T slope based on the Debye approximation (Willis and Pryor, 1975). The ΘD is one of the indices as a physical quantity that can be compared among materials with different compositions, and it correlates with the melting temperature, formation temperature and physical properties, such as the thermal conductivity and the hardness of crystals. The Debye temperatures obtained from the Debye-Waller factor in diffraction, the neutron inelastic scattering, the elastic constant and the low temperature heat capacity usually show good agreements (Wood et al., 2002; Christensen et al., 2006; Nakatsuka et al., 2011; Nakatsuka et al., 2015; Yoshiasa et al., 2016; Tokuda et al., 2019; Yoshiasa et al., 2021). We estimated ΘD for each atom using the values of Ueq under assumption that the atoms have no static disorder components in end-member composition of CaWO4 and CaMoO4.
RESULTS AND DISCUSSION
Compositional change of unit cell parameters
Figure 1 shows the change in the unit cell parameters (a and c) and unit cell volumes for CaW1−xMoxO4 solid solutions with respect to the composition x. The overall trend was the same as that observed by Kitakaze et al. (2014). The c/a axial ratios [2.1691 (x = 0.0), 2.1719 (x = 0.2), 2.1764 (x = 0.3), 2.1784 (x = 0.5), 2.1828 (x = 0.8), and 2.1878 (x = 1.0)] increase with increasing Mo content. As the effective ionic radii of IVW6+ and IVMo6+ were 0.42 and 0.41 Å (Shannon, 1976), respectively, they were consistent with the decrease in the a-axis and the unit cell volume, with increasing Mo content. However, the elongation of the c-axis with increasing Mo content was unique, as shown in Figure 1. The changes in the crystal structure of the solid solution causing the c-axis expansion will be discussed later.

Figure 1. Compositional dependences of the unit cell parameters a and c and unit cell volume for the CaW1−xMoxO4 solid solutions.
The scheelite-type AMO4 structure consists of an eighth-coordinated A-site (Ca-site) and a tetrahedral M-site (Fig. 2). The Ca- and M-sites are located at the 4a and 4b Wyckoff positions in space group I41/a, respectively, and the atomic coordinates, x, y, and z have no degrees of freedom. Both sites are located on the four-fold roto-inversion axis, and the site symmetries are high. In contrast, only one type of O-site is in the general position, and three degrees of freedom of atomic coordinates. The atomic arrangements in scheelite-type structures are expressed by the unit cell parameters (a and c) and atomic coordinates (x, y, z) for one type of oxygen atom position. The polyhedral shapes of the cation sites in the structure are tuned mainly with the coordinates of the oxygen atoms.
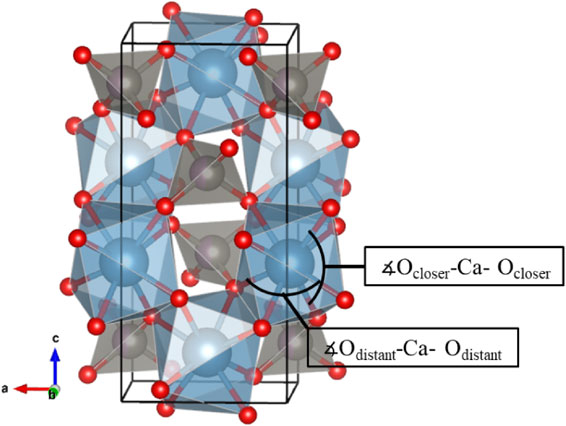
Figure 2. Crystal structure of scheelite-type CaW0.51Mo0.49O4 consists of eighth-coordinated A-site and tetrahedral M-site. The increase in the angles ∡Ocloser-Ca-Ocloser is related to the expansion of the c-axis.
Crystallographically, there is only one type of distance between cation and oxygen in the M-site. Figure 3 shows the compositional dependence of the M-O distances and the O-M-O angles in the solid solution. The M-O distances in the solid solutions decrease with Mo content. The wide-angle ∡wideO-M-O increases, and the narrow-angle ∡narrowO-M-O decreases with increasing Mo. The average value of these two angles hardly changes in the solid solutions (Table 5). The O-O distances in the solid solutions also decrease with increasing Mo content (Fig. 3). This change clearly reflects the size of the occupied ion due to the substitution of small Mo ions. The structural changes relating to the shortening of the a-axis was observed around the M-site. Unusual changes in the c-axis expansion with increasing Mo content cannot be explained by changes around the M-site.

Figure 3. Compositional dependences of M-O distances and O-O distances for tetrahedral M-site in CaW1−xMoxO4 solid solutions.
Figures 4 and 5 show the compositional dependence of the Ca-O distances and O-Ca-O angles in the eight-coordinated Ca-site. The Ca-Ocloser distances in the solid solutions increase, and the Ca-Odistant distances decrease with increasing Mo content. The angle ∡Ocloser-Ca-Ocloser increases with increasing Mo content. Both the increase in the Ca-Ocloser distances and the significant increase in the angles ∡Ocloser-Ca-Ocloser are directly related to the expansion of the c-axis (Fig. 2). The increment in the angle ∡Ocloser-Ca-Ocloser associated with the expansion of the c-axis is three times as large as that in the angle ∡Odistant-Ca-Odistant associated with the a-axis. The unique extension of the c-axis can be explained by the change in the Ca-site. The Ca-Ocloser distance extends, and the Ca-Odistant distance shortens; thus, the difference between them is reduced. Similarly, the small angle ∡Ocloser-Ca-Ocloser becomes large with increasing Mo content. As results, the polyhedral shape of Ca-site is changed to be more isotropic. The distortion around the Ca-site decreases as the Mo content increases in the solid solution.

Figure 4. Compositional dependence of Ca-O distances in the CaW1−xMoxO4 solid solutions.

Figure 5. Compositional dependences of Ocloser-Ca-Ocloser and Odistant-Ca-Odistant angles in Ca-site in CaW1−xMoxO4 solid solutions.
Figure 6 shows the fluorescence spectra of CaW1−xMoxO4 solid solutions measured with the 254.6 nm excitation. Distortion of the peak at approximately 500 nm appears from the characteristics of the measuring device. Strong light emission with a peak at 419 nm is observed in the CaWO4 scheelite end-member. The peak intensity significantly decreases and shifts its peak position to 451 nm with only 3% Mo substitution (CaW0.97Mo0.03O4). In the wide solid-solution region from CaW0.92Mo0.08O4 to CaMoO4, no significant change is observed in the emission characteristics, and the main peak positions are approximately 492 nm in the range of x = 0.08-1.0. The observation that the fluorescence characteristics of the solid solutions change significantly by replacing a small percent of Mo is consistent with previous reports (Shoji and Sasaki, 1978; Tyson et al., 1988; Nakamura et al., 2002). Near-ultraviolet light emission peaks are identified near 292 and 301 nm in CaWO4. The peaks also decrease in intensity nonlinearly with Mo substitution (Fig. 6). The intensities decreased with increasing Mo content, and the peak top positions were slightly shifted to the longer wavelength side until the composition for x = 0.3. The change is almost stopped in the region from x = 0.5 to x = 1.0. The changes of the peak height at 301 nm are more moderate than that of the main peak at 419 nm. The effects of Mo substitution are clearly different in these emission bands.

Figure 6. The fluorescence spectra of the CaW1−xMoxO4 solid-solutions measured with 254.6 nm excitation (left) and enlarged view of ultraviolet light-emission peaks near 300 nm (right).
The substitution of foreign elements causes abrupt and non-linear changes in the fluorescence characteristics (the decreases in peak intensities and shifts in peak positions near 292, 301, and 419 nm) only in the CaWO4-rich region. These emissions are material-specific, because the compositional dependence is strongly observed, especially in the region where the Mo content is low. A nearly linear and continuous structural change is observed in the solid-solution by the substitution of W by Mo, mainly reflecting differences in ionic radii. The continuous changes in atomic arrangement have little effect on the fluorescence characteristics. The nonlinear changes are presumed to be originated by some drastic effect of Mo ions on the electronic structure of W via oxide ions. This abrupt change occurs only in CaWO4 scheelite-rich solid solutions, and it is strange that the peaks at 292 and 301 nm above the composition for x = 0.5 and the peak at 419 nm above x = 0.08 have almost no change in the fluorescence characteristics. It seems that detailed analysis and observation of the electronic structure near the Fermi level of these solid solutions are necessary.
Debye-Waller factors and estimated Debye temperatures for CaWO4 and CaMoO4
The equivalent and anisotropic temperature factors (U: Debye-Waller factor, mean square displacement) for each atom in the solid solutions are shown in Table 4. The values of equivalent and anisotropic temperature factors in the structure increase in the order of M-, Ca- and O-sites. This order is preserved throughout the solid solutions. The Ueq values in Table 4 for the Ca and O atoms increase from 0.00735(8) and 0.00948(18) Å2 in CaWO4 to 0.00817(4) and 0.01065(8) Å2 in CaMoO4, respectively. Comparing the end-member compositions and the Debye-Waller factors, the Ca and O atoms are smaller in the W system scheelite than in the Mo system powellite.
The Debye temperature, ΘD, is an index of a physical quantity that can be compared among materials with different compositions. The Debye temperatures obtained from the Debye-Waller factor in diffraction, inelastic neutron scattering, elastic constant, and low temperature heat capacity usually show good agreement. The obtained ΘD for Ca, W, and O in CaWO4 scheelite are 381, 198, and 534 K, respectively. The values of 381, 198, and 534 K correspond to 33 meV (266 cm−1), 17 meV (137 cm−1), and 46 meV (371 cm−1), respectively. Obtained ΘD for Ca, Mo, and O in CaMoO4 powellite are 363 K (31 meV), 257 K (22 meV), and 503 K (43 meV), respectively. The phonon density of states estimated from lattice dynamics calculations (Senyshyn et al., 2004, 2006) coincides well with the observed ΘD values for CaWO4 and CaMoO4. The thermal characteristics of Ca and oxide ions in scheelite-type compounds are influenced by M-site cations. The ΘD value for the O-site is the highest (534 K in CaWO4 and 503 K in CaMoO4) in each crystal. The Debye temperature corresponds to the temperature at which all phonon modes are excited (Willis and Pryor, 1975). It has been confirmed for several compounds that the Debye temperature for the site with the highest value in the crystal corresponds to the bulk Debye temperature of the compound (Yoshiasa et al., 2016; Tokuda et al., 2019; Yoshiasa et al., 2021). The bulk Debye temperatures for scheelite-type compounds are depending on the highest ΘD values of oxide ions. The bulk Debye temperature for CaWO4 scheelite (534 K) was higher than that for CaMoO4 powellite (503 K). The Debye temperature ΘD is related to the melting temperature, formation temperature, thermal conductivity, atomic diffusion and hardness of materials. The hardness of scheelite and powellite are 4.5 and 3.5, respectively. The melting temperatures of scheelite and powellite are approximately 1650 and 1470 °C, respectively. Our observations are consistent with the tendencies of hardness and melting temperatures.
CONCLUSION
In this study, continuous crystal structure changes and drastic changes in fluorescence properties are observed in CaW1−xMoxO4 (x = 0.0-1.0) scheelite-powellite solid solutions. The substitution of small size Mo extends the c-axis in the solid solutions. This phenomenon is caused by widening the O-Ca-O angles and reducing the distortion of the Ca-site. Two near-ultraviolet light emission peaks can be identified near 300 nm. The fluorescence emission intensities drastically decrease with a slight substitution of Mo in CaWO4, and the peak top positions shift to the longer wavelength side. This is due to a slight change in the electronic state caused by replacing a small percentage of W with Mo. No significant change in fluorescence properties for the peaks near 500 nm is observed for the CaW1−xMoxO4 solid solutions with composition x = 0.08-1.0. The fluorescence emission is particularly sensitive to impurities near the CaWO4 scheelite end-member compositions.
REFERENCES
- Aleksandrov, V.B., Gorbatyii, L.V. and Ilyukhin, V.V. (1968) Crystal structure of powellite CaMoO4. Kristallografiya, 13, 512-513.
- Brugger, J., Gieré, R., Grobéty, B. and Uspensky, E. (1998) Scheelite-powellite and paraniite-(Y) from the Fe-Mn deposit at Fianel, Eastern Swiss Alps. American Mineralogist, 83, 1100-1110.
- Christensen, M., Lock, N., Overgaard, J. and Iversen, B.B. (2006) Crystal structures of thermoelectric n- and p-type Ba8Ga16Ge30 studied by single crystal, multi temperature, neutron diffraction, conventional X-ray diffraction and resonant synchrotron X-ray diffraction. Journal of American Chemical Society, 128, 15657-15665.
- Fernández-González, Á., Andara, Á. and Prieto, M. (2007) Mixing Properties and Crystallization Behaviour of the Scheelite-Powellite Solid Solution. Crystal Growth and Design, 7, 3, 545-552.
- Goldschmit, V.M. (1937) The principles of distribution of chemical elements in minerals and rocks. Journal of Chemical Soiety, 1937, 655-673.
- Hazen, R.M., Finger, L.W. and Mariathasan, J.W.E. (1985) High-pressure crystal chemistry of scheelite-type tungstates and molybdates. Journal of Physics and Chemistry of Solids, 46, 253-263.
- Kitakaze, A., Ito, H. and Komatsu, R. (2014) Study on the synthetic CaWO4-CaMoO4 series minerals. Faculty of Engineering, Yamaguchi University, Research Report, 64, 2, 43-45.
- Kletzin, A. and Adams, M.W.W. (1996) Tungsten in biology. FEMS Microbiology Reviews, 18, 5-64.
- Mikhailik, V.B., Kraus, H., Wahl, D., Itoh, M., et al (2004) One- and two-photon excited luminescence and band-gap assignment in CaWO4. Physical Review, B69, 205110.
- Mikhailik, V.B., Kraus, H., Miller, G., Mykhaylyk, M.S. and Wahl, D. (2005) Luminescence of CaWO4, CaMoO4, and ZnWO4 scintillating crystals under different excitations. Journal of Applied Physics. 97, 083523.
- Momma, K. and Izumi, F. (2011) VESTA 3 for three-dimensional visualization of crystal, volumetric and morphology data. Journal of Applied Crystallography, 44, 1272-1276.
- Nakamura, T., Sugiyama, K., Moriguchi, E. and Shoji, T. (2002) Synthesis of scheelite group minerals in the CaWO4-CaMoO4-PbMoO4-PbWO4 system from aqueous solutions at 100 °C. Shigen-to-Sozai, 118, 217-221.
- Nakatsuka, A., Shimokawa, M., Nakayama, N., Ohtaka, O., et al (2011) Static disorders of atoms and experimental determination of Debye temperature in pyrope: Low- and high-temperature single-crystal X-ray diffraction study. American Mineralogist, 96, 1593-1605.
- Nakatsuka, A., Kuribayashi, S., Nakayama, N., Fukui, H., et al (2015) Temperature dependence of crystal structure of CaGeO3 high-pressure perovskite phase and experimental determination of its Debye temperatures studied by low- and high-temperature single crystal X-ray diffraction. American Mineralogist, 100, 1190-1202.
- Orhan, A. (2017) Evolution of the Mo-rich scheelite skarn mineralization at Kozbudaklar, Western Anatolia, Turkey: Evidence from mineral chemistry and fluid inclusions. Ore Geology Reviews, 80, 141-165.
- Rigaku OD (2017) CrysAlis PRO. Rigaku Oxford Diffraction Ltd, Yarnton, Oxfordshire, England.
- Sato, K. (1980) Tungsten skarn deposit of the Fujigatani Mine, Southwest Japan. Economic Geology, 75, 1066-1082.
- Senyshyn, A., Kraus, H., Mikhailik, V.B., Vasylechko, L. and Knapp, M. (2006) Thermal properties of CaMoO4: Lattice dynamics and synchrotron powder diffraction studies. Physical Review, B73, 014104.
- Senyshyn, A., Kraus, H., Mikhailik, V.B. and Yakovyna, V. (2004) Lattice dynamics and thermal properties of CaWO4. Physical Review, B70, 214306.
- Shannon, R.D. (1976) Revised effective ionic radii and systematic studies of interatomic distances in halides and chalcogenides. Acta Crystalloghaphy, A32, 751-767.
- Sheldrick, G.M. (2015) SHELXT -Intergrated space-group and crystal structure determination. Acta Crystallogaphy, A71, 3-8.
- Shoji, T. and Sasaki, N. (1978) Fluorescent Color and X-ray Powder Data of Synthesized Scheelite-Powellite Series as Guides to Determine its Composition. Minning Geology, 28, 397-404.
- Tokuda, M., Yoshiasa, A., Mashimo, T., Arima, H., et al (2019) Crystal structure refinement of MnTe2, MnSe2, and MnS2: cation-anion and anion-anion bonding distances in pyrite-type structures. Zeitschrift für Kristallographie -Crystalline Materials, 234, 371-377.
- Tyson, R.M., Hemphill, W.R. and Theisen, A.F. (1988) Effect of the W:Mo ratio on the shift of excitation and emission spectra in the scheelite-powellite series. American Mineralogist, 73, 1145-1154.
- Williams, R.J.P. (2011) Chemical advances in evolution by and changes in use of space during time. Journal of Theoretical Biology, 268, 146-159.
- Willis, B.T.M. and Pryor, A.W. (1975) Thermal Vibrations in Crystallography, Cambridge University Press.
- Wilson, A.J.C. (1992) Editor. International Table for Crystallography, Vol. C. Dordrecht: Kluwer Academic Publisher.
- Wood, I.G., Knight, K.S., Price, G.D. and Stuart, J.A. (2002) Thermal expansion and atomic displacement parameters of cubic KMgF3 perovskite determined by high-resolution neutron powder diffraction. Journal of Applied Crystallography, 35, 291-295.
- Yoshiasa, A., Tokuda, M., Kitahara, G., Unoki, K., et al (2021) Crystal synthesis and Debye temperature determination of PdSb2: usefulness of single crystal precise structure analysis. Journal of Crystal Growth, 574, 126327.
- Yoshiasa, A., Nakatani, T., Nakastuka, A., Okube, M., et al (2016) High temperature single-crystal X-ray diffraction study of tetragonal and cubic perovskite-type PbTiO3 phases. Acta Crystallography, B72, 381-388.
