Abstract
The frequency characteristics of acoustic emission (AE) during triaxial compression of thermally cracked and unheated (‘fresh’) granite samples were investigated with the aim of understanding the influence of pre-existing cracks on precursor information regarding macroscopic failure. The peak frequency during the damage process was the same for thermally cracked and fresh granites. Analysis of AE signals showed that signals with low peak frequency appeared before failure of the sample, implying the initiation of macrocracks with progressive growth of cracks. The peak amplitude of the frequency spectrum recorded in the thermally cracked samples was much lower than that in the fresh samples. This result suggests two reasons for the difference in peak amplitude: reduction in shear modulus and the attenuation filtering phenomenon caused by thermal cracks (i.e., the differences in overall bulk properties). In particular, the maximum value of peak amplitude in the low-frequency band for the thermally cracked samples was smaller than that for fresh samples. This characteristic can be related to the properties of source of AE signals, such as the stress drop and crack size. Assuming that pre-existing thermal cracks grow during the pre-failure stage, the events with low peak frequency and low peak amplitude in the heat-treated samples are interpreted as exhibiting a low stress drop for individual events. Therefore, although AE signals with low frequency can be considered as precursors to rock failure, cracking behavior suggested by events with low frequency depends on the initial damage condition of the rock sample.
INTRODUCTION
The physical and mechanical properties of rocks, which are influenced by cracks of varying size, are crucial for understanding the mechanism of hydraulic fracturing and induced seismicity related to many applied engineering fields, such as enhanced geothermal systems (EGSs), shale gas hydraulic fracturing, and disposal of wastewater from resource extraction (Fournier, 1996; Rothert and Shapiro, 2007). To analyze the influence of cracks on rock physical and mechanical properties, it is necessary to perform laboratory experiments on rocks with pre-existing cracks. In addition, it is also important to investigate the fracturing process starting from the occurrence of new cracks or propagation of pre-existing cracks through to fault formation. The effect of pre-existing cracks on rock physical and mechanical properties has been examined through laboratory experiments on thermally cracked samples. When a rock sample is heat treated, differential thermal expansions of adjacent grains lead to an occurrence of intergranular compressive and tensile forces, which cause existing cracks to grow and create new cracks. For example, Sun et al. (2015) performed uniaxial compression tests with granite specimens heated to 800 °C and showed that peak stress decreased as heating temperature increased. Wang et al. (2013) conducted hydrostatic tests at an effective pressure of up to 90 MPa and then carried out triaxial deformation tests at an effective pressure of 30 MPa with granite samples heat-treated at 700 °C. Those authors reported that, although dilatancy in the heat-treated samples started at lower differential stress compared with the non-heated samples, the thermal cracks had no influence on rock strength. From the observation that elastic wave anisotropy appeared at an early stage of triaxial deformation of the thermally cracked samples, the apparent insensitivity of rock strength to thermal cracks was interpreted as being due to stress shielding induced by aligned crack distributions. Effective elastic properties of a rock are influenced by the stress interaction between cracks as well as individual cracks. The stress interaction depends on the spatial arrangement of cracks. For the case of stacked cracks, the stress interaction can become less effective, which tends to stiffen rocks (Grechka and Kachanov, 2006). This crack interaction by stacked cracks is called stress shielding effect. Moreover, microstructural analysis revealed the existence of long cracks in both non-heated and heat-treated samples, which was interpreted in terms of the more effective control of rock strength by such pre-existing cracks compared with thermal cracks, which are shorter. Therefore, it would appear that measuring the effect of pre-existing cracks is essential for estimating deformation process of rocks.
In elastic rocks, the creation of new cracks and growth of pre-existing cracks cause dynamic energy release, which propagates in the form of an elastic wave and is termed ‘acoustic emission’ (AE). AE monitoring is an effective approach for understanding the fracturing process in rocks (e.g., Lei and Ma, 2014). At the laboratory scale, deformation processes have been inferred from the AE event rate and the spatial distribution of AE hypocenters (e.g., Scholz, 1968; Lockner et al., 1991; Lei et al., 2000; Zang et al., 2000; Thompson et al., 2005). AE parameters such as frequency and amplitude are related to the length of developed cracks and have been used to interpret precursor information regarding macroscopic failure. Wang et al. (2019) studied the spectral characteristics and distribution of the energy ratio of the AE signals band acquired by fast Fourier transform (FFT) and wavelet packet transform (WPT), and showed that the low-frequency band of the AE signal represented the formation of macrocracks. Chen et al. (2020) investigated the relationship between AE frequency spectrum characteristics and cracking behaviors using high-speed camera images. Their results revealed that the signal with high peak amplitude in low-frequency bands can be used as precursor information regarding macroscopic failure.
Differences in AE characteristics between heat-treated and fresh samples have been explored in previous experimental studies. For example, Kong et al. (2018) monitored AEs during uniaxial compression tests on fresh and heat-treated sandstones. They found that AE count rates showed a greater increase in heat-treated samples than in fresh samples. In fresh samples, this increase was only significant during the latter loading stage, whereas the heat-treated samples produced many AEs during the initial loading stage and showed a more obvious increase in AEs during the latter loading. Feng et al. (2021) conducted similar uniaxial compression tests on coarse marble specimens that had been thermally treated. They reported that AE were emitted earlier, and for a longer duration, in samples that had been subjected to higher temperatures or more heat treatments. Wang et al. (2013) demonstrated that AEs only started in the latter loading stage during triaxial compression of granodiorite, and through monitoring of AE hypocenters showed that no loading stage is characterized by a homogeneous spatial distribution of AEs in heat-treated samples. They suggested this is because the residual thermal stresses associated with crystallization and cooling of the rock were released by the initial heat treatment, resulting in smaller initial stress heterogeneities in heat-treated samples than in fresh samples.
These previous studies have focused on the effects of pre-existing cracks (e.g., thermal cracks) on the cracking process by comparison of AE characteristics such as initiation time, counts, duration, and spatiotemporal distribution during each loading stage, in heat-treated and fresh samples. However, there has been little consideration of the effects of pre-existing cracks on AE spectrum characteristics such as frequency and amplitude, which could provide information on crack length and therefore crack propagation during the pre-failure stage. This may be because cracks are the main source of elastic wave attenuation at low temperatures and pressures (e.g., O’Connell and Budiansky, 1977), so the spectral characteristics of an AE event that occurs in a rock with pre-existing cracks tends to be obscured. Previous studies have revealed that the number of AEs with high amplitudes in low frequency bands increases at the pre-failure stage, but have not determined if the frequency and amplitude of an AE signal reflects, for example, original crack length before growth or the amount of crack growth, or some other parameter of crack length. Determining the relationship between AE spectral characteristics and crack length parameters, such as original crack length before growth or the amount of crack growth, would enable AE characteristics to be used to explore pre-failure damage. The present study aimed to confirm the influence of pre-existing cracks, with special focuses on a comparison between thermally treated and unheated granite samples, on the pre-failure damaging features interpreted by AE frequency spectrum characteristics and cracking activity. We measured AE signals during triaxial compression of both thermally cracked and unheated granite samples under conditions of constant confining pressure and temperature. To avoid the effect of attenuation as much as possible, we used the waveform that was detected by the PZT with a small incidence angle and short distance from the hypocenter. Then, AE frequency spectra were extracted from each signal. The effect of pre-existing cracks on precursor information regarding macroscopic failure was ascertained by comparing differences in precursory features between thermally cracked and non-heated samples. By elucidating the effect of pre-existing cracks on pre-failure damages, it is expected to advanced information that contributes to the rock strength and fracturing behaviors.
METHOD
Samples
For this study, we used five samples of Inada granite from Ibaraki, Japan, which is typically composed of 36 vol% quartz, 32 vol% plagioclase, 28 vol% alkali-feldspar, and 4 vol% biotite, with an average grain size of 2-4 mm (Lin, 2002). Inada granite is structurally anisotropic as a result of its partially oriented arrangement of mineral particles and pre-existing microcracks, and the anisotropy of its compressive strength is approximately 10% (Lin et al., 2003). All samples used in our experiments were shaped into cylinders of 50 mm diameter and 125 mm length and were cored perpendicular to the plane that had the highest crack density so as to reduce the effect of anisotropy on the deformation process. P-wave velocity was measured in the directions parallel (Vaxial) and perpendicular (Vlateral) to the axis of the sample. Vlateral(MAX) and Vlateral(MIN) were determined as the maximum and minimum values of P-wave velocity measured in three directions every 60° at the mid-point of the sample length, respectively. The velocity difference Vlateral(MAX)−Vaxial was 0.263-0.693 km/s at room conditions.
Three Inada granite samples (IG1, IG2, and IG3) were heated in an oven at room pressure, up to 550 °C, at an average rate of 52 °C/min, after which the temperature was kept constant at 550 °C for 45 min, and finally cooled slowly overnight in the turned-off oven. Cracking occurred in the samples as a result of thermal stressing due to the differing thermal expansion of neighboring grains. In this paper, we refer to heat-treated samples as ‘IGh’ and fresh samples as ‘IGf’. Thin sections were made from parts of both types of samples that were cut off the bases of milled cylinders to adjust the sample lengths. Backscattered electron (BSE) images were obtained from the central areas of these thin sections by scanning electron microscope (SEM). Microscopic observations show that the heating treatment led to the formation of wide cracks ranged to 10 µm (Fig. 1). The effect of heat treatment on crack density was quantified by stereological measurements of SEM images (31 mm × 23 mm) of fresh and thermally cracked samples, following the methodology of Underwood (1970). The number of crack intersections per unit length was measured along six transects, three parallel to the long sides of the images and three parallel to the short sides; the average of all transects was taken as the crack density. The fresh sample has a crack density of 1.92 ± 0.25 mm−1 and the thermally cracked sample has a crack density of 4.21 ± 0.29 mm−1, indicating that heat treatment at 550 °C increases crack density by a factor of 2 or more. The initial porosities φ of the fresh and thermally cracked samples were 0.41%-0.46% and 1.59%-1.81%, respectively (Table 1). Porosity was determined by ϕ = (Wwet − Wdry)/ρwaterVbulk, where Wwet and Wdry are the water-saturated and dry weights of the sample, respectively, ρwater is the density of water, and Vbulk is the bulk volume of the sample, which can be determined by the cross-sectional area and length of the sample. The absolute error on porosity measurements for our samples is about 0.01%, based on the uncertainty of the size and weight values.
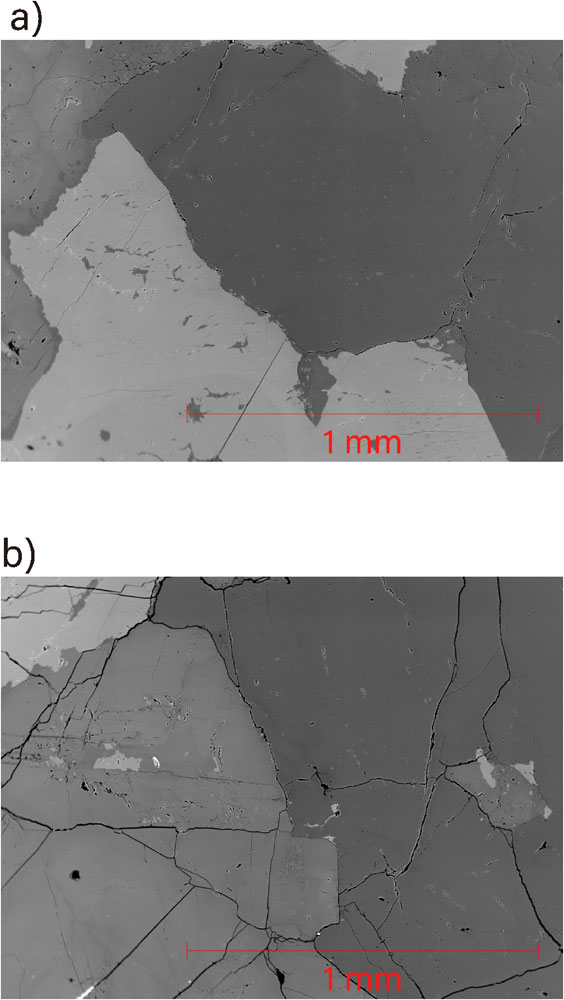
Figure 1. Back-scattered electron images of (a) fresh and (b) heat-treated Inada granite samples before triaxial deformation.
Table 1. Sample properties
| No. |
Sample |
Density, g/cm3 |
Porosity, % |
Vaxial, km/s |
Vlateral(MAX), km/s |
Vlateral(MIN), km/s |
| IGh1 |
Thermally cracked |
2.60 |
1.60 |
1.79 |
2.44 |
2.19 |
| IGh2 |
Thermally cracked |
2.60 |
1.59 |
1.65 |
2.35 |
2.27 |
| IGh3 |
Thermally cracked |
2.60 |
1.74 |
1.70 |
2.37 |
2.09 |
| IGf4 |
Fresh |
2.63 |
0.41 |
4.46 |
4.72 |
4.64 |
| IGf5 |
Fresh |
2.63 |
0.46 |
4.38 |
4.72 |
4.71 |
Experimental setup
Triaxial compression tests were conducted using the loading system at the Geological Survey of Japan, National Institute of Advanced Industrial Science and Technology, Ibaraki, Japan (Fig. 2a) (Lei, 2006). The loading system was renewed recently, allowing the axial piston to be advanced at a constant stress/strain rate using a servo-controlled system. During the experiments, the confining and pore pressures were controlled individually by syringe pumps. Axial (εa) and radial (εr) strains were measured with six cross-type strain gauges attached directly to the samples (Fig. 2b). Twenty-eight piezoelectric transducers (PZTs) with resonance frequencies of 0.25, 0.5, 1, and 2 MHz were mounted on the sample surface for monitoring of AE and measurement of velocity (Table 2). After all of the strain gauges and PZTs had been glued onto the samples, the specimens were jacketed with silicone sealant (about 5 mm in thickness) to prevent interaction with the confining oil. All experiments were performed at a constant displacement rate of 0.01 mm/min (corresponding to a strain rate of ∼ 1.33 × 10⁻⁶ s−1) and a constant confining pressure of 24.5 MPa. For wet experiments, distilled water was used as pore fluid and injected into the upstream of the sample at a constant pore pressure of 4 MPa. The downstream of the sample was released to atmospheric pressure. There are two main types of AE sensors: broadband sensors record an AE signal corresponding to the original waveform, while resonance sensors have a measurement sensitivity that is 10 dB higher than that of broadband sensors on average (Ishida et al., 2017). The heat-treated samples used in this study contain many pre-existing cracks, so the AE signal is expected to be attenuated. Thus, it is best to record AEs using PZTs that are highly sensitive to both low and high resonant frequencies, then perform frequency analysis on PZT recordings with a resonant frequency that is dissimilar to the dominant frequency of AEs.

Figure 2. (a) Schematic diagram of the loading system at the Geological Survey of Japan, National Institute of Advanced Industrial Science and Technology. (b) Distributions of PZTs and strain gauges. Solid black circles indicate transducers with 1 or 2 MHz resonant frequency for samples IGh2, IGh3, IGf4, and IGf5. White-filled circles indicate transducers with 0.5 or 0.25 MHz resonant frequency for samples IGh2, IGh3, IGf4, and IGf5. In the experiments for IGh1, the solid black and white-filled circles indicate transducers with 1 MHz resonant frequency.
Table 2. Summary of experimental results
| No. |
Sample |
Resonant frequency of PZT |
C, MPa |
C’, MPa |
C’/C, % |
Ccd, MPa |
Ccd/C, % |
| IGh1 |
Thermally cracked |
1 MHz |
413 |
120 |
27.1 |
208 |
50.4 |
| IGh2 |
Thermally cracked |
1/0.5 MHz |
357 |
103 |
28.9 |
185 |
51.8 |
| IGh3 |
Thermally cracked |
2/0.25 MHz |
397 |
130 |
32.7 |
249 |
62.6 |
| IGf4 |
Fresh |
1/0.5 MHz |
432 |
129 |
29.8 |
251 |
58.2 |
| IGf5 |
Fresh |
2/0.25 MHz |
446 |
164 |
36.7 |
306 |
68.5 |
C, maximum differential stress; C’, stress at onset of dilatancy; Ccd, crack damage stress.
All experiments were performed under wet condition.
A total of five samples were tested. We deformed three heat-treated samples (IGh1, IGh2, and IGh3) and two unheated samples (IGf4 and IGf5). In this study, we focused on results for two samples: IGh3 and IGf5. Samples IGh3 and IGf5 were selected to investigate the frequency characteristics of AE signals because a relatively wide range of dominant frequency bands can be measured using PZTs with resonant frequencies of 2 and 0.25 MHz mounted on the two samples. Samples IGh1, IGh2, and IGf4 were chosen for checking differences in frequency analysis results depending on the resonant frequency of PZTs.
Data processing
In the experiments, volumetric strain (εv) was calculated from εa and εr using εv = εa + 2εr. All strain values were averaged from six strain gauges. During the initial stages of deformation, volumetric strain increases linearly with applied differential stress. The result for triaxial compression testing of thermally cracked Inada granites (IGh1) show that the samples underwent the pre-existing crack closure stage at ∼ 15% of the peak stress. Therefore, the volumetric strain curve between 15% and 25% of the peak stress is presumed to be a linear region (i.e., one characterized by a linear relationship). In this study, the stress at which volumetric strain deviates from the linear region is defined as the onset of dilatancy. At high differential stress, unstable crack growth, which is termed ‘crack damage stress’, starts at a stress level between 70% and 85% of the peak stress, and this point corresponds to the maximum volumetric strain in the strain curve (Bieniawski, 1967; Martin and Chandler, 1994). In this study, the differential stress at the maximum volumetric strain is defined as crack damage stress.
AE events were recorded automatically by a fast waveform recording system, as described by Lei (2006). The signals detected from every PZT were pre-amplified by 40 dB and then fed into the waveform system. We digitized the AE signals with a sampling rate of 25 MHz and a sample length of 4096 words (∼ 160 µs). AE waveform data were acquired by the following triggering logic. First, four transducers were selected as triggering sensors (p10, 13, 21, and 24 in sample IGh1-2 and p9, 10, 23, and 24 in samples IGh3, IGf4, and IGf5, where the denotation ‘pXX’ corresponds to the number in the PZT location diagram as shown in Fig. 2b). These transducers were distributed homogeneously on the specimen surface to avoid deviation of triggering. An OR logic (triggering when at least one of selected inputs overshoots the threshold level) was used within the four transducers, which enabled us to record AE waveforms when any one of the transducers detected a signal exceeding the pre-defined threshold level (50 mV in this study). Triggered AE events were recorded using single-event mode, in which the waveform data were immediately transferred to the hard disk of the host PC and for which approximately two events per second can be recorded during the entire loading process. In the experiment involving sample IGf5, after the AE event rate increased, the system was switched to multi-event mode, in which approximately 5000 events per second can be recorded in the on-board memory. Thus, the number of AE events recorded for IGf5 was not comparable with other experiments. To investigate the relationship between cracking behavior and AE peak frequency, the frequency spectrum was obtained using FFT, as follows:
| \begin{equation}
A(f) = \int_{-\infty}^{\infty}A(t)e^{-i2\pi ft}dt
\end{equation}
| (1), |
where
A(
t) is the original AE waveform,
A(
f) is the frequency spectrum,
f is the frequency component of the signal, and
t is the acquisition time of
A(
t).
Figure 3 shows an example of the analysis of the waveform with the largest amplitude recorded by the PZT with resonance frequency of 2 MHz in IGh3. Using
Equation (1), we utilized the original AE waveform (
Fig. 3a) to obtain the frequency spectrum (
Fig. 3b). The examples of the analysis of the AE waveforms with middle and smallest amplitudes recorded by the PZT with resonance frequency of 2 MHz in IGh3 are shown in Supplementary Figures S1 and S2 (Figs. S1 and S2 are available online from
https://doi.org/10.2465/jmps.221014). In the frequency spectrum, the peak amplitude is the largest amplitude in the spectrum, and the peak frequency is the point at the peak amplitude (
Fig. 3b). The signal-to-noise ratio (SN ratio) of AEs was calculated as the ratio of signal amplitude to noise amplitude. These amplitudes were calculated as the average amplitudes over the interval from 2 µs before to 2 µs after the P-wave arrival time as determined from an autoregressive (AR) model and Akaike information criterion (AIC) (
Lei, 2017). Only AE waveforms with SN ratios of 2.5 or higher were considered for analyses of spectral density. The transducer that recorded the most events was selected, and then the frequency spectrum characteristics were extracted from the signals recorded by the selected transducers. In the experiment involving sample IGh2, sensors p10 and p13 were chosen as the typical transducers with resonant frequencies of 1 and 0.5 MHz, respectively, and in the experiment involving IGh3, sensors p23 and p9 were selected as the representative instruments, with resonant frequencies of 2 and 0.25 MHz, respectively. In the case of fresh samples IGf4 and IGf5, p10 and p9 were used for frequency analysis as the typical sensors, with resonant frequencies of 1 or 2 MHz and 0.5 or 0.25 MHz, respectively. In addition, we selected the transducer close to a region where AE events are densely distributed (p3) and obtained the reanalyzed peak frequency from the signal detected by the selected transducer (detailed in section ‘Dominant frequency’).

Figure 3. (a) Original AE waveform with maximum amplitude recorded 14540 seconds after the start of loading by the PZT with a 2 MHz resonant frequency in IGh3, (b) frequency spectrum calculated from the original AE waveform by FFT, and (c) normalized frequency spectrum fitted by the autoregressive (AR) model.
In addition to the peak frequency, we also estimated the corner frequency of the AE events. In a homogeneous and isotropic infinite medium under a uniform stress, it was concluded that the spectrum of the elastic displacement obtained by the sliding of a circular crack was flat at low frequencies and decreases proportionally to f−2 at high frequencies (Aki, 1967; Sato and Hirasawa, 1973). The high- and low-frequency trends intersect at the so-called corner frequency, which is the key parameter used for estimating fault size and stress drop in seismology. Lei et al. (2003) had verified that the PZT response appears to be intermediate between velocity and acceleration waveform, but closer to velocity. Then, we assume AE record by PZT is close to the velocity waveform. The AE spectrum calibrated by the average values of the difference between the power spectral densities of PZT and laser Doppler vibrometer (LDV) records is not flat and is roughly proportional to f2 in the low-frequency domain (Lei et al., 2003). However, as the frequency response of PZTs was not calibrated using LDV in our experiments, it is difficult to consider the intersection between the fitting lines of f2 and f−2 as the corner frequency. In this study, the frequency of the point marking the largest amplitude in the spectrum fitted by an autoregressive (AR) model (Akaike, 1998) was obtained as the corner frequency (Fig. 3c) and averaged over all sensors. The duration of the signal used for the spectral analysis was 20 µs from 5 µs before the first motion. The spectral analysis was performed on waveforms recorded by all PZTs, and the median value was extracted as the typical corner frequency at each event.
EXPERIMENTAL RESULTS
Mechanical data and AE event rate
The maximum differential stress of thermally cracked granite under wet conditions ranged from 357 to 413 MPa, whereas that of fresh granite under wet conditions ranged from 432 to 446 MPa (Table 2). After reaching peak stress, brittle fracture occurred rapidly in all of the experiments. Results for the thermally cracked samples indicate that dilatancy began at 27.1%-32.7% of the peak stress and that crack damage stress started at 50.4%-62.6% (Figs. 4a-4c). For the fresh samples, dilatancy began at 29.8%-36.7% and crack damage stress started at 58.2%-68.5% of the peak stress (Figs. 4d and 4e). Systematic trends between the thermally cracked and fresh samples in strain behavior were not observed. Figures 4f-4j shows differential stress and AE events rate obtained from the waveform recording system as functions of elapsed time. AE data obtained from the wet samples show that cracking activity was initiated at a stress level of ∼ 85% of the peak stress in the sample using PZTs with a resonant frequency of 1 MHz (IGh1) (Fig. 4f). In contrast, the AE event rate began to increase at around the crack damage stress in the sample using PZTs with resonant frequencies of 1 and 0.5 MHz (Fig. 4g; IGh2). A similar behavior was observed for the sample using PZTs with resonant frequencies of 2 and 0.25 MHz (IGh3). From the above results, even in the experiments under wet conditions, it was possible to record a small amount of AE at the point of crack damage stress by adding PZTs with low-frequency bands (0.5 or 0.25 MHz). AE events in the fresh sample were successfully obtained by using PZTs with resonant frequencies of 1 and 0.5 MHz (Fig. 4i). During loading, the thermally cracked sample (IGh3) exhibited a broad AE distribution with a maximum at 250 MPa differential stress (Fig. 4h), whereas the fresh sample (IGf5) exhibited a very narrow AE distribution close to the maximum differential stress (Fig. 4j). After the differential stress reached ∼ 50% of the expected peak stress in IGf5, the system was switched to multi-mode, meaning that the AE events rate increased rapidly from ∼ 4 minutes before failure (Fig. 4j). In this paper, the number of AE counts in experiment IGf5 is not used for comparison that in the other experiments.

Figure 4. Strain (a)-(e) and differential stress and AE event rate (f)-(j) as functions of time for the thermally cracked and fresh samples. εa, εr, and εv represent the axial strain, radial strain and volumetric strain. The denotations ‘TC’ indicates the ‘thermally cracked’ sample.
The peak frequency of each AE event as a function of time for thermally cracked granites is shown in Figure 5. In all experiments, the peak frequency was distributed mainly in the range of 0-0.6 MHz. High-peak-frequency AE signals ranging from 0.6 to 2 MHz were detected only by PZTs with a high resonant frequency of 2 MHz. Focusing on the range of 0-0.6 MHz, the AE signals can be divided into two peak frequency bands. The peak frequency bands in IGh2 were distributed in similar bands: a low-frequency band of 0.1-0.25 and a high-frequency band of 0.25-0.45 MHz for the PZTs with resonant frequencies of 0.5 and 1 MHz (Figs. 5a and 5b). Results for PZTs with resonant frequencies of 0.5 and 1 MHz reveal that events with intermediate peak frequency of 0.2-0.3 MHz increased with increasing differential stress. In contrast, AE events recorded by the PZT with a resonant frequency of 0.25 MHz in IGh3 were divided into different bands: a low-frequency band of 0.05-0.15 and a high-frequency band of 0.2-0.3 MHz in the PZT with a resonant frequency of 0.25 MHz (Fig. 5c). As shown in Figure 5d, AE signals with lower frequencies were measured by the PZT with a resonant frequency of 2 MHz as differential stress was increased. The peak frequency of AE events in the fresh granites shows a similar distribution to that of events in the thermally cracked granites (Fig. 6). Signals with the resonant frequency of the PZT and its integer multiple frequencies are likely to be reflected in the frequency spectrum, and the frequency response of PZT sensors is not flat. Thus, the frequency bands of the peak frequency that resulted from the response of PZTs to harmonic waves are included in the AE signals. We compared the power spectral density (PSD) in laser Doppler vibrometer and PZT records as reported by Lei et al. (2003) to correct the AE spectra (Figs. 5e and 6e). This comparison demonstrates that PZT sensors with 2 MHz resonant frequency record lower amplitudes in the range 0.3 to 0.5 MHz. Nevertheless, we were able to sample many AEs in the 0.4-0.5 MHz frequency range (Figs. 5d and 6d). Thus, it is probable that the appearance of the events with lower frequencies recorded by the PZT with 2 MHz resonant frequency indicates the frequency characteristics that are independent of the resonant frequency of the PZT. The frequency characteristics recorded by PZTs with a 2 MHz resonant frequency are discussed in detail in the section DISCUSSION.

To clarify the relationship between the dominant frequency and cracking behavior, the peak frequency for PZTs with a resonant frequency of 2 MHz was compared with the corner frequency. After identifying a region where AE events are densely distributed (the center of the sample in this study) and a transducer with a small incidence angle and short distance from the region (Figs. 7a and 7b), we analyzed the waveform that was radiated from the region and recorded by the transducer. The peak frequency extracted by this process was designated as the ‘reanalyzed peak frequency’. Figures 7c and 7d show the reanalyzed peak frequency and corner frequency as functions of time for both thermally cracked and fresh samples. The reanalyzed peak frequency was 0.4-0.5 MHz in the middle stage of loading and ranged from 0.1 to 0.5 MHz at the time close to failure. The tendency for the number of AE events dominated by low-frequency components to increase with loading can be observed from the results for corner frequency. The magnitude of the dominant frequency of AE is related to the source dimension (crack size). According to Sato and Hirasawa (1973), by assuming that the AE signal is radiated from the circular crack that grows at a constant velocity, the source dimension L can be expressed by the corner frequency of a P-wave, f0(P), as
| \begin{equation}
L = \frac{C_{p}V_{p}}{2\pi f_{0}(P)}
\end{equation}
| (2), |
where
Cp is an implicit function of the rupture velocity as presented in
Sato and Hirasawa (1973) and
Vp is the P-wave velocity. The relationship expressed in
Equation (2) indicates that the source dimension is inversely proportional to the corner frequency.
Lei et al. (2003) reported that a corner frequency of 0.1 MHz corresponds roughly to a source dimension of 10-15 mm when the rupture velocity is 0.9 times the S-wave velocity,
Vs. As the corner frequency and reanalyzed peak frequency obtained in the present study have the same tendency during loading, it is considered that the increase in the number of AE events with low peak frequency with increasing differential stress represents the formation of macrocracks.
DISCUSSION
Interpretation of AE frequency spectrum characteristics
The peak amplitude distribution corresponding to the reanalyzed peak frequency is shown in Figure 8. The AE signals plotted in Figure 8 were all detected by the PZTs with a resonant frequency of 2 MHz. For the thermally cracked and fresh samples, the dominant frequency of AE signals ranges from 0.1 to 0.5 MHz, with the peak amplitude of AE signals having a different range depending on the initial level of damage of the sample. According to Ottemöller and Havskov (2003), the spectral amplitude A(f) is defined as:
| \begin{equation}
A(f) = S(f)D(f)G(R)
\end{equation}
| (3), |
where
S(
f) is the source term,
D(
f) is the diminution function,
G(
R) is the geometrical spreading, and
R is the hypocentral distance. The source term for a
ω2 model can be given by (
Aki, 1967;
Brune, 1970):
| \begin{equation}
S(f) = \frac{M_{0}}{4\pi k\rho V^{3}}\left[ 1 + \frac{f^{2}}{f_{c}^{2}} \right]^{-1}
\end{equation}
| (4), |
where
M0 is the seismic moment,
k = 0.83 is the factor for a free surface correlation,
ρ is the density,
V is the P- or S-wave velocity, and
fc is the corner frequency. This relationship indicates that the source term
S(
f) depends on the seismic moment,
M0, defined as:
| \begin{equation}
M_{0} = \mu \bar{D}S
\end{equation}
| (5), |
where
μ is the static shear modulus,
D is the average slip displacement, and
S is the fault area. By assuming that the peak amplitude obtained in the present study corresponds roughly to the spectral amplitude
A(
f) defined by
Equation (3), the peak amplitude is controlled by the seismic moment
M0. In addition, as there is no significant difference in the source dimensions of the thermally cracked and fresh samples based on the results of the reanalyzed peak frequency, the seismic moment of the AE event is dependent on the shear modulus.

Figure 8. Plots of peak amplitude versus reanalyzed peak frequency for (a) thermally cracked (IGh3) and (b) fresh (IGf5) samples. The dashed line indicates an auxiliary line representing the variation in the maximum peak amplitudes. The denotation ‘TC’ indicates the ‘thermally cracked’ sample.
The thermally cracked sample shows a peak amplitude clearly lower than that of the fresh sample. The shear modulus μ was estimated from Young’s modulus E and Poisson’s ratio ν calculated from the linear elastic parts of the axial and radial strain curves as follows:
| \begin{equation}
\mu = E/2(1 + \nu)
\end{equation}
| (6). |
The thermally cracked and fresh samples have shear modulus values of 10.4-13.3 and 14.1-15.1 GPa, respectively, indicating that the heat treatment reduced the shear modulus
μ and thus resulted in lower
M0. However, it is important to note that the attenuation of wave amplitude depends strongly on the density of cracks. For example,
Chaki et al. (2008) studied the influence of thermal damage on ultrasonic wave propagation in granitic rocks and reported that attenuation was positively correlated with induced thermal damage. Furthermore, cracks nucleated at higher differential stresses in the fresh sample (IGf5) (
Fig. 4j), which may explain why the associated AEs have larger peak amplitudes. In summary, there are three possible explanations for the differences in peak amplitude between thermally cracked and fresh samples: (i) reduction in shear modulus, (ii) attenuation and filtering phenomena caused by thermal cracks, and (iii) crack nucleation at higher differential stresses in fresh samples.
As shown in Figure 8, there is a trend that the maximum peak amplitude increases with increasing peak frequency for the thermally cracked sample. However, there are some AE events with significantly higher peak amplitude in the range from 0 to 0.2 MHz in the fresh sample, but not observed in the heat-treated sample. As AE events with low peak frequency are radiated from macrocracks, the occurrence of signals with low peak frequency and high peak amplitude (i.e., high seismic moment) in the fresh samples seems to be reasonable. However, the peak amplitude in the low-frequency band for the thermally cracked samples was much lower than that for the fresh samples. Although higher frequencies are attenuated more than lower frequencies, a reduction in the peak amplitude is also obvious in the low-frequency bands. Thus, it is considered that there is a difference in the source of AE signals with low peak frequency, not in the properties of the bulk material. The seismic moment is defined as (Eshelby, 1957; Sato and Hirasawa, 1973)
| \begin{equation}
M_{0} = \frac{16}{7}\sigma R^{3}
\end{equation}
| (7), |
where
σ is the stress drop and
R is the crack radius. For the same source dimension,
M0 is dependent on
σ. As presented in previous section and
Equation (7), AE events with different peak amplitudes in the same peak frequency band are equivalent to those with different seismic moments, same source dimension, and different stress drops. One important difference between the heat-treated and fresh samples is whether thermal cracks initially exist. Thus, the existence of a thermal crack is the major factor associated with the variation in stress drop. Thermal cracks that propagate during loading develop relatively large radiuses, R; consequently, the seismic moment, M
0, released should also be large. However, AEs from the thermally cracked samples of the present study have small peak amplitudes (which are roughly equivalent to their seismic moment), indicating small stress drops. We attribute this to the influence of factors such as crack density, shear modulus and rupture velocity. Hence, the loss of AE events with high peak amplitude and low peak frequency likely resulted from the propagation of thermal cracks. In contrast, when relatively small pre-existing cracks grow to the same size, the stress drop is large. In the case of the fresh samples, AE events with low peak frequency and high peak amplitude occurred in the final stage of deformation owing to the progressive growth of pre-existing cracks.
CONCLUSIONS
In this study, we performed AE measurements during triaxial deformation of granite and investigated the fracturing behavior of thermally cracked samples. Results show that the frequency characteristics during the damage process do not differ between thermally cracked and fresh granite. An analysis of the AE signals obtained by PZTs with a 2 MHz resonant frequency revealed that signals with low peak frequency appeared before failure of the sample, implying the initiation of microfractures with progressive growth of cracks. The peak amplitude calculated from events recorded in the thermally cracked samples is much lower than that in fresh samples. A theoretical model of the displacement spectrum suggests that the difference in peak amplitude between the thermally cracked and fresh samples can be attributed to the reduction in shear modulus induced by thermal cracking and to the attenuation filtering phenomenon caused by thermal cracks. Furthermore, our experimental results indicate that these differences are related to crack nucleation at higher differential stresses in the fresh samples. In particular, for the thermally cracked samples, the maximum value of the peak amplitude in the low-frequency band is small compared with the fresh samples. This unique amplitude characteristic is related to the stress drop, shear modulus, and source dimension, whereas the attenuation of the AE signals plays only a minor role. The low peak frequencies and amplitudes of AEs from the thermally cracked samples reflect low stress drops due to factors such as crack density, shear modulus and rupture velocity. In conclusion, although AE signals with low frequency can be considered precursors of rock failure, cracking behavior suggested by low-frequency-dominant signals depends on the initial damage condition of the rock specimen. These experimental results shed some lights to in the safety assessment in applications such as geothermal development, in which the reservoir is stimulated by hydraulic fracturing or cooling treatment.
ACKNOWLEDGMENTS
We thank Kazuki Sawayama for discussions regarding frequency characteristics and also thank AIST that the thin sections of rock samples were observed by a scanning electron microscope (HITACHI SU-3500) at GSJ-Lab. We gratefully acknowledge two anonymous reviewers for their invaluable suggestions. This study was partially supported by JSPS KAKENHI Grant Number 21K14579 to MK.
REFERENCES
- Akaike, H. (1998) Information Theory and an Extension of the Maximum Likelihood Principle. Serected Papers of Hirotugu Akaike, Springer, 199-213.
- Aki, K. (1967) Scaling law of seismic spectrum. Journal of Geophysical Research, 72, 1217-1231.
- Bieniawski, Z.T. (1967) Mechanism of brittle fracture of rock. Part I-theory of the fracture process. International Journal of Rock Mechanics and Mining Sciences & Geomechanics Abstracts, 4, 395-404.
- Brune, J.N. (1970) Tectonic stress and the spectra of seismic shear waves from earthquakes. Journal of Geophysical Research, 75, 4997-5009.
- Chaki, S., Takarli, M. and Agbodjan, W.P. (2008) Influence of thermal damage on physical properties of a granite rock: Porosity, permeability and ultrasonic wave evolutions. Construction and Building Materials, 22, 1456-1461.
- Chen, G., Sun, X., Wang, J., Wang, D. and Zhu, Z. (2020) Detection of cracking behaviors in granite with open precut cracks by acoustic emission frequency spectrum analysis. Arabian Journal of Geosciences, 13.
- Eshelby, J.D. (1957) The Determination of the Elastic Field of an Ellipsoidal Inclusion, and Related Problems. Proceedings of the Royal Society of London. Series A, Mathematical and Physical Sciences, 241, 376-396.
- Feng, Y., Su, H., Zhang, W., Yu, L. and Yin, Q. (2021) Experimental study on mechanical behaviors and fracture features of coarse marble specimens after thermal shock. International Journal of Geomechanics, 21, 06021013.
- Fournier, R.O. (1996) Compressive and tensile failure at high fluid pressure where preexisting fractures have cohesive strength, with application to the San Andreas Fault. Journal of Geophysical Research: Solid Earth, 101, 25499-25509.
- Grechka, V. and Kachanov, M. (2006) Effective elasticity of rocks with closely spaced and intersecting cracks. Geophysics, 71, D85-D91.
- Ishida, T., Labuz, J.F., Manthei, G., Meredith, P.G., et al (2017) ISRM suggested method for laboratory acoustic emission monitoring. Rock Mechanics and Rock Engineering, 50, 665-674.
- Kong, B., Li, Z. and Wang, E. (2018) Fine characterization rock thermal damage by acoustic emission technique. Journal of Geophysics and Engineering, 15, 1-12.
- Lei, X. (2006) Typical phases of pre-failure damage in granitic rocks under differential compression. Geological Society Special Publication, 261(January 1989), 11-29.
- Lei, X., Kusunose, K., Nishizawa, O., Cho, A. and Satoh, T. (2000) On the spatio-temporal distribution of acoustic emissions in two granitic rocks under triaxial compression: The role of pre-existing cracks. Geophysical Research Letters, 27, 1997-2000.
- Lei, X., Kusunose, K., Satoh, T. and Nishizawa, O. (2003) The hierarchical rupture process of a fault: An experimental study. Physics of the Earth and Planetary Interiors, 137, 213-228.
- Lei, X. and Ma, S. (2014) Laboratory acoustic emission study for earthquake generation process. Earthquake Science, 27, 627-646.
- Lei, X.L. (2017) Laboratory acoustic emission study review. In Rock Mechanics and Engineering Volume 2. CRC Press, 127-164.
- Lin, W. (2002) Permanent strain of thermal expansion and thermally induced microcracking in Inada granite. Journal of Geophysical Research: Solid Earth, 107, ECV 3-1-ECV 3-16.
- Lin, W., Nakamura, T. and Takahashi, M. (2003) Anisotropy of Thermal Property, Ultrasonic Wave Velocity, Strength Property and Deformability in Inada Granite. Journal of the Japan Society of Engineering Geology, 44, 175-187.
- Lockner, D.A., Byerlee, J.D., Kuksenkot, V., Ponomarev, A. and Sidorin, A. (1991) Quasi-static fault growth and shear fracture energy in Granite. Nature, 350, 39-42.
- Martin, C.D. and Chandler, N.A. (1994) The progressive fracture of Lac du Bonnet granite. International Journal of Rock Mechanics and Mining Sciences And, 31, 643-659.
- O’Connell, R.J. and Budiansky, B. (1977) Viscoelastic properties of fluid-saturated cracked solids. Journal of Geophysical Research, 82, 5719-5735.
- Ottemöller, L. and Havskov, J. (2003) Moment magnitude determination for local and regional earthquakes based on source spectra. Bulletin of the Seismological Society of America, 93, 203-214.
- Rothert, E. and Shapiro, S.A. (2007) Statistics of fracture strength and fluid-induced microseismicity. Journal of Geophysical Research: Solid Earth, 112, 1-16.
- Sato, T. and Hirasawa, T. (1973) Body wave spectra from propagating shear cracks. Journal of Physics of the Earth, 21, 415-431.
- Scholz, C.H. (1968) Microfracturing and the inelastic deformation of rock in compression. Journal of Geophysical Research, 73, 1417-1432.
- Sun, Q., Zhang, W., Xue, L., Zhang, Z. and Su, T. (2015) Thermal damage pattern and thresholds of granite. Environmental Earth Sciences, 74, 2341-2349.
- Thompson, B.D., Young, R.P. and Lockner, D.A. (2005) Observations of premonitory acoustic emission and slip nucleation during a stick slip experiment in smooth faulted Westerly granite. Geophysical Research Letters, 32, 1-4.
- Underwood, E.E. (1970) Quantitative stereology. pp. 274, Reading, Addison Wesley.
- Wang, C., Chang, X., Liu, Y. and Chen, S. (2019) Mechanistic characteristics of double dominant frequencies of acoustic emission signals in the entire fracture process of fine sandstone. Energies, 12.
- Wang, X.Q., Schubnel, A., Fortin, J., Guéguen, Y. and Ge, H.K. (2013) Physical properties and brittle strength of thermally cracked granite under confinement. Journal of Geophysical Research: Solid Earth, 118, 6099-6112.
- Zang, A., Wagner, F.C., Stanchits, S., Janssen, C. and Dresen, G. (2000) Fracture process zone in granite. Journal of Geophysical Research: Solid Earth, 105, 23651-23661.


