LETTER
Change in size distribution of porewater and entrapped air with progression of water infiltration in sandstone
2023 年 118 巻 1 号 論文ID: 221107

詳細
2023 年 118 巻 1 号 論文ID: 221107
Rocks have pores of various sizes. We investigated which pore sizes filled with water and in what order with the progression of water infiltration. The pore radii of the sandstone mainly ranges from a few µm to several tens of µm. Water was passed through the sandstone core at 25 °C, and water saturation, S, was adjusted to 63, 67, 71, 87, and 100%. At each S, the porewater radius distribution was measured using the water expulsion method, in which water in pores of a given pore radius was expelled by gas pressure. The results showed that the porewater radius distribution was approximately the same for S = 63-71%. As S increased from 71 to 100%, the pores with 4-10 and 10-20 µm radii were filled with water first, followed by pores with 20-52 µm radius. For S = 63-71%, water was considered to have entered via adsorption on the pore walls and capillary action at the corners of the pore. Because this water cannot be expelled by gas pressure, an increased amount of water was not detected by the water expulsion method. As for the results at S > 71%, a theoretical model of the dissolution of entrapped air, assuming a cylindrical shape, showed that the length of the trapped air decreases faster in pores with small radii than in those with large radii. This may be a major explanation for the experimental result, which showed that pores with small radii fill with water more quickly than those with large radii.
Knowledge of the mechanism and rate of water infiltration into pores is fundamental to understand the various physical and chemical processes that occur in rocks and soils. Pores in geological media are generally of various sizes and shapes. When water infiltrates vacant pores, the pores are often not fully saturated with water, and that air becomes trapped (Guéguen and Palciauskas, 1994; Kumar et al., 2010; Yokoyama et al., 2020). This air is known to have a significant effect on the ease of water flow in rocks (Nishiyama et al., 2012). The thickness of the unsaturated zone at the Earth’s surface is estimated to range from a few meters to a few hundreds of meters (Zimmerman and Bodvarsson, 1989). The amount of entrapped air is generally small for soils (3-22% of pore spaces; Faybishenko, 1995 and references therein), probably because for poorly consolidated media pores are comparatively well-connected (Lowry and Miller, 1995) and the porosity is high (Al Mansoori et al., 2010). However, a larger amount of air is often trapped in rocks that have poorer pore connectivity and lower porosity than soils (10-60% of pore spaces; Kumar et al. 2010; Nishiyama et al., 2012). Compared with the total amount of air trapped in rocks, less is known about the amount of air trapped in each pore radius and how that amount changes when water continues to flow. In this study, we applied the water expulsion method (Nishiyama et al., 2012) to sandstone to examine the amount of water in each pore radius, and investigated the pore radius at which water increases and air decreases as water infiltration progresses. In addition, to account for the experimental results, we developed a model to assess the dependence of the rate at which trapped air dissolves in water on the pore radius.
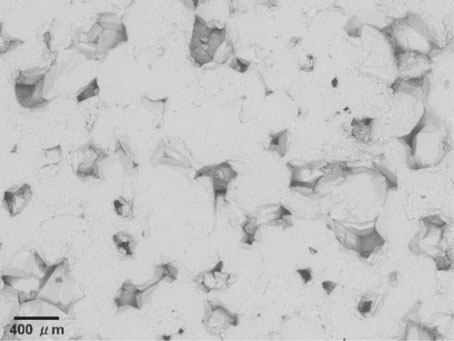
Fontainebleau sandstone from France was used for the experiments. Figure 1 shows a backscattered electron image of the rock sample obtained with a scanning electron microscope (TM3030, Hitachi). The mean diameter of mineral grains is approximately 248 µm. Energy-dispersive X-ray spectroscopy showed that the sample was composed almost exclusively of quartz. A sandstone core, 8.1 mm in height and 34.4 mm in diameter, was used. The lateral side of the core was filled with resin (Technovit4004) to allow water to flow in one direction. The porosity of the sample was 9.9% (connected pores), which was calculated from the rock volume (7.50 cm3) and the difference between the dry weight (33.916 g) and water-saturated weight (34.653 g) of the sample (density of water = 0.997 g cm−3). The water-saturated weight was measured after saturating the pores with water by vacuum impregnation, according to the procedure described by Yokoyama (2013).
The sample was dried in an oven at 70 °C and cooled to room temperature. Then, to adjust the water saturation S (%), the sample was installed on a water permeation apparatus (Fig. 2a) for the permeation of ultrapure water (18.2 MΩ). Water pressure was maintained at a constant water head difference of 17.8 cm. The entire portion in Figure 2a was placed in an incubator at a constant temperature of 25 °C. As soon as the water began to flow, S reached 63% and continued to increase with time. To determine S, the sample was occasionally removed from the apparatus, excess water on the sample surface was wiped off with a pre-moistened tissue, and the sample was weighed. S is calculated by S = (wet weight − dry weight)/(water-saturated weight − dry weight) × 100. S was adjusted to 63, 67, 71, and 87%, and the porewater radius distribution measurement was started immediately (error in S was estimated to be within a few percent). At S = 100%, the sample was saturated with water by vacuum impregnation and not by water permeation.

We used the water expulsion method (Nishiyama et al., 2012) to measure porewater radius distribution (Fig. 2b) after adjusting S by the above procedure. In this method, gas pressure is applied to the bottom of the sample and the water volume in each pore radius expelled from the top is quantified by increasing the gas pressure in a stepwise manner. The pore radius r (m) is determined by r = 2γcosθ/ΔP, where ΔP is the pressure difference (Pa) at top and bottom of the sample, γ is the interfacial tension (N/m), and θ is the contact angle (assumed to be 0°) (Nishiyama et al., 2012). The value of γ was calculated for the temperature at the time of measurement (20.0-26.0 °C) using the equation provided by Vargaftik et al. (1983). We selected four suitable ΔP [2.8 × 10³ Pa (52 µm), 7.3 × 10³ Pa (20 µm), 1.4 × 10⁴ Pa (10 µm), and 3.6 × 10⁴ Pa (4 µm), value in parenthesis was r for the ΔP] to evaluate the change in the porewater radius distribution when S is changed. The uncertainty in radius due to variation of ΔP was less than ±4% for each radius. For S = 100%, the same measurements were performed four times to check reproducibility. In the water expulsion method results, the measured radius and the radius of air coincide if the radii of each tube are assumed to be constant, as shown in Figure 2c. However, when the radii of the tubes change, as shown in Figure 2d, the radius of air is estimated to be smaller (Fig. 2d; left) or larger (Fig. 2d; right) than the actual. Because the extent of the situation shown in Figure 2d is difficult to estimate using the water expulsion method, a constant radius is assumed in the following discussion. A similar difference between the actual and measured radii occurs when using the mercury intrusion method, which is a popular method for measuring pore radius distribution.
Figure 3a shows the porewater radius distribution measured at each S, where the vertical axis is the water volume fraction ϕwat for each pore radius (= water volume in pore of each radius / whole rock volume × 100). The data points at 4, 10, 20, and 52 µm are the sum of the amount of water in pores with radii of 4-10, 10-20, 20-52, and >52 µm, respectively, and their ranges are shown in Figure 3a. Figure 3b shows how ϕwat changes with S. The sample has the highest pore volume around 10 µm radius (Fig. 3a; S = 100%). The four measurements at S = 100% show good reproducibility for three of the measurements. The repeatability error for all four measurements was ±7-39%, and the error that excluded the first measurement was ±6%. A possible reason for the difference between the first and subsequent three measurements at S = 100% is that the pore radius distribution changed owing to the movement of unstable grains during the course of the first water expulsion, but stabilized thereafter.
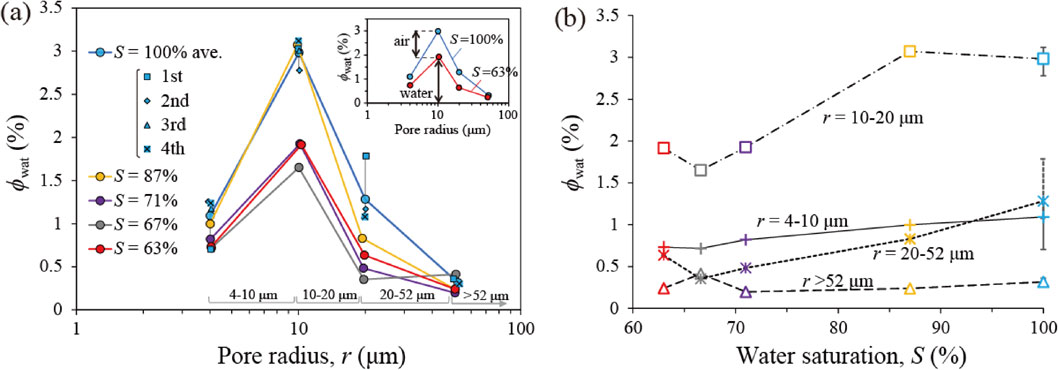
In Figure 3a, the data with S values between 63 and 71% are considered almost identical within the margin of error. However, when S increased to 87%, the relatively narrow pores of 4-10 and 10-20 µm radii were almost completely filled with water, while air still remained in the wider 20-52 µm radius pore. The trend in the widest pore radius of >52 µm is difficult to evaluate because of the large uncertainty due to small water volume, even at S = 100%.
As shown in Figure 3a, the porewater radius distribution at S = 71% was approximately the same as that at S = 63%, although S increased by 8%. Water adsorbs on the pore wall and a water film of nanometer (nm) to submicron (µm) order of thickness is formed (Nishiyama and Yokoyama, 2013b), even in pores with entrapped air. For water in the pores to be expelled using the water expulsion method, the pores must be filled with water (Fig. 2b). When the pore wall surface is covered by only a water film (Fig. 2b), gas passes through the center of the pore, and water cannot be pushed out by the gas pressure. Therefore, the increase in S from 63 to 71% without a definite change in the porewater radius distribution is considered at least partly due to the formation of a water film.
The thickness of the water film on the pore wall surface of entrapped air is calculated as follows (Nishiyama and Yokoyama, 2013a):
| \begin{equation} \frac{\varepsilon_{r}\varepsilon_{0}}{2}\left(\frac{\pi k_{\text{B}}T}{eZ}\right)^{2}\frac{1}{h^{2}} - \frac{A_{\text{svl}}}{6\pi h^{3}} = \frac{2\gamma}{r} \end{equation} | (1), |
Pores in rocks typically have corners. The capillary rise in the corners proceeds before the center of the channel is filled with water (Ponomarenko et al., 2011). Thus, the most likely form of water present in the air-trapping pores, other than the water film, is water filling the corners (Fig. 4). The water present in such a corner is not detected by our water expulsion method unless the radius of the meniscus of corner water exceeds 4 µm (maximum ΔP applied was ∼ 360 hPa). Because the contribution of the water film to the 8% increase in S is less than 2-4% from the above calculation, the remaining 4% (= 8-4%) or more is expected to be corner water.

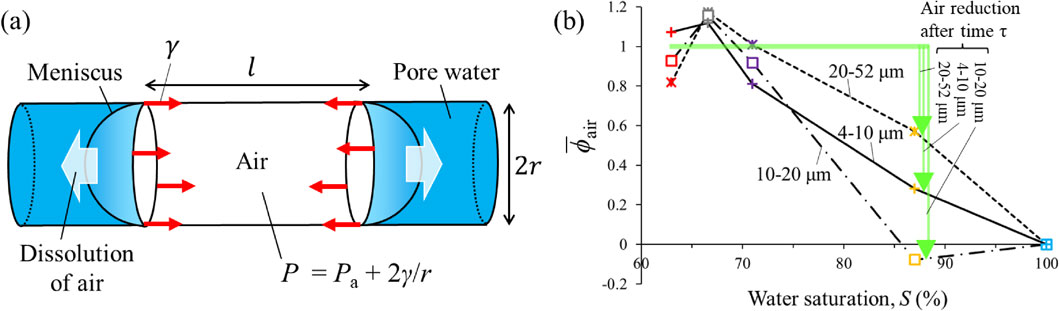
As S exceeds 71%, the water volume fraction (ϕwat) increases and the air volume fraction ϕair decreases with increasing S for any pore of radii of 4-10, 10-20, or 20-52 µm (Figs. 3a and 3b) (ϕwat + ϕair = total pore volume in pore of each radius / whole rock volume × 100). In Figure 3a, narrow pores with 4-10 and 10-20 µm radii are almost fully filled with water at S = 87%, while much air remains in the pores of 20-52 µm radius. In other words, the experimental results showed that the air in the pores with small radii disappeared before the air in the pores with large radii. In the current experiment, before the water flows into the rock, it is considered to be in equilibrium with air, and additional dissolution of air is unlikely to occur at atmospheric pressure. However, the pressure of the trapped air P is greater than the atmospheric pressure Pa by the capillary pressure (2γ/r) (Fig. 5a). This P is expressed as
| \begin{equation} P = P_{a} + \frac{2\gamma}{r} \end{equation} | (2). |
| \begin{align} J &= k\left(c_{w} - \frac{P}{RTK_{H}}\right) = k\left(\frac{P_{a}}{RTK_{H}} - \frac{P}{RTK_{H}}\right) \\&= -k\frac{2\gamma}{rRTK_{H}} \end{align} | (3), |
| \begin{equation} \frac{dn}{dt} = -AJ = \frac{8\pi \gamma k}{RTK_{H}}r \end{equation} | (4). |
| \begin{equation} \frac{dV}{dt} = \frac{1}{\rho}\frac{dn}{dt} = \frac{8\pi \gamma k}{RT\rho K_{H}}r \end{equation} | (5). |
| \begin{equation} \frac{dV}{dt} = \pi r^{2}\frac{dl}{dt} \end{equation} | (6). |
| \begin{equation} \frac{dl}{dt} = \frac{8\gamma k}{RT\rho K_{H}}\frac{1}{r} \end{equation} | (7). |
| \begin{equation} \frac{dV}{dt}\frac{N}{V_{\text{tot}}} = \frac{dl}{dt} \frac{1}{l_{0}} \end{equation} | (8). |
The above discussion strongly suggests that the experimental results that pores with small radii are filled with water quicker than pores with large radii can be explained primarily by the radius dependence of the dissolution rate of trapped air. Another possible explanation is air movement. However, if air movement accounted for the experimental results, air with a smaller radius should move more easily. Although no evidence was found for such air movement, the present results do not rule out this possibility. The evaluation of air movement in complex pore structure is a subject for future research.
Using Fontainebleau sandstone with the main pore radii, ranging from a few micrometers to several tens of micrometers, we applied the water expulsion method to investigate how air in the pores of each radius is replaced by water during infiltration. The results and interpretations are as follows:
We thank the two anonymous reviewers for their constructive comments.