INTRODUCTION
Dense hydrous magnesium silicates (DHMS) are of interest because of their potential to circulate water deep into the Earth (e.g., Kawamoto, 2006). One of the DHMS, phase A [Mg7Si2O8(OH)6], was discovered by Ringwood and Major (1967) along with phase B and phase C, and its crystal structure, infrared (IR), Raman, and NMR spectra have since been studied (e.g., Horiuchi et al., 1979; Akaogi and Akimoto, 1986; Kanzaki et al., 1992; Liu et al., 1997; Kagi et al., 2000). These studies revealed that phase A has two hydrogen sites, H1 and H2, with both hydrogens forming hydrogen bonds with a common oxygen, O3 (e.g., Kagi et al., 2000). Similar hydrogen bonding arrangements are commonly found in DHMS (Prewitt and Parise, 2000) including the superhydrous phase B and phase B. As pointed out by Kanzaki (1993), since superhydrous phase B is the same as phase C, it will be referred to as phase C hereafter. In this configuration, the hydrogen-hydrogen distance (H1-H2) is relatively short and becomes even shorter under high pressure, which may affect the stability of phase A under pressure (Poswal et al., 2009). The configuration is also expected to have strong vibrational coupling between nearby O-Hs. Although the crystal structure of phase A under pressure has been studied, it is still difficult to determine the exact position of the hydrogen or deuterium. For this reason, O-H stretching vibrations observed by Raman and IR spectroscopy have attracted much attention as they provide various information about hydrogen bonding under pressure (e.g., Hofmeister et al., 1999). However, it is not straightforward to determine hydrogen bonding from O-H stretching vibration frequencies because they are affected by O-H vibrational coupling and the resulting complicated behaviors such as peak splitting, which have rarely been considered in previous studies. In this study, we considered the effect of O-H coupling (correlation field splitting) for phase A and phase C.
Liu et al. (1997) measured Raman spectra of phase A up to 40 GPa at room temperature. They found that the Raman peaks of all vibrational modes except O-H stretching modes shifted to higher frequency with pressure, but at about 18 GPa they found a sudden change in trend, which they interpreted as a phase transition. Apart from the transition, the pressure variation of the O-H stretching frequencies showed a very interesting change. At ambient pressure, two strong O-H stretching bands were observed at 3400 and 3518 cm−1, consistent with those reported in the IR spectra (Akaogi and Akimoto, 1986; Kagi et al., 2000). The two bands shift toward the lower frequency with pressure, but the shift was steeper for the 3518 cm−1 band, and the two bands are closest to each other around 18 GPa, but do not intersect, and then move apart. Therefore, the 3518 cm−1 band initially shifts faster than the 3400 cm−1 band, but above 18 GPa the slope changes and shifts slightly to the higher frequency with pressure. Furthermore, the 3518 cm−1 band was found to split above 18 GPa. On the other hand, the 3400 cm−1 band initially shifts slightly to the lower wavenumber but shifts more steeply to the lower frequency above 18 GPa. These changes were reversible with no apparent hysteresis. Although Liu et al. (1997) attributed this to the phase transition, the behavior is similar to the pressure dependence of the O-H vibrational frequencies under Fermi resonance. For example, Aoki et al. (1995) reported a similar pattern in ice VII. In this case, it was interpreted that the overtone of the bending mode and the O-H stretching mode of the water molecule were responsible for the Fermi resonance. For phase A, neither the overtone nor the combination modes can interact with the O-H stretching modes, so the behavior observed by Liu et al. (1997) is not a Fermi resonance, but likely due to vibrational coupling between two O-H stretching vibrational modes. Such a splitting is known as correlation field splitting or Davydov splitting (e.g., Hornig 1948; Turrell, 1972). Correlation field splitting is a common phenomenon in vibrational spectroscopy, and hydrous minerals are no exception. An effective way to experimentally clarify correlation field splitting is to lift the vibrational coupling by isotope dilution (Hiebert and Hornig, 1952; Novak, 1974). When the hydrogen near O-H is replaced by deuterium, the O-H and O-D stretching frequencies are so different that the vibrational coupling disappears. Therefore, a difference in the O-H stretching frequency between the isotope-diluted and non-diluted samples would indicate the extent to which correlated field splitting is occurring.
To investigate whether this curious behavior of phase A can be explained by correlation field splitting, the vibrational frequencies of phase A were studied using Density Functional Perturbation Theory (DFPT) phonon calculations. To mimic the isotope dilution method, hydrogen was replaced by deuterium at the H1 or H2 site or both. The calculations also provide information on the correlation field splitting of the O-D stretching frequencies for fully deuterated phase A. In addition, correlation field splitting in phase C was briefly studied.
RESULTS AND DISCUSSION
Structural changes of phase A with pressure
Poswal et al. (2009) had conducted similar DFT calculations for structural changes in phase A at high pressures up to 45 GPa, and the present calculations are essentially identical to their results. Therefore, only the main features of the structural changes with pressure are briefly presented here. No phase transition was found up to the calculated maximum pressure of 25 GPa. The most significant feature is the O-H distance, with O-H2 increasing with pressure and O-H1 increasing slightly at lower pressure and then decreasing with pressure (Fig. 1a). As for the hydrogen bond distance (O-H···O3), both decrease with pressure, but not as much for O-H1 (Fig. 1b). Here ‘O-H···O3’ means the distance between two oxygen atoms with hydrogen bond between H and O3. It is known that there is an inverse correlation between hydrogen bond distances and O-H distances (Novak, 1974), and this correlation for phase A is shown in Figure 1c. Indeed, O-H2 shows an inverse correlation, but O-H1 is very different from O-H2, showing rather a positive correlation. Therefore, the behavior of the O-H1 is anomalous. Poswal et al. (2009) obtained similar result, suggesting that the shortening of the O-H1 distance occurs due to the release of H-H repulsive strain. The small and opposite change in the O-H1 distance may be related to the fact that the O-H1 stretching frequency after vibrational decoupling is almost independent of pressure, as will be discussed below. Figure 1d shows the pressure dependence of the hydrogen bond angles. Both angles decrease with pressure, but the one involving H1 changes more rapidly.
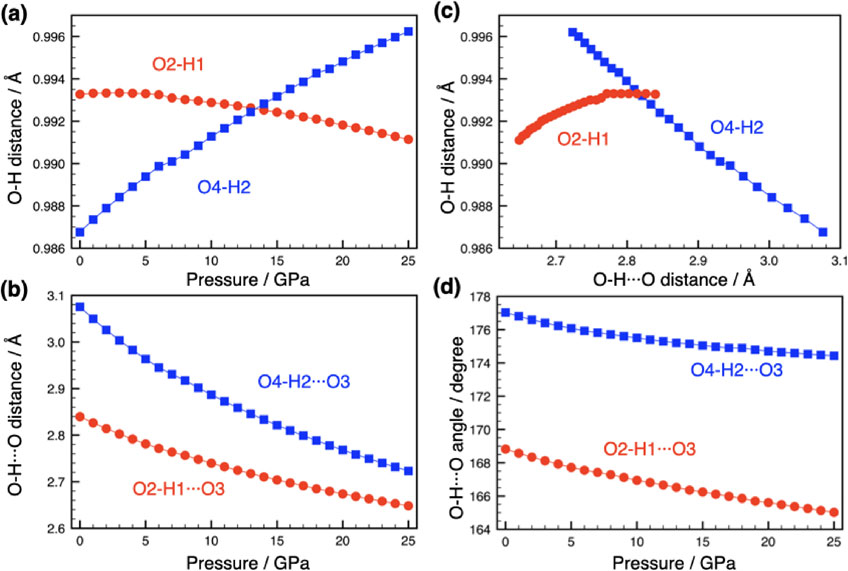
Figure 1. Simulated structural changes of the hydrogen bonding configurations of phase A with pressure. Red symbols show O-H1 related parameters, while blue symbols show O-H2 related parameters. (a) O-H distance versus pressure, (b) O-H···O hydrogen bond distance versus pressure, (c) O-H···O hydrogen bond distance versus O-H distance, and (d) O-H···O angle versus pressure. Lines are guides for the eye.
To the best of our knowledge, no vibration calculations have been performed for phase A. The vibration mode analysis of phase A using the correlation method (Fateley et al., 1972) shows that the vibration modes, excluding three translation modes, are 28A + 29B + 28E1 + 29E2. Among them, the Raman active modes are 28A + 28E1 + 29E2, while the IR active modes are 28A + 28E1. E1 and E2 are doubly degenerate modes, while B is a silent mode. The frequencies of all these modes have been calculated, but in this paper, we focus on the O-H stretching modes. Two O-H bands have been experimentally identified for phase A, but in fact each band consists of five modes (A, E1, and E2) for Raman and three modes (A and E2) for IR spectra. Simulated powder Raman and IR spectra of the O-H stretching frequency region from the intensity calculation are shown in Figure 2. The frequency differences between these A, E1, and E2 modes are so small (see Table 1) that they are observed as a single band for each. The calculated Raman and IR intensities show that the 3400 cm−1 band is dominated by the A mode in both Raman and IR spectra, while the 3518 cm−1 band is dominated by the A mode in Raman and the E1 mode in IR. For the 3518 cm−1 band, the Raman band is reported at 3518 cm−1 (Liu et al., 1997), while the IR band is reported at 3515 cm−1 (Akaogi and Akimoto, 1986) and 3513 cm−1 (Kagi et al., 2000). The calculation seems to reproduce this difference (4 cm−1 difference between E1 and A modes for the corresponding 3518 cm−1 band) as shown in Figure 2. The intensities of the O-H stretching modes in the Raman spectra are calculated to be much stronger than that of the lower frequency modes, which is consistent with experimental observations (Liu et al., 1997)
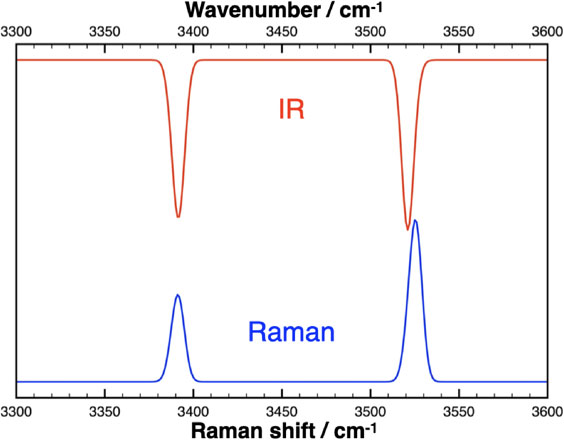
Figure 2. Simulated ‘powder’ Raman (blue) and infrared transmission (red) spectra of the OH stretching frequency region of phase A at 1 atm. The calculated mode frequencies and intensities (A, E1, and E2 modes in Raman and A and E1 modes in IR) and Gaussian peak functions with a width at half maximum of 4 cm−1 are used to simulate the spectra. The scale of the vertical axis is arbitrary. The IR spectrum is vertically flipped for clarity. The wavenumbers in this plot are scaled to the calculated values by a factor of 1.05.
Table 1. The calculated OH/OD stretching vibration frequencies
* of non-deuterated and fully deuterated phase A
| P/GPa |
OH low frequency band
Wavenumber/cm−1 |
OH high frequency band
Wavenumber/cm−1 |
OD low frequency band
Wavenumber/cm−1 |
OD high frequency band
Wavenumber/cm−1 |
| Mode |
A |
E1 |
E2 |
A |
E1 |
E2 |
A |
E1 |
E2 |
A |
E1 |
E2 |
| 0 |
3312 |
3311 |
3314 |
3441 |
3439 |
3440 |
2412 |
2411 |
2414 |
2508 |
2505 |
2506 |
| 1 |
3308 |
3307 |
3310 |
3429 |
3427 |
3428 |
2409 |
2409 |
2411 |
2500 |
2496 |
2497 |
| 2 |
3305 |
3303 |
3306 |
3418 |
3415 |
3417 |
2407 |
2406 |
2409 |
2492 |
2488 |
2489 |
| 3 |
3301 |
3300 |
3303 |
3407 |
3404 |
3406 |
2404 |
2404 |
2406 |
2484 |
2480 |
2481 |
| 4 |
3298 |
3297 |
3299 |
3397 |
3394 |
3396 |
2402 |
2402 |
2404 |
2477 |
2472 |
2474 |
| 5 |
3295 |
3294 |
3296 |
3388 |
3384 |
3387 |
2400 |
2400 |
2402 |
2470 |
2465 |
2467 |
| 6 |
3292 |
3291 |
3293 |
3379 |
3375 |
3378 |
2398 |
2398 |
2399 |
2464 |
2458 |
2461 |
| 7 |
3290 |
3289 |
3290 |
3373 |
3368 |
3372 |
2395 |
2396 |
2397 |
2458 |
2452 |
2455 |
| 8 |
3287 |
3287 |
3287 |
3367 |
3362 |
3366 |
2393 |
2394 |
2394 |
2452 |
2446 |
2449 |
| 9 |
3283 |
3283 |
3284 |
3360 |
3354 |
3359 |
2391 |
2391 |
2392 |
2447 |
2441 |
2444 |
| 10 |
3279 |
3280 |
3279 |
3354 |
3347 |
3353 |
2388 |
2389 |
2389 |
2443 |
2436 |
2440 |
| 11 |
3275 |
3276 |
3275 |
3349 |
3341 |
3348 |
2385 |
2386 |
2385 |
2439 |
2431 |
2436 |
| 12 |
3270 |
3271 |
3270 |
3344 |
3336 |
3343 |
2382 |
2383 |
2382 |
2435 |
2428 |
2433 |
| 13 |
3266 |
3266 |
3264 |
3340 |
3332 |
3340 |
2379 |
2380 |
2378 |
2432 |
2425 |
2430 |
| 14 |
3260 |
3261 |
3258 |
3337 |
3329 |
3337 |
2376 |
2376 |
2374 |
2430 |
2422 |
2428 |
| 15 |
3255 |
3255 |
3253 |
3334 |
3326 |
3334 |
2372 |
2372 |
2370 |
2427 |
2420 |
2427 |
| 16 |
3249 |
3249 |
3246 |
3332 |
3324 |
3333 |
2368 |
2368 |
2365 |
2426 |
2418 |
2425 |
| 17 |
3243 |
3243 |
3240 |
3330 |
3322 |
3331 |
2364 |
2363 |
2360 |
2424 |
2417 |
2424 |
| 18 |
3236 |
3236 |
3232 |
3329 |
3320 |
3330 |
2361 |
2359 |
2357 |
2424 |
2417 |
2424 |
| 19 |
3231 |
3231 |
3227 |
3329 |
3320 |
3330 |
2357 |
2355 |
2352 |
2423 |
2416 |
2423 |
| 20 |
3225 |
3224 |
3220 |
3328 |
3320 |
3329 |
2352 |
2349 |
2347 |
2422 |
2415 |
2423 |
| 21 |
3219 |
3217 |
3214 |
3328 |
3320 |
3329 |
2348 |
2345 |
2342 |
2423 |
2415 |
2422 |
| 22 |
3213 |
3211 |
3207 |
3328 |
3320 |
3329 |
2344 |
2340 |
2338 |
2422 |
2415 |
2423 |
| 23 |
3207 |
3204 |
3201 |
3328 |
3320 |
3330 |
2340 |
2336 |
2333 |
2422 |
2415 |
2423 |
| 24 |
3201 |
3198 |
3195 |
3328 |
3320 |
3330 |
2335 |
2331 |
2329 |
2422 |
2416 |
2423 |
| 25 |
3195 |
3192 |
3188 |
3329 |
3321 |
3331 |
2331 |
2327 |
2324 |
2422 |
2416 |
2424 |
*Frequencies are affected by vibrational coupling.
The direction and magnitude of the atomic displacements of the hydrogens for the A modes at 1 atm are shown in Figure 3 (left). The A mode at 3400 cm−1 (3312 cm−1 by calculation) is dominated by the stretching of O-H1, but O-H2 also undergoes a small stretching, and they are in opposite phase (left side of Fig. 3a). On the other hand, the A mode at 3518 cm−1 (3441 cm−1 by calculation) is dominated by stretching of O-H2, but O-H1 also undergoes a small stretching, and both are in phase (left side of Fig. 3b). These results confirm previous studies (e.g., Kagi et al., 2000) that attributed the 3400 cm−1 band to O-H1 and the 3518 cm−1 band to O-H2 stretching vibrations. Both O-H1 and O-H2 had a bending component, but not in the direction of avoiding nearby hydrogen, but rather in the direction of avoiding nearby Si. This is probably due to the relatively short Si-H distance in this structure, and the Si-H1 and Si-H2 distances at 1 atm are 2.650 and 2.805 Å, respectively. Although only the A mode is shown here, the E1 and E2 modes also have the same local displacements as the A mode, the only difference being whether the phase relationship of each of the multiple hydrogen bonding configurations in the unit cell is in phase or opposite phase.

The pressure dependence of the calculated OH stretching frequencies (A, E1, and E2) of phase A without deuterium dilution is shown in Figure 4a and given in Table 1. This figure can be directly compared with the observed O-H stretching modes of the Raman bands by Liu et al. (1997). The higher frequency band (corresponding to the observed Raman band at 3518 cm−1) shifts toward the lower frequency with pressure, but its pressure dependence gradually decreases and becomes nearly constant above 17 GPa. On the other hand, the low-frequency band (corresponding to the observed Raman band at 3400 cm−1) initially shifts more slowly toward lower frequencies with pressure, but the slope changes significantly at pressures above 13 GPa. The wavenumber difference (averaged over A, E1, and E2) between the two bands reaches a minimum (71 cm−1) at 11.5 GPa (δOH in Fig. 4c). The pressure at which the minimum wavenumber difference was observed is lower than the experimentally observed value of 18 GPa, and the minimum difference is evaluated somewhat larger (about 55 cm−1 from Liu et al., 1997). However, the pressure dependencies of two bands in Figure 4a reproduce the essential features of the observed Raman data. It was also observed that the frequency difference between each mode (A, E1, and E2) increases with pressure, especially in the higher frequency band.
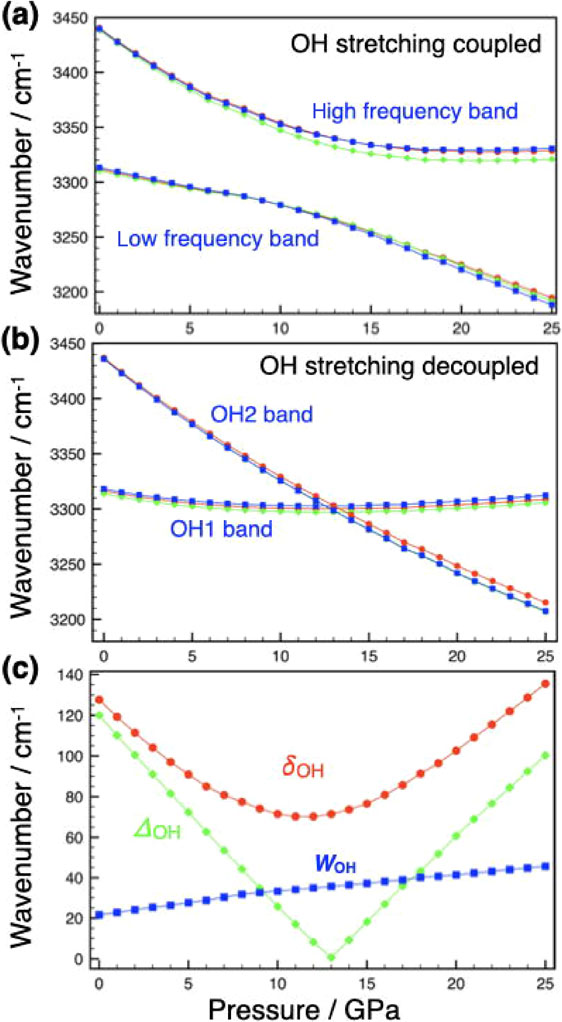
Figure 4. The calculated O-H stretching vibrational frequencies (wavenumber/cm−1) of phase A with vibrational coupling. (a) O-H stretching frequencies with vibrational coupling versus pressure, (b) O-H stretching frequencies without vibrational coupling versus pressure, and (c) frequency differences between two bands with vibrational coupling (δOH) and without vibrational coupling (ΔOH) and vibrational coupling constant (WOH) versus pressure. Red, green, and blue symbols indicate A, E1, and E2 modes for (a) and (b), respectively. Lines are guides for the eye.
The direction and magnitude of the O-H vibrational displacements of the hydrogens for the A modes at 13 GPa are shown in Figure 3 (center). At this pressure, the O-H1 and O-H2 stretching vibrations have almost the same displacement magnitude, indicating that the vibrational modes are mixed due to strong vibrational coupling. On the other hand, at 25 GPa, the O-H1 displacement (Fig. 3b right) is dominant on the high-frequency side, indicating a reversal of the relationship at 1 atm (Fig. 3b left). In other words, the modes are switched. On the low frequency side (Fig. 3a), the opposite is true. It was also noted that in the low frequency mode (Fig. 3a), OH1 and OH2 stretching displacements are always in opposite phase, while in the high frequency mode (Fig. 3b) they are in phase.
The pressure dependence of the O-H stretching frequencies with the H1 or H2 site replaced by deuterium is shown in Figure 4b (see also Table 2). Comparing Figures 4a and 4b, there is a significant difference in the pressure dependence of the O-H frequencies with and without vibrational coupling. In the absence of vibrational coupling, the O-H2 frequency decreases monotonically with pressure, while the O-H1 frequency is nearly pressure independent, crossing each other at about 12 GPa. These results clearly show that when the frequencies of O-H1 and O-H2 approach each other due to compression, vibrational coupling occurs between them, resulting in peak splitting. Thus, the strange pressure-induced behavior of the O-H stretching bands can be explained by pressure-tuned correlation field splitting. It also explains the observed fully reversible ‘phase transition’.
Table 2. The calculated OH/OD stretching vibrational frequencies
* of a half deuterated phase A
| P/GPa |
OH1 3400 cm−1 band
Wavenumber/cm−1 |
OH2 3518 cm−1 band
Wavenumber/cm−1 |
OD1 band
Wavenumber/cm−1 |
OD2 band
Wavenumber/cm−1 |
| Mode |
A |
E1 |
E2 |
A |
E1 |
E2 |
A |
E1 |
E2 |
A |
E1 |
E2 |
| 0 |
3316 |
3314 |
3318 |
3437 |
3436 |
3436 |
2414 |
2413 |
2416 |
2505 |
2503 |
2503 |
| 1 |
3314 |
3311 |
3315 |
3424 |
3423 |
3423 |
2412 |
2411 |
2414 |
2496 |
2494 |
2493 |
| 2 |
3311 |
3308 |
3313 |
3412 |
3411 |
3411 |
2410 |
2409 |
2412 |
2488 |
2485 |
2485 |
| 3 |
3309 |
3306 |
3311 |
3401 |
3399 |
3399 |
2408 |
2407 |
2411 |
2479 |
2476 |
2476 |
| 4 |
3307 |
3304 |
3309 |
3390 |
3388 |
3388 |
2407 |
2405 |
2409 |
2471 |
2468 |
2468 |
| 5 |
3305 |
3302 |
3307 |
3379 |
3377 |
3377 |
2405 |
2404 |
2408 |
2464 |
2460 |
2460 |
| 6 |
3304 |
3301 |
3306 |
3368 |
3366 |
3366 |
2404 |
2403 |
2407 |
2456 |
2452 |
2452 |
| 7 |
3303 |
3300 |
3305 |
3358 |
3355 |
3355 |
2403 |
2402 |
2406 |
2449 |
2445 |
2444 |
| 8 |
3302 |
3299 |
3304 |
3348 |
3345 |
3345 |
2402 |
2401 |
2405 |
2442 |
2437 |
2437 |
| 9 |
3301 |
3298 |
3304 |
3338 |
3335 |
3335 |
2402 |
2401 |
2404 |
2435 |
2430 |
2430 |
| 10 |
3301 |
3298 |
3303 |
3329 |
3325 |
3326 |
2401 |
2400 |
2404 |
2428 |
2423 |
2423 |
| 11 |
3300 |
3297 |
3303 |
3320 |
3316 |
3317 |
2401 |
2400 |
2404 |
2422 |
2416 |
2416 |
| 12 |
3300 |
3297 |
3303 |
3312 |
3307 |
3308 |
2400 |
2400 |
2403 |
2415 |
2410 |
2409 |
| 13 |
3300 |
3297 |
3303 |
3303 |
3298 |
3299 |
2400 |
2399 |
2403 |
2409 |
2403 |
2403 |
| 14 |
3300 |
3297 |
3303 |
3295 |
3290 |
3290 |
2400 |
2399 |
2403 |
2403 |
2397 |
2397 |
| 15 |
3301 |
3298 |
3304 |
3286 |
3281 |
3282 |
2400 |
2399 |
2403 |
2397 |
2391 |
2390 |
| 16 |
3301 |
3298 |
3304 |
3278 |
3273 |
3273 |
2400 |
2399 |
2404 |
2391 |
2385 |
2384 |
| 17 |
3301 |
3298 |
3304 |
3270 |
3264 |
3264 |
2400 |
2399 |
2403 |
2385 |
2378 |
2378 |
| 18 |
3302 |
3299 |
3305 |
3264 |
3258 |
3258 |
2401 |
2400 |
2404 |
2381 |
2374 |
2373 |
| 19 |
3303 |
3300 |
3306 |
3256 |
3250 |
3250 |
2401 |
2400 |
2405 |
2375 |
2368 |
2368 |
| 20 |
3304 |
3301 |
3307 |
3248 |
3241 |
3242 |
2401 |
2401 |
2405 |
2370 |
2362 |
2362 |
| 21 |
3305 |
3302 |
3308 |
3241 |
3234 |
3235 |
2402 |
2401 |
2405 |
2364 |
2357 |
2356 |
| 22 |
3306 |
3302 |
3309 |
3235 |
3227 |
3228 |
2402 |
2402 |
2406 |
2360 |
2352 |
2351 |
| 23 |
3307 |
3303 |
3310 |
3228 |
3220 |
3221 |
2403 |
2402 |
2407 |
2355 |
2346 |
2346 |
| 24 |
3308 |
3305 |
3311 |
3222 |
3213 |
3214 |
2404 |
2403 |
2407 |
2350 |
2341 |
2341 |
| 25 |
3309 |
3306 |
3312 |
3215 |
3207 |
3208 |
2404 |
2404 |
2408 |
2346 |
2337 |
2336 |
*Frequencies are not affected by vibrational coupling.
Liu et al. (1997) observed the splitting of the 3518 cm−1 band starting at 18 GPa. Although the frequency difference between A, E1, and E2 modes for the 3518 cm−1 band increases with pressure, reaching 10 cm−1 at 25 GPa (Table 1), it is not sufficient to explain the observed splitting (about 30 cm−1 at 25 GPa). It could be due to other reasons, such as degeneration of E modes by non-hydrostatic pressure, etc., which remain to be elucidated.
To analyze the correlation field splitting of phase A, the phenomenological analysis commonly applied to Fermi resonance (e.g., Hanson and Jones, 1981) was performed. Figure 4c shows the frequency difference between the two bands in the undiluted system (δ), and the frequency difference (absolute value) in the diluted system (Δ). From perturbation theory, these two can be related by the following equation:
| \begin{equation*}
\delta^{2} = \varDelta^{2} + 4W_{\text{OH}}^{2}.
\end{equation*}
|
Here, WOH reflects the degree of O-H vibrational coupling and is referred to here as the ‘O-H vibrational coupling constant’. The calculated WOH is plotted as a function of pressure in Figure 4c, and it increases monotonically with pressure. This implies that the vibrational coupling becomes stronger with pressure, which can be attributed to the proximity of the two O-H bonds under pressure.
Similarly, the O-D stretching frequencies of fully deuterated phase A are shown in Figure 5a and Table 1. Although no Raman spectrum of deuterated phase A has been reported, Kagi et al. (2000) reported IR spectra of a deuterated sample with two OD bands (2516 and 2599 cm−1). Our predicted wavenumbers are 4% lower than observed (Table 1). As expected, the pressure-induced O-D frequency change is qualitatively identical to that of O-H in Figure 4a. The same is true for the decoupled O-D stretching frequencies (Fig. 5b and Table 2).

Figure 5. The calculated O-D stretching vibration frequencies (wavenumber/cm−1) of phase A without vibrational coupling. (a) O-D stretching frequencies with vibrational coupling versus pressure, (b) O-D stretching frequencies without vibrational coupling versus pressure, and (c) frequency differences between two bands with vibrational coupling (δOD) and without vibrational coupling (ΔOD) and vibrational coupling constant (WOD) versus pressure. Red, green, and blue symbols indicate A, E1, and E2 modes for (a) and (b), respectively. Lines are guides for the eye.
The frequency ratio between O-H and O-D (νOH/νOD) for the same mode calculated from Figures 4a and 5a is 1.370 to 1.374, almost independent of pressure. If we assume that only O and H contributes to the stretching vibration, we can apply the classical model of diatomic spring vibration (e.g., Ferraro and Nakamoto, 1994). In this case, using the atomic masses of our calculations, the frequency ratio becomes 1.374, which is very close to the value given above. According to Novak’s compilation, νOH/νOD is about 1.350-1.355 for materials with weak hydrogen bonding, which is close to the calculated value for phase A.
The calculated WOD is plotted in Figure 5c and, like O-H, it increases with pressure, but its value is smaller than that of WOH. The WOH/WOD ratio is 1.464 at ambient pressure and drops to a value of 1.394 at 25 GPa. The reason for this variation is not clear, but it seems to approach νOH/νOD with pressure.
Correlation field splitting in phase C
As mentioned above, phase B and phase C have a similar hydrogen bonding configuration (hydrogen bonded to a common oxygen) as phase A. Therefore, it is possible that correlation field splitting is also at work in those phases. Previous Raman spectroscopic studies of those phases at high pressure (Liu et al., 1998; Hofmeister et al., 1999; Liu et al., 2002) have shown that the two O-H stretching bands in phase B and phase C have nearly identical trends; about 60 cm−1 apart at 1 atm and tend to separate further with pressure. This difference between two O-H stretching frequencies is close to the observed difference in phase A at 18 GPa (about 55 cm−1). This can be interpreted as indicating that the O-H vibrational coupling between phases B and C is already strong at 1 atm.
To confirm this possibility, similar phonon calculations were performed for phase C at 1 atm, 10 and 20 GPa. Several space groups have been proposed for phase C in the past, and Poswal et al. (2010) performed DFT structure optimization under pressure on space group Pnnm. However, Xue et al. (2008) confirmed that the space group is Pnn2 from detailed 29Si and 1H NMR spectroscopy. Therefore, the crystal structure of phase C with Pnn2 was used for the calculation and has two hydrogen sites, H1 and H2 (Koch-Müller et al., 2005). Although there is only one H site when Pnnm is assumed, correlation field splitting is still found to occur, and two separated O-H bands are obtained. Therefore, the results discussed below actually do not depend much on the choice of the two space groups used. In other words, one cannot distinguish between these two space groups based on the OH stretching modes alone.
The mode analysis of phase C with Pnn2 resulted in the following vibration modes, excluding three translation modes: 49A1 + 50A2 + 54B1+ 54B2. All modes are Raman active, while IR active modes are 49A1 + 54B1+ 54B2. As in phase A, two O-H bands were observed (Liu et al., 2002), each band consisting of four modes (A1, A2, B1, and B2) for Raman and three modes (A1, B1, and B2) for IR spectra. The calculated O-H stretching frequencies are shown in Figure 6 and Table 3. The separation of the predicted vibrational frequencies (averaged over A1, A2, B1, and B2) at 1 atm was 90 cm−1 without deuterium dilution, somewhat larger than observed 60 cm−1 but it reduced to <1 cm−1 by deuterium dilution. Thus, the two O-H stretching modes of phase C observed at 1 atm are the result of correlated field splitting. As in phase A, the displacements of hydrogen atoms in O-H1 and O-H2 are in-phase for the high-frequency mode and opposite phase for the low-frequency mode.
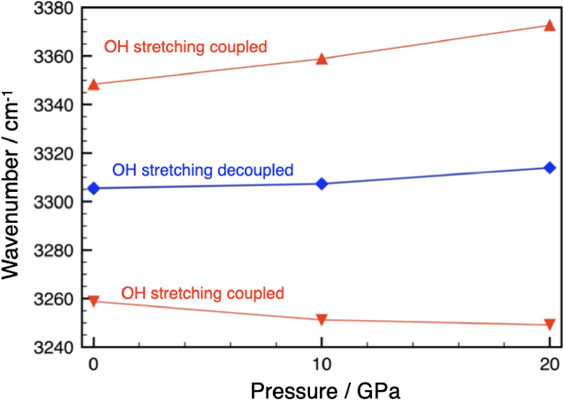
Figure 6. The calculated O-H stretching vibrational frequencies (wavenumber/cm−1) of phase C with and without vibrational coupling. Decoupled frequencies (blue) are very close and indistinguishable. The frequencies are averaged over A1, A2, B1, and B2 modes. The lines are guides for the eye.
Table 3. The calculated OH stretching vibrational frequencies (wavenumber/cm
−1) of phase C
| P/GPa |
O-H1 coupled |
O-H2 coupled |
O-H1 decoupled |
O-H2 decoupled |
| |
A1 |
B1 |
B2 |
A2 |
A1 |
B1 |
B2 |
A2 |
A1 |
B1 |
B2 |
A2 |
A1 |
B1 |
B2 |
A2 |
| 0 |
3253 |
3253 |
3263 |
3266 |
3337 |
3346 |
3351 |
3360 |
3301 |
3301 |
3304 |
3315 |
3304 |
3301 |
3302 |
3315 |
| 10 |
3244 |
3244 |
3257 |
3259 |
3362 |
3356 |
3345 |
3372 |
3306 |
3303 |
3302 |
3318 |
3306 |
3303 |
3303 |
3318 |
| 20 |
3241 |
3241 |
3256 |
3259 |
3377 |
3370 |
3356 |
3388 |
3313 |
3309 |
3307 |
3327 |
3312 |
3309 |
3308 |
3327 |
The splitting increases slightly with pressure due to increased vibrational coupling. This is in agreement with previous experimental high-pressure Raman studies of phase C (Hofmeister et al., 1999; Liu et al., 2002). Koch-Müller et al. (2005) reported a single broad Raman peak for the O-H stretching vibration in a deuterium-substituted sample of phase C at the ambient conditions. The authors interpreted this as indicative of a transition (see Xue et al. 2008 for discussion), but it is clear from the calculations here that isotope dilution eliminated the vibrational coupling and caused it to appear as a single band. Therefore, their result seems to experimentally confirm the present calculation that correlation field splitting is at work in phase C.
The difference in the behavior of phases A and C lies in the difference in the nature of O-H1 and O-H2. In phase C, O-H1, and O-H2 have almost the same O-H and hydrogen bonding distances, and therefore almost the same O-H frequencies. Thus, a strong correlation field splitting is expected. In phase A, on the other hand, O-H1 and O-H2 are very different from the beginning and behave differently under pressure, and the effect of correlation field splitting occurs only when the two frequencies approach each other due to structural changes caused by compression. Since similar O-H stretching vibration behavior as in phase C has been observed for phase B (Liu et al., 1998; Hofmeister et al., 1999), the two O-H stretching bands observed in phase B would also be the result of correlation field splitting.
Correlation of local structure and O-H vibrational frequencies
The frequencies affected by correlation field splitting are misleading when considering the relationship between hydrogen bonding and O-H stretching frequencies. In such cases, isotope-diluted results should be used (Novak, 1974). Using the present calculations, we examined correlations between O-H frequencies and local structure parameters related to hydrogen bonding in phase A. The pressure dependence of the O-H stretching frequency as a function of hydrogen bond distance is shown in Figure 7a. Using frequency affected by correlation field splitting in such a plot results in unnatural bending for O-H2 (not shown). Interestingly, O-H1 and O-H2 show quite different trends: for O-H2 there is a shift toward lower frequencies when the hydrogen bond distance is shortened by compression, which can be explained by the existing correlation between hydrogen bond distance and stretching frequency (e.g., Nakamoto et al., 1955; Novak, 1974). The slope is 628 cm−1/Å (by a linear fit), which is considerably lower than the slope of the correlation summarized by Novak (1974) of 1500 cm−1/Å for the hydrogen bonding distance range of 2.9 to 2.7 Å. In contrast, for O-H1, the vibrational frequencies are almost constant even when the hydrogen bonding distance is shortened, which deviates even more significantly from the existing correlation. For O-H1, as noted before, there is a tendency for the O-H1 distance to shorten slightly with pressure (Fig. 1a). Figure 7b shows the vibrational frequency as a function of O-H distance. It is well known that there is an inverse correlation between O-H distance and O-H stretching frequency (Novak, 1974). In this plot, O-H2 shows this correlation with a slope of −22765 cm−1/Å (by a linear fit), while the correlation reported by Novak (1974) is −11000 cm−1/Å, a twofold difference. Although the distributions of O-H1 and O-H2 overlap, O-H1 shows a trend that is independent of the O-H distance, which is very different from the existing correlation. The results for phase C are also plotted in Figure 7 (the differences between OH1 and OH2 are very close, so the average values are shown). The O-Hs in phase C share a common behavior with O-H1 of phase A. Thus, although the behavior of O-H1 in phase A is peculiar, the O-Hs in phase C also share a common behavior.
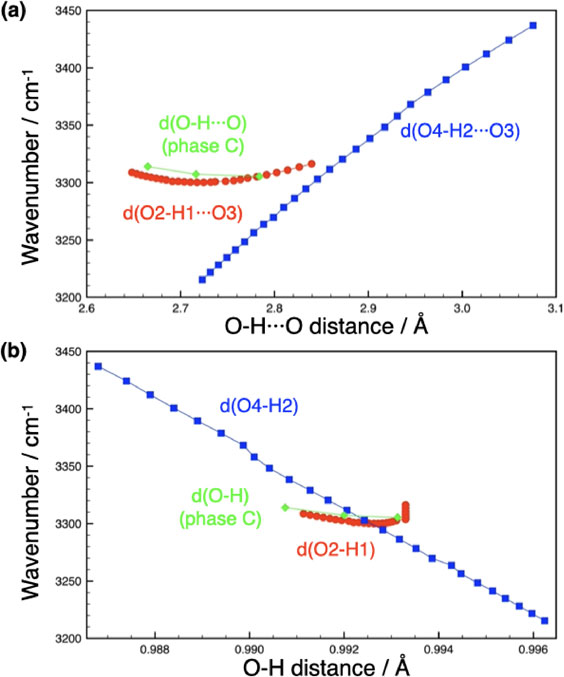
Figure 7. Simulated O-H stretching frequency versus hydrogen bonding parameters of phase A. Red and blue symbols show O-H1 and O-H2 parameters of phase A, respectively. Green symbols show parameters for phase C (averaged values). (a) O-H stretching frequency versus hydrogen bonding distance and (b) O-H stretching frequency versus O-H distance. Lines are guides for the eye.
One possible explanation for why the O-H1 frequency in phase A changes little with pressure is that the shift to lower frequencies due to the shortening of the hydrogen bond distance is counterbalanced by the lengthening of the O-H1 distance. However, the calculated slope is 12.5 times smaller than the expected when Novak’s frequency versus O-H distance slope and the calculated O-H distance change are applied. On the other hand, applying the slope of O-H2 (shown in Figs. 7a and 7b) instead, the slope is much closer to the expected slope, but still only about half. Of course, these two factors would not make independent contributions. Hofmeister et al. (1999) argued that the stretching frequencies depend not only on the hydrogen bond distance, but also on the hydrogen bond angle (∠O-H···O) in DHMS. Figure 1d shows that the O-H···O angle is smaller for H1 and decreases further with pressure, with the O-H1···O angle decreasing faster than the O-H2···O angle. On the other hand, Poswal et al. (2009) pointed out the importance of multiple central hydrogen bonds in phase A under pressure. It will be necessary to consider all these effects in the future to explain the peculiar behavior of O-H1 in phase A and O-H in phase C. Clearly, comparative studies with other DHMS are needed to further understand the O-Hs behavior in DHMS.
In summary, this study shows that the strange pressure dependence of the O-H stretching Raman bands in phase A observed by Liu et al. (1997) can be explained by the pressure-tuned correlation field splitting. We have also shown that correlated field splitting is important in phase C even at 1 atm. The same is expected for phase B, which has a similar structure. Correlated field splitting is easily overlooked by Raman and IR spectroscopy but can be revealed by detailed study using isotope dilution methods. It can also be resolved by vibrational calculations that mimic isotope dilution, as shown in this study.
