ORIGINAL ARTICLE
Asagiite, NiCu4(SO4)2(OH)6·6H2O, a new member of the ktenasite group from the Nakauri mine, Shinshiro City, Aichi Prefecture, Japan
2023 年 118 巻 1 号 論文ID: 230711

詳細
2023 年 118 巻 1 号 論文ID: 230711
Asagiite, a newly-discovered mineral having the ideal formula NiCu4(SO4)2(OH)6·6H2O, is a member of the ktenasite group, representing a Ni analogue. It occurs as a secondary mineral on smithsonite aggregates that overlie fractures in a serpentinite found in the Nakauri mine within Aichi Prefecture, Japan. Asagiite exhibits a unique pale blue-green coloration and so is named after the traditional Japanese color ‘asagi-iro’. Asagiite occurs as thin plate-like crystals with perfect cleavage along {001} planes. The crystal size of this mineral is typically 0.1-0.2 mm, although in rare cases crystals may range up to 0.5 mm in length. These crystals are vitreous, transparent and non-fluorescent and have also been shown to be brittle with a Mohs hardness of 2½. The measured and calculated densities of asagiite are 2.90(3) and 2.92 g·cm−3, respectively. This mineral is optically biaxial (−) with α = 1.577(2), β = 1.620(2), and γ = 1.631(2) together with a 2Vcalc value of 52.4°. Electron microprobe analyses determined an empirical formula (based on 2S) of (Cu3.44Ni0.76Zn0.59Co0.18Fe0.01)Σ4.98S2O7.95(OH)6.05·6H2O. Based on single crystal X-ray diffraction data, the structure is monoclinic with space group P21/c and unit cell parameters a = 5.6095(8), b = 6.1259(7), c = 23.758(3) Å, β = 95.288(4)°, V = 812.92(17) Å3, and Z = 2. Single-crystal structural determination also gives an R1 value of 0.0303. The seven most intense peaks in the powder X-ray diffraction pattern [d in Å (I/I0) hkl] were found to be 11.830 (100) 002, 5.912 (64) 004, 4.845 (55) 013, 3.920 (45) 006, 2.953 (33) 008, 2.668 (57) 202, and 2.571 (36) 123, with unit cell parameters of a = 5.614(5), b = 6.108(8), c = 23.758(18) Å, β = 95.62(7)°, and V = 810.8(14) Å3.
Ktenasite is a hydrous zinc-copper sulfate that was first described as having the composition (Cu,Zn)3SO4(OH)2·2H2O (Kokkoros, 1950) although the ideal formula (Cu,Zn)5(SO4)2(OH)6·6H2O was subsequently proposed by Raade et al. (1977). The latter formula was retained until 2019, at which time it was revised to ZnCu4(SO4)2(OH)6·6H2O after the approval of fehrite, the Mg analogue of ktenasite having the formula MgCu4(SO4)2(OH)6·6H2O (Miyawaki et al., 2019; Schlüter et al., 2021). Subsequently, the Co analogue of ktenasite, gobelinite, was approved with the formula CoCu4(SO4)2(OH)6·6H2O (Mills et al., 2020). Currently, only ktenasite, fehrite and gobelinite are members of the ktenasite group, although further additions can be expected in future. In particular, based on the results of previous studies (Mellini and Merlino, 1978; Mellini et al., 1981; Livingstone, 1991), an analogue in which Zn is dominant rather than Cu is probable. In addition, the gobelinite obtained from Cap Garonne, France, is rich in Ni (Sarp et al., 1990) and Mills et al. (2020) has reported that a possible Co-bearing Ni analogue is under investigation.
Ktenasite group compounds are known to occur as secondary minerals in many cases and, in Japan, ktenasite has been found in association with the decomposition of Zn- and Cu-bearing ores sourced solely from the Hirao mine near Osaka (Ohnishi et al., 2002). Even so, one of the authors (T.N.) previously collected ktenasite group minerals having a unique pale blue-green color from the Nakauri mine in Aichi Prefecture. The analysis of these specimens identified a new mineral comprising a Ni-dominant analogue within the ktenasite group. This new mineral has been named asagiite after the traditional Japanese term ‘asagi-iro’, corresponding to a unique pale blue-green color (Fig. 1). Both the mineral and its name have been approved by the International Mineralogical Association, Commission on New Minerals, Nomenclature and Classification (IMA no. 2022-065). A holotype specimen was deposited in the collections of the National Museum of Nature and Science, Japan, as specimen number NSM-M49723. A cotype specimen is housed in the collections of the Toyohashi Museum of Natural History, Japan, catalogue number TMNH-R5108. The present manuscript describes this new mineral.
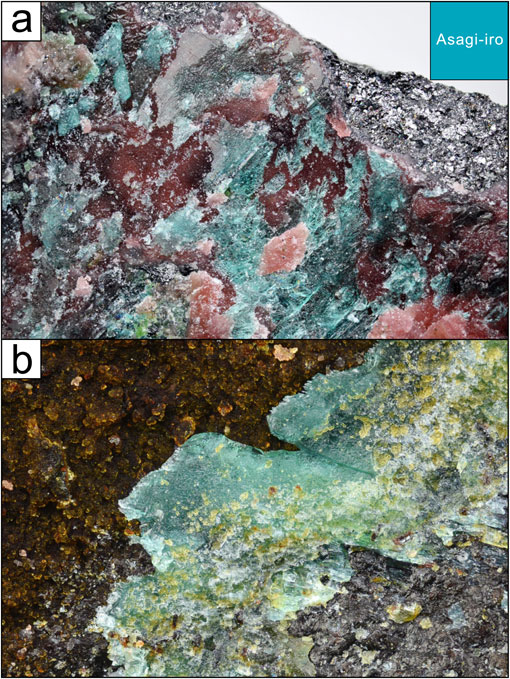
The Nakauri mine is located in Nakauri, Shinshiro City, Mikawa Province, Aichi Prefecture, Japan (34°51′05′′N137°32′09′′E). Nickel was mined in this area during World War II and exploratory drilling for copper was carried out for a period after the war at the Nakauri mine (Matsubara and Kato, 1979, 1993), although there is limited historical information regarding these activities. The ore deposit mined in this location originally developed in a serpentinite zone within the Mikabu belt. The ore that remains today consists primarily of magnetite and chalcocite or related Cu-S minerals, and small amounts of heazlewoodite and cobaltpentlandite are also occasionally found. Suzuki et al. (1976) previously reported the occurrence of the new mineral nakauriite in fractures within this ore. Later, Matsubara and Kato (1993) identified various secondary minerals in this region composed primarily of Ni, Cu, and Co, including gaspéite, glaukosphaerite and jamborite. In addition, the authors found a novel reddish smithsonite aggregate containing Co and Ni and occurring in a fissure-like area within the serpentinite. The occurrence of asagiite discussed in the present paper is limited to a small area located on a smithsonite aggregate (Fig. 1a). Crystals containing gobelinite also occur on thin smithsonite aggregate as well, but such crystals slightly different in color from asagiite of the type specimen (Fig. 1b).
Asagiite has been observed to occur only on top of smithsonite aggregates that overlie fractures in serpentinite (Fig. 1a). This mineral is found as thin plate-like crystals that are pale blue-green in color but with white streaks. All of the observed occurrence consists of flat plates with perfect cleavage along {001} plane. The crystals in the present specimen were determined to be typically 0.1-0.2 mm in size, although a very few crystals were as long as 0.5 mm. These crystals were also found to be vitreous, transparent and non-fluorescent. Additional analyses showed that asagiite is brittle with a hardness of 2½ on the Mohs scale. The density of this mineral as measured using a sodium polytungstate solution was 2.90(3) g·cm−3 while the density calculated based on the empirical formula and single crystal X-ray diffraction (XRD) data was 2.92 g·cm−3.
Asagiite is optically biaxial (−) with refractive indices of α = 1.577(2), β = 1.620(2), and γ = 1.631(2) under white light, with 2Vcalc = 52.4°. The dispersion produced by this mineral is weak and it exhibits pleochroism varying from colorless to pale green. Its Gladstone-Dale compatibility values (Mandarino, 1981) were found to be 0.000 and 0.007 (superior) using the measured and calculated densities, respectively.
Raman spectroscopic analysis of the mineral was performed using a confocal Raman micro-spectrometer (Nicolet Almega XR; Thermo Fisher Scientific, Yokohama, Japan). This instrument was equipped with a 532 nm Nd-YAG laser passing through a confocal microscope (Olympus BX51) with a 10× objective (Olympus MPlan-BD 10×, numerical aperture = 0.25). The laser power at the sample surface was approximately 10 mW. The Raman spectrum obtained from the asagiite is shown in Figure 2. Based on assignments previously reported by Frost et al. (2004), the peaks from 3000 to 3600 cm−1 are attributed to O-H stretching vibrations associated with H2O and OH groups in the material. Hydrous minerals often generate a peak related to an H-O-H bending vibration in the vicinity of 1600 cm−1 but this peak has not yet been reported to appear in the spectra of minerals in the ktenasite series (e.g., Frost et al., 2004; Schlüter et al., 2021). The present asagiite also did not produce a clear peak at this wavelength. SO4 stretching vibrations are known to appear in the range from 900 to 1200 cm−1, and the peaks in the low-wavenumber region of the present spectrum are attributed to bending vibrations of polyhedra and sulfate.

Chemical analyses of the asagiite specimen were carried out using a JEOL JXA-8105 electron microprobe operating in WDS mode (15 kV, 2 nA, and 5 µm beam diameter). The ZAF method was used for data correction. During these analyses, Ni, Zn, Co, Fe, and Cu were used for calibration purposes for each of these metals while a ZnS standard was employed for S. Although insufficient material was available for direct determination, the Raman spectra acquired from the specimen indicated the presence of OH groups and H2O in the structure, and so the weight percent H2O was calculated based on the stoichiometry. The slightly high analytical total obtained from this analysis was likely due to the loss of H2O from the sample while it was held under vacuum in the microprobe chamber. The analytical data obtained from these trials are summarized in Table 1. The empirical formula (based on 2S apfu) was determined to be (Cu3.44Ni0.76Zn0.59Co0.18Fe0.01)Σ4.98S2O7.95(OH)6.05·6H2O for type specimen. The simplified formula was found to be (Ni,Co)(Cu,Zn)4(SO4)2(OH)6·6H2O, while an ideal formula of NiCu4(SO4)2(OH)6·6H2O was obtained. The latter is equivalent to NiO 10.44, CuO 44.49, SO3 22.39, H2O 22.67, and total 100 wt%.
| Type specimen (asagiite) | Gobelinite-asagiite specimen | |||||
| wt% (n = 6) | Gobelinite | Asagiite | ||||
| Avg. | Min. | Max | wt% | wt% | ||
| CuO | 38.90 | 37.08 | 39.78 | CuO | 40.16 | 42.27 |
| NiO | 8.11 | 7.60 | 8.47 | NiO | 5.31 | 5.09 |
| ZnO | 6.80 | 6.12 | 7.42 | ZnO | 3.37 | 2.39 |
| CoO | 1.90 | 1.71 | 2.12 | CoO | 5.69 | 4.27 |
| FeO | 0.10 | 0.06 | 0.13 | FeO | 0.72 | 1.77 |
| SO3 | 22.79 | 22.50 | 23.18 | SO3 | 23.30 | 23.29 |
| H2O* | 23.15 | H2O* | 24.03 | 23.89 | ||
| Total | 101.75 | Total | 102.58 | 102.97 | ||
| apfu | apfu | apfu | ||||
| Cu | 3.44 | Cu | 3.47 | 3.65 | ||
| Ni | 0.76 | Ni | 0.49 | 0.47 | ||
| Zn | 0.59 | Zn | 0.28 | 0.20 | ||
| Co | 0.18 | Co | 0.52 | 0.39 | ||
| Fe | 0.01 | Fe | 0.07 | 0.17 | ||
| Σ | 4.98 | Σ | 4.83 | 4.88 | ||
| S = | 2 | S = | 2 | 2 | ||
| O | 7.95 | O | 7.66 | 7.77 | ||
| OH | 6.05 | OH | 6.34 | 6.23 | ||
| H2O = | 6 | H2O = | 6 | 6 | ||
* Calculated value from stoichiometry.
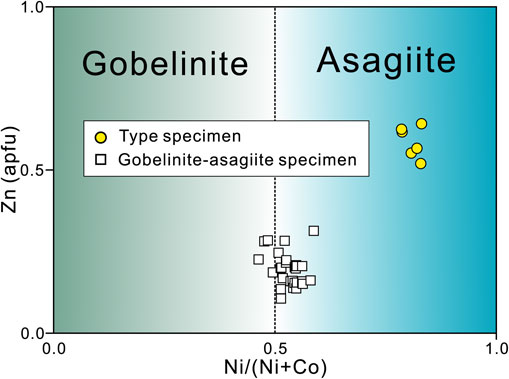
The chemical analyses of gobelinite-asagiite specimen in Figure 1b were also conducted, and representative compositions are summarized in Table 1. The compositions lie on the boundary between gobelinite and asagiite (Fig. 3). The representative composition of gobelinite and asagiite are (Cu3.47Co0.52Ni0.49Zn0.28Fe0.07)Σ4.83S2O7.66(OH)6.34·6H2O and (Cu3.65Ni0.47Co0.39Zn0.20Fe0.17)Σ4.86S2O7.77(OH)6.23·6H2O, respectively.
Single-crystal XRD experiments were performed using a Rigaku R-AXIS RAPID single-crystal diffractometer equipped with a curved imaging plate and employing monochromatized MoKα radiation (50 kV and 40 mA). The Rigaku RAPID AUTO software package was used to process the diffraction data, including the application of a numerical absorption correction. The crystal structure was solved by the direct method and refined by the full-matrix least squares technique using the Jana2006 program (Petříček et al., 2014), and SHELXL2017/1 program (Sheldrick, 2015) was also used for the extinction correction. The structural model obtained was in agreement with that of the ktenasite group minerals (Mellini and Merlino, 1978; Mills et al., 2020; Schlüter et al., 2021), although the H positions could not be determined by difference Fourier analysis due to imperfections of the crystals. Therefore, based on the results of previous studies and the bond valence analysis, the O2 to O4 sites and the O8 to O10 sites are assigned as OH and H2O, respectively. Because this mineral consisted of atoms having similar X-ray scattering factors, an analysis was performed using the end-member composition and this process resulted in R1 = 0.0303 and wR2 = 0.0349 based on 1847 reflections. Details of the data collection procedure are provided in Table 2 and Supplementary CIF file (Supplementary CIF file is available online from https://doi.org/10.2465/jmps.230711). The final atom coordinates and equivalent isotropic atomic displacement parameters are summarized in Table 3, while the bond distanced and balance sums are presented in Tables 4 and 5, respectively. The refined unit cell parameters were a = 5.6095(8), b = 6.1259(7), c = 23.758(3) Å, β = 95.288(4)°, V = 812.92(17) Å3, and Z = 2 in conjunction with the monoclinic P21/c (#14) space group.
| Chemical formula | NiCu4S2O20 |
| Temperature (K) | 293 |
| Radiation | MoKα |
| Crystal size (mm) | 0.25 × 0.10 × 0.06 |
| Space group | P21/c |
| a, b, c (Å) | 5.6095(8), 6.1259(7), 23.758(3) |
| β (°) | 95.288(4) |
| V (Å3) | 812.92(17) |
| Z | 2 |
| F(000) | 672 |
| Absorption coefficient µ (mm−1) | 6.64 |
| Diffractometer | R-AXIS RAPID |
| Voltage (kV), Current (mA) | 50, 40 |
| θmax (°) | 27.45 |
| No. of measured, independent and observed [I > 3σ(I)] reflections |
7283, 1847, 878 |
| R[F2 > 2σ(F2)], wR(F2), S | 0.0303, 0.0349, 0.78 |
| Δρmax (eÅ−3) | 0.82 (0.72 Å from the O3 site) |
| Δρmin (eÅ−3) | −0.89 (1.03 Å from the Ni1 site) |
| x | y | z | Ueq | |||
| Ni1 | 1 | 0.5 | 0.5 | 0.0159(3) | ||
| Cu1 | 0.00859(5) | 0.59959(9) | 0.25103(2) | 0.01385(19) | ||
| Cu2 | 0.50087(5) | 0.34907(9) | 0.25263(2) | 0.0141(2) | ||
| S1 | 0.63680(13) | 0.5578(2) | 0.12570(6) | 0.0170(4) | ||
| O1 | 0.6661(4) | 0.5939(5) | 0.18759(15) | 0.0179(11) | ||
| O2 | 0.6034(3) | 0.1033(5) | 0.20896(14) | 0.0162(11) | ||
| O3 | 0.8416(3) | 0.3528(5) | 0.28918(14) | 0.0166(11) | ||
| O4 | 0.1631(3) | 0.3450(5) | 0.21437(14) | 0.0161(11) | ||
| O5 | 0.8704(4) | 0.4919(6) | 0.10747(15) | 0.0285(13) | ||
| O6 | 0.5535(4) | 0.7605(6) | 0.09706(15) | 0.0277(13) | ||
| O7 | 0.4594(4) | 0.3828(5) | 0.11269(15) | 0.0271(13) | ||
| O8 | 1.0840(4) | 0.5604(6) | 0.41762(14) | 0.0252(12) | ||
| O9 | 0.6742(4) | 0.6599(5) | 0.48184(15) | 0.0250(12) | ||
| O10 | 0.8591(4) | 0.2034(6) | 0.47187(14) | 0.0238(12) | ||
| U11 | U22 | U33 | U12 | U13 | U23 | |
| Ni1 | 0.0139(3) | 0.0176(6) | 0.0163(6) | −0.0006(3) | 0.0021(3) | 0.0009(5) |
| Cu1 | 0.00921(18) | 0.0101(4) | 0.0227(4) | 0.00027(16) | 0.00373(19) | −0.0002(3) |
| Cu2 | 0.00894(18) | 0.0108(4) | 0.0233(4) | 0.00114(18) | 0.00478 (19) | 0.0000(3) |
| S1 | 0.0162(3) | 0.0193(8) | 0.0159(8) | −0.0015(4) | 0.0027(4) | 0.0021(7) |
| O1 | 0.0221(11) | 0.019(2) | 0.013(2) | 0.0024(11) | 0.0047(12) | −0.0024(19) |
| O2 | 0.0164(10) | 0.013(2) | 0.021(2) | 0.0011(10) | 0.0131(12) | −0.0038(19) |
| O3 | 0.0111(9) | 0.017(2) | 0.022(2) | 0.0003(10) | 0.0030(11) | 0.001(2) |
| O4 | 0.0135(10) | 0.0104(19) | 0.025(2) | 0.0001(10) | 0.0021(11) | 0.000 (2) |
| O5 | 0.0251(11) | 0.037(3) | 0.026(3) | 0.0041(13) | 0.0141(12) | −0.002(2) |
| O6 | 0.0254(11) | 0.028(3) | 0.028(3) | −0.0034(13) | −0.0053(13) | 0.020(2) |
| O7 | 0.0329(13) | 0.027(3) | 0.021(2) | −0.0150(13) | −0.0026(14) | −0.002(2) |
| O8 | 0.0299(12) | 0.032(3) | 0.015(2) | 0.0024(12) | 0.0078(13) | −0.002(2) |
| O9 | 0.0216(11) | 0.029(2) | 0.024(3) | 0.0053(12) | 0.0021(12) | −0.002(2) |
| O10 | 0.0259(11) | 0.022(2) | 0.023(3) | −0.0047(12) | 0.0016(13) | −0.001(2) |
| Ni1-O8 | 2.088(4) (×2) | Cu1-O1 | 2.330(3) |
| Ni1-O9 | 2.083(3) (×2) | Cu1-O2 | 2.293(2) |
| Ni1-O10 | 2.068(4) (×2) | Cu1-O3 | 2.035(3) |
| <Ni1-O> | 2.080 | Cu1-O3′ | 2.043(4) |
| Cu1-O4 | 2.002(3) | ||
| S1-O1 | 1.481(4) | Cu1-O4′ | 2.020(3) |
| S1-O5 | 1.474(3) | <Cu1-O> | 2.121 |
| S1-O6 | 1.471(4) | ||
| S1-O7 | 1.476(3) | Cu2-O1 | 2.363(4) |
| <S1-O> | 1.476 | Cu2-O1′ | 2.400(4) |
| Cu2-O2 | 1.923(4) | ||
| Cu2-O2′ | 1.945(4) | ||
| Cu2-O3 | 2.025(2) | ||
| Cu2-O4 | 2.025(2) | ||
| <Cu2-O> | 2.114 |
| Ni | Cu1 | Cu2 | S | BVS | Assignment | |
| O1 | 0.18 | 0.15, 0.16 | 1.51 | 2.00 | O | |
| O2 | 0.19 | 0.50, 0.53 | 1.22 | OH | ||
| O3 | 0.38, 0.39 | 0.40 | 1.17 | OH | ||
| O4 | 0.40, 0.42 | 0.40 | 1.22 | OH | ||
| O5 | 1.54 | 1.54 | O | |||
| O6 | 1.55 | 1.55 | O | |||
| O7 | 1.53 | 1.53 | O | |||
| O8 | 0.34×2↓ | 0.34 | H2O | |||
| O9 | 0.34×2↓ | 0.34 | H2O | |||
| O10 | 0.36×2↓ | 0.36 | H2O | |||
| BVS | 2.08 | 1.96 | 2.14 | 6.13 |
Angle-dispersive powder XRD analyses were conducted at room temperature using MoKα (50 kV and 54 mA) radiation from a Rigaku rotating anode generator equipped with a 100 µm collimator in conjunction with Debye-Scherrer geometry, recording on an imaging plate. The resulting data are provided in Table 6. The seven most intense lines in the asagiite powder XRD pattern [d in Å(I/I0) hkl] were 11.830 (100) 002, 5.912 (64) 004, 4.845 (55) 013, 3.920 (45) 006, 2.953 (33) 008, 2.668 (57) 202, and 2.571 (36) 123. The refined unit-cell parameters were a = 5.614(5), b = 6.108(8), c = 23.758(18) Å, β = 95.62(7)°, V = 810.8(14) Å3, and Z = 2.
| Iobs. | dobs. (Å) | dcalc. (Å) | hkl |
| 100 | 11.830 | 11.822 | 002 |
| 64 | 5.912 | 5.911 | 004 |
| 55 | 4.845 | 4.828 | 013 |
| 17 | 4.239 | 4.275 | 104 |
| 26 | 4.110 | 4.112 | 111 |
| 45 | 3.920 | 3.941 | 006 |
| 14 | 3.744 | 3.739 | 015 |
| 11 | 3.373 | 3.380 | 106 |
| 33 | 2.953 | 2.955 | 008 |
| 29 | 2.782 | 2.793 | 200 |
| 57 | 2.668 | 2.661 | 202 |
| 36 | 2.571 | 2.574 | 123 |
| 16 | 2.431 | 2.435 | 204 |
| 21 | 2.381 | 2.380 | 125 |
| 7 | 2.291 | 2.286 | 125 |
| 22 | 2.182 | 2.180 | 206 |
| 33 | 2.142 | 2.149 | 127 |
| 4 | 2.056 | 2.053 | 127 |
| 25 | 1.936 | 1.938 | 208 |
| 10 | 1.743 | 1.743 | 0,1,13 |
| 13 | 1.716 | 1.717 | 1,2,11 |
| 10 | 1.692 | 1.690 | 2,0,12 |
| 20 | 1.585 | 1.585 | 323 |
The periodicity and intergrowth characteristics of this mineral were also assessed using transmission electron microscopy (JEOL JEM-2100, operating at 200 kV) based on the analysis of a powder sample. Figure 4 shows selected area electron diffraction patterns obtained along the [100], [010], and [001] directions. Although 010 and 001 reflections appeared due to multiple reflections, no streaks were observed in any direction.
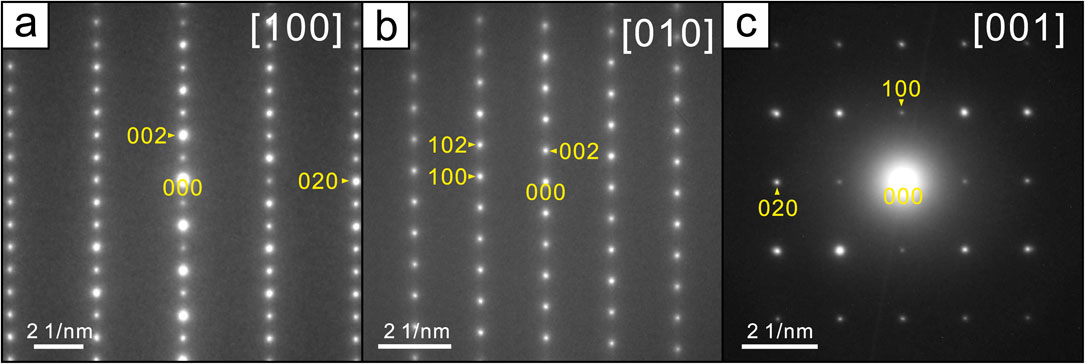
Figure 5 provides the crystal structure of asagiite. The atomic arrangement in this structure is composed of CuO(OH)5 and CuO2(OH)4 octahedra with a Jahn-Teller distortion (4+2 coordination) that undergo edge-sharing to form brucite-like sheets. Each of the former octahedra (having a central Cu1 cation) only shares the oxygen in one corner of such a tetrahedron while the opposite corner is occupied by an OH group. The latter (having a central Cu2 cation) shares the oxygen at its apex with two sulfate tetrahedra on either side of the sheet. The sheets are linked solely by hydrogen bonds associated with water molecules coordinated with the Nil sites and OH groups coordinated to the Cu1 and Cu2 sites. The free oxygen ligands of each sulfate tetrahedron act as acceptor atoms for hydrogen bonding with the water ligands of the Ni(H2O)6 octahedra. This crystal structure is very similar to that of christelite, Zn3Cu2(SO4)2(OH)6·4H2O (Adiwidjaja et al., 1996), and that of an intergrowth found in fehrite, one of the ktenasite group minerals (Schlüter et al., 2021). However, it should be noted that neither intergrowth nor stacking defects were observed in the present asagiite specimen (Fig. 4).
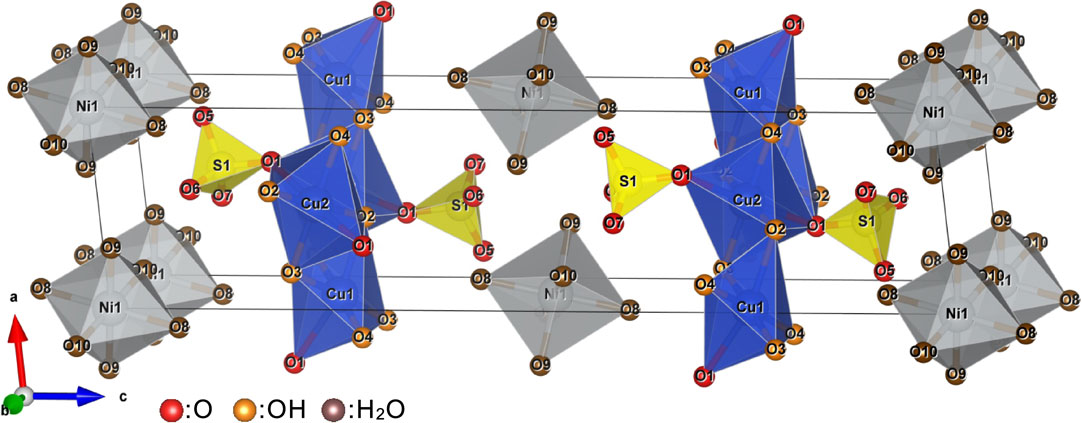
Asagiite is the M = Ni analogue in the ktenasite group minerals, each having the composition MCu4(SO4)2(OH)6·6H2O. The members of this group, comprising ktenasite (M = Zn), fehrite (M = Mg) and gobelinite (M = Co), are summarized in Table 7 (Kokkoros, 1950; Mills et al., 2020; Schlüter et al., 2021). Each of these has a blue to greenish coloration with a vitreous luster, and are optically biaxial (−) with a very narrow range of refractive indices (although optical data are not yet available for fehrite). These minerals all have the same symmetry, each with the P21/c space group. This group can evidently accommodate various sizes of M cations, ranging from smaller Ni ions to larger Co ions. However, there are no apparent correlations between the dominant M cation and the lattice parameters or M-O distances. The M-centered octahedra in the structures of these minerals each have large bond lengths due to their connections to H2O molecules, and are independent of other polyhedra, except that the oxygen atoms contained in sulfur-centered tetrahedra act as hydrogen acceptors (Fig. 5). Thus, changing the M cation is unlikely to significantly affect the size of the octahedron. Consequently, the crystal structure has no preference for a particular M cation, suggesting the potential to form a wide range of solid solutions. As an example, fehrite contains Mg, Zn, and Mn (Schlüter et al., 2021) while asagiite and gobelinite (Mills et al., 2020) contain Ni, Co, and Zn. Ohnishi et al. (2002) reported the discovery of ktenasite having small amounts of Co, Pb, and Ni. Even so, the actual solid solution that is formed in a given environment is likely to be determined by the elements available in that location. The asagiite found in the Nakauri mine occurred on smithsonite in fractures within a serpentinite zone that also contained heazlewoodite, cobaltpentlandite, and chalcocite (that is, related Cu-S minerals). The local aqueous solutions resulting from the weathering of the serpentinite in this location were likely rich in Zn. The formation of smithsonite prior to the appearance of the asagiite would have consumed Zn while the remaining atoms were incorporated into asagiite and gobelinite. Asagiite in the type specimen contained elevated proportions of Ni and Zn but a low Co content (Table 1 and Fig. 3). On the other hand, the compositions of the gobelinite-asagiite specimen are rich in Co and Ni and poor in Zn (Table 1 and Fig. 3). The wide range of Ni, Co, and Zn concentrations in the ktenasite group minerals found at the Nakauri mine site can likely be attributed to the varying mineral compositions that happened to be left behind in each fracture, as there is a common forming environment in this location.
| Name | Asagiite | Fehrite | Ktenasite | Gobelinite |
| Composition (M) | Ni | Mg | Zn | Co |
| Ionic radius* of M (Å) | 0.69 | 0.72 | 0.74 | 0.745 |
| Colour | Pale blue-green | Turquoise | Emerald green to bluish green |
Pale green, bluish green, greyish green |
| Luster | Vitreous | Vitreous, pearly | Vitreous | Vitreous |
| Hardness (Mohs) | 2½ | - | 2-2½ | 2½ |
| Optical data | Biaxial (−) | - | Biaxial (−) | Biaxial (−) |
| α | 1.577 | - | 1.574 | 1.576 |
| β | 1.620 | - | 1.615 | 1.617 |
| γ | 1.631 | - | 1.628 | 1.63 |
| 2Vmeas. (°) | - | - | 59 | 58 |
| 2Vcalc. (°) | 52.4 | - | 58 | 57.5 |
| Space group | P21/c | P21/c | P21/c | P21/c |
| a (Å) | 5.6095 | 5.6062 | 5.589 | 5.611 |
| b (Å) | 6.1259 | 6.1294 | 6.166 | 6.103 |
| c (Å) | 23.758 | 23.834 | 23.751 | 23.808 |
| β (°) | 95.288 | 95.29 | 95.55 | 95.18 |
| V (Å3) | 812.92 | 815.5 | 814.7 | 811.9 |
| <M-O> (Å) | 2.080 | 2.077 | 2.081 | 2.082 |
| <Cu1-O> (Å) | 2.121 | 2.115 | 2.120 | 2.112 |
| <Cu2-O> (Å) | 2.114 | 2.111 | 2.116 | 2.106 |
| <S-O> (Å) | 1.476 | 1.477 | 1.468 | 1.474 |
| Reference | 1 | 5 | 2-4 | 6 |
* as a six-coordinate (Shannon, 1976).
1, this study; 2, Raade et al. (1977); 3, Mellini and Merlino (1978); 4, Kokkoros (1950); 5, Schlüter et al. (2021); 6, Mills et al. (2020).
Raman spectroscopic analyses was conducted at the Petrology and Mineralogy Laboratory within Nagoya University. Chemical analyses were performed by the Department of Geology and Mineralogy, Kyoto University. Single crystal and powder XRD data were acquired at the Institute for Solid State Physics, University of Tokyo. The authors wish to express their sincere gratitude to Dr. Yui Kouketsu and Dr. Hirotada Gotou for providing invaluable assistance throughout these analyses.
Supplementary CIF file is available online from https://doi.org/10.2465/jmps.230711.