ORIGINAL ARTICLE
Multiple post-peak metamorphic fluid infiltrations in southern Perlebandet, Sør Rondane Mountains, East Antarctica
2023 年 118 巻 ANTARCTICA 号 論文ID: 230131a

詳細
2023 年 118 巻 ANTARCTICA 号 論文ID: 230131a
This paper reports multiple fluid infiltration events during retrograde metamorphism in the Sør Rondane Mountains, East Antarctica. Pelitic gneisses from southern part of Perlebandet have cordierite-biotite intergrowth rimming garnet, implying that garnet breakdown occurred by fluid infiltration. Using the Raman peak of CO2 in cordierite and Cl-bearing composition in biotite, this study revealed that the cordierite-biotite intergrowth was formed in equilibrium with one-phase CO2-Cl-H2O fluid. The intergrowth texture is cut by thin selvages composed of Cl-bearing biotite, suggesting Cl-bearing fluid infiltration. Since andalusite is exclusively observed in the selvage, near isobaric cooling path is presumed for the pressure-temperature (P-T) path of these post-peak fluid-related reactions. The inconsistence with counter-clockwise P-T path reported from northern Perlebandet is probably due to the granodiorite/leucocratic granite bodies beneath the studied metamorphic rocks. In order to understand the tectonic evolution at the final stage of Gondwana amalgamation, therefore, effect of hidden igneous rocks needs to be taken into consideration.
Low water activity fluids have been recognized as the important fluid species present in the crust (e.g., Touret and Huizenga, 2011). The NaCl-CO2-H2O system is often assumed as fluid composition in the crust (e.g., Liebscher and Heinrich, 2007). Whether the fluid can immiscibly coexist with CO2-bearing fluids or not depends on NaCl concentration of the fluid (Heinrich, 2007). From the petrochronological point of view, mineral compositions have an advantage to understand pressure-temperature-time-fluid (P-T-t-fluid) evolution compared with fluid inclusion study. Chlorine can substitute with hydroxyl ions in hydrous minerals such as biotite, hornblende, and apatite, when they coexist with Cl-bearing fluids (e.g., Munoz and Swenson, 1981; Kullerud, 1995). Chlorine partitioning between fluid and these minerals is assessed using experimentally determined partition coefficients between them and the fluid composition is estimated using f(H2O)/f(HCl) ratio calculated by the compositions of biotite or apatite (e.g., Zhu and Sverjensky, 1991, 1992; Munoz, 1992; Mathez and Webster, 2005; Chevychelov et al., 2008). Carbonates are also used as an indicator of CO2 fluids (e.g., Carvalho et al., 2019). In addition, cordierite entraps molecular CO2 and H2O in the channel-cavities, reflecting the coexisting fluid and/or melt compositions (e.g., Vry et al., 1990; Harley et al., 2002). Therefore, these minerals are the key to understand P-T-t-fluid evolution, especially when their microstructures are taken into consideration.
The Sør Rondane Mountains (SRM), East Antarctica are located at the key area to understand the Gondwana amalgamation (e.g., Satish-Kumar et al., 2013). Although the long-lived magmatic and metamorphic histories are suggested (e.g., Elburg et al., 2016), studies on the P-T-t-fluid evolution of metamorphic rocks are still limited (e.g., Higashino et al., 2013, 2015; Kawakami et al., 2017; Higashino et al., 2019a, 2019b). The field distribution of Cl-rich minerals and their formation mechanisms have been studied in the SRM (e.g., Kawakami et al., 2017; Uno et al., 2017; Higashino et al., 2019a, 2019b). The Cl-bearing fluid activity is recognized during prograde to post-peak metamorphisms (Higashino et al., 2013, 2019a; Kawakami et al., 2017). In contrast, CO2-bearing fluid is not reported in the SRM so far.
This study deals with pelitic gneisses and granodiorite collected from southern part of nunataks in Perlebandet in order to examine the P-T-fluid path of metamorphic rocks, considering possibility of coexistence of Cl-bearing fluid with CO2-bearing fluid. Mineral abbreviations are after Warr (2021).
The SRM (22°-28°E, 71.5°-72.5°S) located in eastern Dronning Maud Land are mainly dominated by granulite facies gneisses and granitoids (Fig. 1a; Shiraishi et al., 1991; Asami et al., 1992). They are thought to be a part of the collision zone between East and West Gondwana during the East African-Antarctic Orogeny (Jacobs et al., 2003; Jacobs and Thomas, 2004), or a part of the hanging wall of a top-to-the-southwest mega-nappe complex involving collision between Northern and Southern Gondwana (Grantham et al., 2008, 2013) during the Kuunga Orogeny following the East African Orogeny (Meert, 2003).

The SRM are divided into the NE-terrane and the SW-terrane by a mylonite zone termed the Main Tectonic Boundary (MTB) that dips gently to the north and the northeast (Osanai et al., 2013). The NE-terrane rocks record clockwise P-T paths, with some inherited zircon ages >1200 Ma, whereas the SW-terrane rocks record counter-clockwise P-T paths, with inherited zircon ages <1200 Ma (Osanai et al., 2013). Osanai et al. (2013) and Kitano et al. (2016) consider that the depositional tectonic setting and source rocks of the NE- and SW-terranes are different. Coincidence of the timing of decompression in the NE-terrane and compression in the SW-terrane both at ∼ 650-600 Ma and retrograde greenschist-facies metamorphism in both terranes at ∼ 590-520 Ma led Osanai et al. (2013) to propose the tectonic model in which the NE-terrane overthrusts onto the SW-terrane at ∼ 650-600 Ma. Although Osanai et al. (2013) proposed the MTB formation at ∼ 650-600 Ma, various P-T-t paths and geochronological data recently reported from the entire SRM suggest that the tectonic model for the SRM formation needs to be re-evaluated (e.g., Kawakami et al., 2017; Tsubokawa et al., 2017; Ruppel et al., 2021; Hokada et al., 2022; Higashino et al., 2023).
Perlebandet is one of the westernmost nunataks in the SRM, where layered high-grade metamorphic rocks are exposed (Fig. 1b). The main lithologies observed in Perlebandet are Bt-Hbl gneiss, Grt-Hbl gneiss, Sil-Grt-Bt gneiss, pyroxene granulite, marble and skarns, Opx-bearing amphibolite, and granite (Fig. 1b; Shiraishi et al., 1992). Although granite is mapped only in southernmost part of Perlebandet (Fig. 1b), granodioritic bodies are widely distributed beneath the metamorphic rocks as well (Fig. 2a). The gray granodioritic layer just above the marble intrudes discordantly to the gneissose structure of the overlying metamorphic rocks (Fig. 2a). Leucocratic granite layer is developed between metamorphic rocks and the gray granodioritic rocks. On the other hand, a massive Hbl-Bt granodiorite from which sample TK2019123001I (01I) was taken intrudes subparallel to the fabrics of overlying metamorphic rocks (Fig. 2b). Leucocratic granite layers are developed at the lower and upper intrusion boundaries and mingling texture between the leucocratic granite and dark-colored massive Hbl-Bt granodiorite is observed (Fig. 2c). Perlebandet is a key area to constrain the location of the MTB, and has been considered to belong to the NE-terrane (Osanai et al., 2013) in the lack of detailed information of P-T path of this area. However, Perlebandet is interpreted to be part of the SW-terrane on the basis of magnetic surveys (Mieth et al., 2014). The counter-clockwise P-T path based on petrochronological constraint from northern Perlebandet by Kawakami et al. (2017) supports this interpretation. Kawakami et al. (2017) reports the peak P-T conditions of ∼ 770-840 °C, 0.8-1.0 GPa, followed by garnet breakdown near the P-T conditions of the Al2SiO5 triple point. Otsuji et al. (2013) reports low Sr isotope ratio from Perlebandet metacarbonates, possibly resulting from low Sr-bearing magmatic fluids or from the older depositional age of Perlebandet metacarbonates compared to that from other parts of the SRM. Based on Nd and Sr isotopic data, Perlebandet carbonates are proposed to have deposited in an environment surrounding an isolated seamount in the Tonian to Cryogenian period, and suggest that amalgamation of Gondwana and the final closure of Mozambique Ocean and East Antarctic Ocean took place at ∼ 660-550 Ma (Otsuji et al., 2016). So far, all previous studies in Perlebandet reporting the P-T conditions, zircon U-Pb ages, CHIME monazite ages, and any isotope data dealt with samples collected from northern and central parts of Perlebandet (Asami et al., 2005; Shiraishi et al., 2008; Otsuji et al., 2013, 2016; Kawakami et al., 2017).

Quantitative analysis of minerals and X-ray elemental mapping were performed using a JEOL 8105 superprobe. Quantitative analytical conditions were 15.0 kV accelerating voltage, 10 nA probe current, and 3 µm spot size. The counting time for the peak and backgrounds were 30 and 15 s for Cl, 60 and 30 s for F, and 10 and 5 s for other elements, respectively. Natural and synthetic minerals were used as standards and a ZAF correction method was applied. Analytical conditions for the X-ray elemental mapping were 15.0 kV accelerating voltage, 300 nA probe current, focused to 5 µm beam diameter, and dwell time of 10-60 ms. Recalculation of ferric iron in amphibole and calculation of amphibole formula are based on Holland and Blundy (1994).
Cordierite and Al2SiO5 minerals were analyzed by a laser Raman spectrophotometer (JASCO, NRS-3100), using a diode-pumped solid-state (DPSS) laser emitting at 532 nm with gratings of 1800 lines/mm. Calibration was performed using 520 cm−1 Si wafer band and Ne spectrum. The Raman spectra were acquired with a 100× objective in the wave number range 600-3800 cm−1, integrating 2 repetitions of 30 s.
All of the above analyses were done at Department of Geology and Mineralogy, Graduate School of Science, Kyoto University, Japan.
The studied samples are collected from southern Perlebandet during the summer season of the 61st Japanese Antarctic Research Expedition (JARE61) (Fig. 1; Kawakami et al., 2020). Samples FH2019123001O (01O), FH2019123001Q (01Q), and FH2019123001R (01R) are metamorphic rocks collected from the same layered outcrop, whereas sample 01I is a massive Hbl-Bt granodiorite showing mingling texture with leucocratic granite at the margin of the body (Fig. 2). Boundary between outcrop of the massive granodiorite and metamorphic rocks is covered by a scree (Figs. 2a and 2b). Sample 01I is ∼ 80 m away from samples 01O, 01Q, and 01R (Figs. 2a and 2b). Samples 01Q and 01R are distant for about 10 cm and have thin black selvages cutting the gneissose structure (Fig. 2e). In contrast, sample 01O corresponds to the wall rock without the selvage (Fig. 2d). It is noted that unmapped granodioritic body underlies these samples (Fig. 2a).
Sample 01OThis is a Sil-Bt-Grt gneiss, mainly composed of garnet, biotite, sillimanite, K-feldspar (with or without perthitic texture), plagioclase and quartz with minor amount of cordierite, apatite, zircon, monazite, rutile, and spinel.
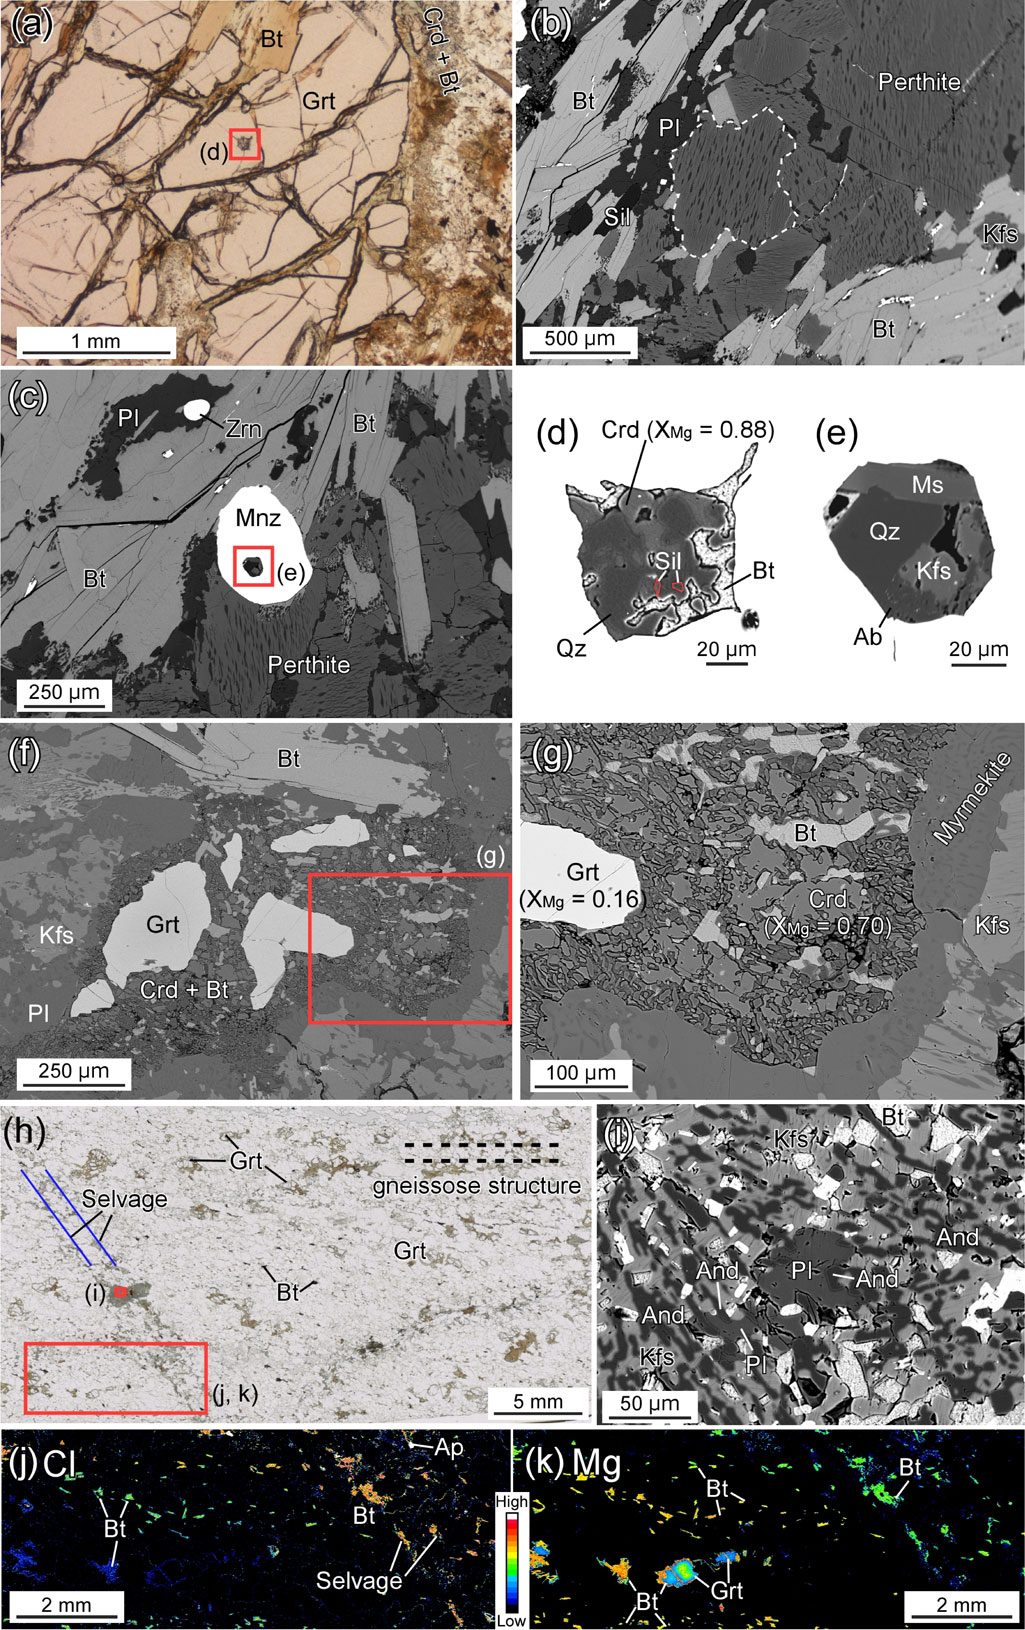
Garnet is up to ∼ 2 cm in diameter, including sillimanite, biotite and quartz as single phases. Garnet shows rimward decrease of Mg, Ca, and XMg, and rimward increase of Fe and Mn (Alm59-78Prp16-36Sps1-4Grs2-4; XMg = 0.17-0.36). Sharp core/rim boundary in major and trace elements was not recognized by X-ray elemental mapping. Garnet is commonly rimmed by cordierite-biotite intergrowth at the margin (Fig. 3a). Nanogranitoid inclusion is included in garnet core and monazite (Figs. 3d and 3e). The nanogranitoid inclusion in garnet is characterized by decrepitated texture and consists of Bt + Crd + Sil + Qz (Figs. 3a and 3d), whereas that in monazite consists of Ms + Kfs + Ab + Qz (Figs. 3c and 3e). Decrepitation textures suggest the re-equilibration of fluid/melt inclusions to new post-entrapment P-T conditions (e.g., Vityk and Bodnar, 1995; Stöckhert et al., 2001 for review).
Feldspar grains show anhedral shape. Anorthite content in plagioclase in the matrix without K-feldspar lamellae increases from core (An19) to rim (An22). Perthite is present in the matrix and not included in garnet (Fig. 3b). Host and lamellae compositions in perthite are shown in Figure 4 and Table 1.

| Sample | 01O | |||||||
| Occurrence | Melt inclusion | Perthite | Matrix | Grt breakdown | ||||
| Mineral | Crd | Bt | Kfs | Pl | Bt | Grt | Crd | Bt |
| Notes | Host | Lamellae | Rim | |||||
| SiO2 | 49.61 | 41.44 | 64.27 | 64.18 | 36.51 | 37.75 | 49.59 | 36.89 |
| TiO2 | 0.18 | 0.47 | 0.04 | 0.05 | 3.13 | 0.00 | 0.00 | 3.25 |
| Al2O3 | 32.98 | 18.78 | 19.02 | 22.29 | 17.14 | 21.31 | 33.18 | 17.99 |
| Cr2O3 | 0.01 | 0.01 | n.d. | n.d. | 0.05 | 0.07 | 0.00 | 0.18 |
| FeO | 3.36 | 7.80 | 0.15 | 0.00 | 18.30 | 35.12 | 7.12 | 16.78 |
| MnO | 0.02 | 0.01 | 0.00 | 0.00 | 0.02 | 1.56 | 0.10 | 0.00 |
| MgO | 12.00 | 17.63 | 0.00 | 0.00 | 11.43 | 3.95 | 8.98 | 10.65 |
| CaO | 0.02 | 0.01 | 0.00 | 3.30 | 0.06 | 0.87 | 0.03 | 0.02 |
| BaO | 0.00 | 0.00 | 0.47 | 0.00 | 0.03 | 0.00 | 0.01 | 0.12 |
| Na2O | 0.12 | 0.38 | 0.98 | 9.88 | 0.19 | 0.01 | 0.07 | 0.12 |
| K2O | 0.00 | 8.50 | 15.05 | 0.18 | 8.57 | 0.01 | 0.00 | 8.26 |
| F | 0.00 | 0.17 | n.d. | n.d. | 0.18 | n.d. | n.d. | 0.11 |
| Cl | 0.02 | 0.20 | n.d. | n.d. | 0.32 | n.d. | n.d. | 0.30 |
| O = F | 0.00 | 0.07 | n.d. | n.d. | 0.08 | n.d. | n.d. | 0.04 |
| O = Cl | 0.00 | 0.05 | n.d. | n.d. | 0.07 | n.d. | n.d. | 0.07 |
| Total (wt%) | 98.31 | 95.30 | 99.99 | 99.89 | 95.79 | 100.65 | 99.07 | 94.55 |
| Number of O | 18 | 22 | 8 | 8 | 22 | 12 | 18 | 22 |
| Si | 5.00 | 5.87 | 2.97 | 2.84 | 5.49 | 3.00 | 5.03 | 5.56 |
| Ti | 0.01 | 0.05 | 0.00 | 0.00 | 0.35 | 0.00 | 0.00 | 0.37 |
| Al | 3.92 | 3.13 | 1.04 | 1.16 | 3.04 | 2.00 | 3.97 | 3.19 |
| Cr | 0.00 | 0.00 | n.d. | n.d. | 0.01 | 0.00 | 0.00 | 0.02 |
| Fe | 0.28 | 0.92 | 0.01 | 0.00 | 2.30 | 2.34 | 0.60 | 2.11 |
| Mn | 0.00 | 0.00 | 0.00 | 0.00 | 0.00 | 0.10 | 0.01 | 0.00 |
| Mg | 1.80 | 3.72 | 0.00 | 0.00 | 2.56 | 0.47 | 1.36 | 2.39 |
| Ca | 0.00 | 0.00 | 0.00 | 0.16 | 0.01 | 0.07 | 0.00 | 0.00 |
| Ba | 0.00 | 0.00 | 0.01 | 0.00 | 0.00 | 0.00 | 0.00 | 0.01 |
| Na | 0.02 | 0.10 | 0.09 | 0.85 | 0.06 | 0.00 | 0.01 | 0.03 |
| K | 0.00 | 1.54 | 0.89 | 0.01 | 1.65 | 0.00 | 0.00 | 1.59 |
| F | 0.00 | 0.08 | n.d. | n.d. | 0.09 | n.d. | n.d. | 0.05 |
| Cl | 0.00 | 0.05 | n.d. | n.d. | 0.08 | n.d. | n.d. | 0.08 |
| Total cation | 11.04 | 15.34 | 5.00 | 5.01 | 15.48 | 7.99 | 10.99 | 15.28 |
| Mg/(Fetotal + Mg) | 0.86 | 0.80 | 0.53 | 0.17 | 0.69 | 0.53 | ||
| An | 16 | |||||||
| Sample | 01Q | ||||||
| Occurrence | Matrix | Selvage | Perthite | Grt breakdown | |||
| Mineral | Bt | Bt | Kfs | Pl | Grt | Crd | Bt |
| Notes | Host | Lamellae | Rim | ||||
| SiO2 | 36.50 | 35.89 | 64.64 | 63.91 | 37.74 | 49.02 | 34.98 |
| TiO2 | 3.27 | 2.94 | 0.03 | 0.00 | 0.18 | 0.06 | 3.25 |
| Al2O3 | 17.47 | 18.01 | 18.56 | 22.68 | 20.42 | 32.57 | 17.54 |
| Cr2O3 | 0.14 | 0.00 | n.d. | n.d. | 0.00 | 0.03 | 0.03 |
| FeO | 15.64 | 20.83 | 0.05 | 0.04 | 36.20 | 6.75 | 20.53 |
| MnO | 0.00 | 0.03 | 0.00 | 0.00 | 1.53 | 0.09 | 0.00 |
| MgO | 11.22 | 8.22 | 0.01 | 0.00 | 3.77 | 9.39 | 9.00 |
| CaO | 0.00 | 0.01 | 0.01 | 3.43 | 0.97 | 0.02 | 0.01 |
| BaO | 0.28 | 0.06 | 0.23 | 0.00 | n.d. | n.d. | n.d. |
| Na2O | 0.11 | 0.09 | 0.79 | 9.70 | 0.00 | 0.12 | 0.13 |
| K2O | 9.61 | 9.55 | 15.30 | 0.15 | 0.01 | 0.00 | 9.80 |
| F | 0.03 | 0.00 | n.d. | n.d. | n.d. | n.d. | 0.16 |
| Cl | 0.32 | 0.45 | n.d. | n.d. | n.d. | n.d. | 0.43 |
| O = F | 0.01 | 0.00 | n.d. | n.d. | n.d. | n.d. | 0.07 |
| O = Cl | 0.07 | 0.10 | n.d. | n.d. | n.d. | n.d. | 0.10 |
| Total (wt%) | 94.49 | 95.99 | 99.61 | 99.91 | 100.83 | 98.04 | 95.68 |
| Number of O | 22 | 22 | 8 | 8 | 12 | 18 | 22 |
| Si | 5.53 | 5.48 | 2.99 | 2.82 | 3.02 | 5.02 | 5.39 |
| Ti | 0.37 | 0.34 | 0.00 | 0.00 | 0.01 | 0.00 | 0.38 |
| Al | 3.12 | 3.24 | 1.01 | 1.18 | 1.92 | 3.94 | 3.18 |
| Cr | 0.02 | 0.00 | n.d. | n.d. | 0.00 | 0.00 | 0.00 |
| Fe | 1.98 | 2.66 | 0.00 | 0.00 | 2.42 | 0.58 | 2.64 |
| Mn | 0.00 | 0.00 | 0.00 | 0.00 | 0.10 | 0.01 | 0.00 |
| Mg | 2.54 | 1.87 | 0.00 | 0.00 | 0.45 | 1.43 | 2.06 |
| Ca | 0.00 | 0.00 | 0.00 | 0.16 | 0.08 | 0.00 | 0.00 |
| Ba | 0.02 | 0.00 | 0.00 | 0.00 | n.d. | n.d. | n.d. |
| Na | 0.03 | 0.03 | 0.07 | 0.83 | 0.00 | 0.02 | 0.04 |
| K | 1.86 | 1.86 | 0.90 | 0.01 | 0.00 | 0.00 | 1.93 |
| F | 0.01 | 0.00 | n.d. | n.d. | n.d. | n.d. | 0.08 |
| Cl | 0.08 | 0.12 | n.d. | n.d. | n.d. | n.d. | 0.11 |
| Total cation | 15.47 | 15.50 | 4.99 | 5.01 | 8.01 | 11.01 | 15.62 |
| Mg/(Fetotal + Mg) | 0.56 | 0.41 | 0.16 | 0.71 | 0.44 | ||
| An | 17 | ||||||
| Sample | 01R | |||||
| Occurrence | Selvage | Matrix | ||||
| Mineral | Kfs | Pl | Bt | Grt | Bt | Pl |
| Notes | Fig. 3i | Fig. 3i | Fig. 3i | Core | ||
| SiO2 | 66.58 | 62.03 | 34.96 | 39.37 | 35.80 | 63.28 |
| TiO2 | 0.03 | 0.00 | 3.25 | 0.16 | 3.55 | 0.06 |
| Al2O3 | 18.30 | 24.38 | 18.14 | 22.06 | 17.84 | 22.80 |
| Cr2O3 | 0.00 | 0.00 | 0.05 | 0.08 | 0.11 | 0.00 |
| FeO | 0.12 | 0.11 | 19.01 | 28.15 | 16.17 | 0.16 |
| MnO | 0.06 | 0.02 | 0.09 | 0.49 | 0.00 | 0.00 |
| MgO | 0.00 | 0.00 | 8.39 | 8.72 | 10.87 | 0.00 |
| CaO | 0.01 | 5.56 | 0.01 | 1.44 | 0.00 | 3.81 |
| BaO | 0.45 | 0.00 | 0.24 | 0.02 | 0.01 | 0.02 |
| Na2O | 1.13 | 8.23 | 0.06 | 0.03 | 0.09 | 9.56 |
| K2O | 13.83 | 0.14 | 9.86 | 0.04 | 9.50 | 0.14 |
| F | n.d. | n.d. | 0.15 | n.d. | 0.23 | n.d. |
| Cl | n.d. | n.d. | 0.70 | n.d. | 0.19 | n.d. |
| O = F | n.d. | n.d. | 0.06 | n.d. | 0.09 | n.d. |
| O = Cl | n.d. | n.d. | 0.16 | n.d. | 0.04 | n.d. |
| Total (wt%) | 100.51 | 100.46 | 94.71 | 100.56 | 94.22 | 99.81 |
| Number of O | 8 | 8 | 22 | 12 | 22 | 8 |
| Si | 3.03 | 2.74 | 5.42 | 3.02 | 5.45 | 2.80 |
| Ti | 0.00 | 0.00 | 0.38 | 0.01 | 0.41 | 0.00 |
| Al | 0.98 | 1.27 | 3.32 | 1.99 | 3.20 | 1.19 |
| Cr | 0.00 | 0.00 | 0.01 | 0.00 | 0.01 | 0.00 |
| Fe | 0.00 | 0.00 | 2.46 | 1.80 | 2.06 | 0.01 |
| Mn | 0.00 | 0.00 | 0.01 | 0.03 | 0.00 | 0.00 |
| Mg | 0.00 | 0.00 | 1.94 | 1.00 | 2.47 | 0.00 |
| Ca | 0.00 | 0.26 | 0.00 | 0.12 | 0.00 | 0.18 |
| Ba | 0.01 | 0.00 | 0.01 | 0.00 | 0.00 | 0.00 |
| Na | 0.10 | 0.70 | 0.02 | 0.00 | 0.03 | 0.82 |
| K | 0.80 | 0.01 | 1.95 | 0.00 | 1.85 | 0.01 |
| F | n.d. | n.d. | 0.07 | n.d. | 0.11 | n.d. |
| Cl | n.d. | n.d. | 0.18 | n.d. | 0.05 | n.d. |
| Total cation | 4.93 | 4.98 | 15.52 | 7.98 | 15.47 | 5.01 |
| Mg/(Fetotal + Mg) | 0.44 | 0.36 | 0.55 | |||
| An | 27 | 19 | ||||
n.d.; not determined.
Biotite is present in nanogranitoid inclusions in garnet, as a single-phase inclusion in garnet and sillimanite, as cordierite-biotite intergrowth rimming garnet, as coarse secondary grains replacing garnet at the margin and along the cracks, and in the matrix (Figs. 3a-3d). Biotite in nanogranitoid inclusions and that included in garnet shows lower Cl and Ti contents and higher XMg than that present in cordierite-biotite intergrowth, that in the matrix, and that included in sillimanite (Figs. 5a and 5b). Coarse secondary biotite rimming garnet has low Ti content and high XMg (Figs. 5a and 5b).

Cordierite is present in a nanogranitoid inclusion and as cordierite-biotite intergrowth rimming garnet, and not present in the matrix. Cordierite in the nanogranitoid inclusion and cordierite-biotite intergrowth has XMg of 0.88 and 0.69-0.76, respectively (Figs. 3a and 3d). Both cordierites show the Raman peaks of CO2 and H2O (cf. Fig. 6).

This is a Sil-Grt-Bt gneiss. The gneissose structure is discordantly cut by ∼ 2 mm-thick selvages mainly composed of biotite (Fig. 2e). The selvage is an extension of that in sample 01R (Fig. 2e). The host gneiss consists mainly of garnet, biotite, sillimanite, K-feldspar (with or without perthitic texture), plagioclase and quartz with minor amounts of apatite, cordierite, monazite, zircon, rutile, ilmenite, and spinel.
Garnet is <1 cm in diameter, including sillimanite, biotite and quartz as single phases. Garnet shows rimward decrease of Mg and XMg, and rimward increase of Fe and Mn (Alm60-79Prp15-36Sps1-3Grs2-3; XMg = 0.16-0.37). The zonings are gradual, and sharp core/rim boundary in major and trace elements was not recognized by X-ray elemental mapping. Garnet is commonly rimmed by cordierite-biotite intergrowth at the margin (Figs. 3f and 3g), and partly replaced by coarse-grained biotite. The intergrowth texture is cut by the biotite-bearing selvage.
Feldspar grains are anhedral. Plagioclase in the matrix without K-feldspar lamellae is homogeneous (An20-21). Perthite is present in the matrix and not included in garnet (Fig. 3f). Host and lamellae compositions of perthite are shown in Figure 4 and Table 1.
Biotite is present as a single-phase inclusion in garnet, as cordierite-biotite intergrowth rimming garnet, in the biotite-bearing selvage, as coarse secondary grains replacing garnet at the margin and along the cracks, and in the matrix (Fig. 3f). Biotite in the selvage and that included in garnet shows high Cl content (up to 0.53 wt% Cl). There is a tendency that Cl concentration decreases with increasing XMg except for biotite included in garnet (Fig. 5c).
Cordierite is present as cordierite-biotite intergrowth rimming garnet, and not present in the matrix (Figs. 3f and 3g). Cordierite within the intergrowth includes sillimanite and has XMg of ∼ 0.66-0.77 (Fig. 3g), with the Raman peaks of CO2 and H2O (Fig. 6).
Sample 01RThis is a Bt-Grt gneiss. The gneissose structure is discordantly cut by ∼ 2 mm-thick biotite-bearing selvages (Fig. 3h). The selvage is an extension of that in sample 01Q (Fig. 2e). The host gneiss consists mainly of garnet, biotite, K-feldspar, plagioclase, and quartz with minor amounts of ilmenite, rutile and zircon, whereas the selvage is mainly composed of biotite. An aggregate composed of intergrowth of Bt + Kfs + And + Pl + Qz is seen within the selvage (Fig. 3i). Al2SiO5 minerals are not present in the host gneiss.
Garnet is anhedral, inclusion-free, and typically less than 1 mm in diameter (Fig. 3h). It shows rimward decrease of Mg, Ca, and XMg, and rimward increase of Fe and Mn (Alm61-78Prp15-34Sps1-4Grs3-4; XMg = 0.16-0.36). The zonings are gradual, and sharp core/rim boundary in major and trace elements was not recognized by X-ray elemental mapping. Garnet is rimmed by Bt-Pl and Bt-Qz intergrowth textures, and partly replaced by coarse-grained secondary biotite at the margin and along the cracks.
Biotite is present in the Bt-Pl/Bt-Qz intergrowth textures, in the biotite-bearing selvage, as coarse secondary grains replacing garnet, and in the matrix (Figs. 3h-3k). Biotite in the selvage has high Cl and Ti contents (Figs. 5e and 5f). The XMg is negatively correlated with Cl content (Fig. 5e).
Plagioclase is present in the matrix and as an aggregate within the biotite-bearing selvage (Fig. 3i). Plagioclase in the matrix and within the aggregate are homogeneous in composition of An19-24 and An24-27, respectively (Fig. 3i and Table 1).
Sample 01IThis is a massive Hbl-Bt granodiorite, composed mainly of amphibole, biotite, plagioclase, K-feldspar and quartz with accessory apatite, zircon, ilmenite, magnetite, titanite, and allanite (Fig. 7).

Amphibole can be divided into three domains. Domain-1 has hornblende-edenite composition (Figs. 7, 8, and Table 2). Domain-2 is composed of intergrowth of anthophyllite, actinolite and quartz, suggesting pseudomorph after clinopyroxene (cf. Mueller, 1973; Figs. 7, 8, and Table 2). Domain-3 is observed at the margin of domain-1 and between domain-1 and domain-2, and shows Al-poor hornblende composition compared to domain-1 (Figs. 7 and 8). Domain-1 of amphibole includes biotite, magnetite, ilmenite, and apatite. Chlorine concentration of amphibole is high in domain-1, whereas it is low in domain-2 and domain-3 (Fig. 8c).

| Sample | 01I | ||||||||
| Mineral | Amp | Amp | Amp | Amp | Amp | Pl | Pl | Pl | Bt |
| Notes | Domain-1 /Hbl |
Domain-1 /Hbl |
Domain-2 /Ath |
Domain-2 /Act |
Domain-3 /Hbl |
Core | Rim | Low An domain |
Matrix |
| SiO2 | 42.34 | 43.36 | 51.78 | 53.15 | 47.44 | 59.06 | 63.34 | 65.62 | 35.92 |
| TiO2 | 1.21 | 1.49 | 1.59 | 0.03 | 0.61 | 0.00 | 0.29 | 0.06 | 3.48 |
| Al2O3 | 9.75 | 8.69 | 0.24 | 2.03 | 6.29 | 25.42 | 22.76 | 21.34 | 14.01 |
| Cr2O3 | 0.00 | 0.01 | 0.03 | 0.00 | 0.00 | 0.04 | 0.02 | 0.00 | 0.00 |
| FeO | 24.87 | 22.17 | 27.93 | 19.06 | 22.10 | 0.16 | 0.08 | 0.10 | 25.13 |
| MnO | 0.29 | 0.31 | 1.12 | 0.43 | 0.34 | 0.00 | 0.00 | 0.00 | 0.04 |
| MgO | 5.46 | 6.92 | 11.97 | 12.02 | 8.46 | 0.00 | 0.00 | 0.00 | 7.81 |
| CaO | 11.21 | 10.81 | 1.45 | 10.95 | 11.06 | 7.50 | 4.21 | 2.62 | 0.00 |
| BaO | 0.13 | 0.00 | 0.06 | 0.12 | 0.13 | 0.25 | 0.09 | 0.08 | 0.59 |
| Na2O | 1.39 | 1.56 | 0.05 | 0.23 | 1.19 | 6.90 | 8.87 | 10.11 | 0.00 |
| K2O | 1.24 | 1.15 | 0.02 | 0.13 | 0.74 | 0.13 | 0.11 | 0.13 | 9.22 |
| F | 0.00 | 0.00 | 0.00 | 0.00 | 0.00 | n.d. | n.d. | n.d. | 0.03 |
| Cl | 0.22 | 0.21 | 0.00 | 0.01 | 0.10 | n.d. | n.d. | n.d. | 0.21 |
| O = F | 0.00 | 0.00 | 0.00 | 0.00 | 0.00 | n.d. | n.d. | n.d. | 0.01 |
| O = Cl | 0.05 | 0.05 | 0.00 | 0.00 | 0.02 | n.d. | n.d. | n.d. | 0.05 |
| Total (wt%) | 98.07 | 96.63 | 96.25 | 98.16 | 98.44 | 99.46 | 99.76 | 100.05 | 96.38 |
| Number of O | 23 | 23 | 23 | 23 | 23 | 8 | 8 | 8 | 22 |
| Si | 6.62 | 6.77 | 7.93 | 7.82 | 7.19 | 2.65 | 2.80 | 2.89 | 5.62 |
| Ti | 0.14 | 0.18 | 0.18 | 0.00 | 0.07 | 0.00 | 0.01 | 0.00 | 0.41 |
| Al | 1.80 | 1.60 | 0.04 | 0.35 | 1.12 | 1.35 | 1.19 | 1.11 | 2.58 |
| Cr | 0.00 | 0.00 | 0.00 | 0.00 | 0.00 | 0.00 | 0.00 | 0.00 | 0.00 |
| Fe | 3.25 | 2.90 | 3.58 | 2.35 | 2.80 | 0.01 | 0.00 | 0.00 | 3.29 |
| Mn | 0.04 | 0.04 | 0.14 | 0.05 | 0.04 | 0.00 | 0.00 | 0.00 | 0.01 |
| Mg | 1.27 | 1.61 | 2.73 | 2.64 | 1.91 | 0.00 | 0.00 | 0.00 | 1.82 |
| Ca | 1.88 | 1.81 | 0.24 | 1.73 | 1.79 | 0.36 | 0.20 | 0.12 | 0.00 |
| Ba | 0.01 | 0.00 | 0.00 | 0.01 | 0.01 | 0.00 | 0.00 | 0.00 | 0.04 |
| Na | 0.42 | 0.47 | 0.01 | 0.06 | 0.35 | 0.60 | 0.76 | 0.86 | 0.00 |
| K | 0.25 | 0.23 | 0.00 | 0.02 | 0.14 | 0.01 | 0.01 | 0.01 | 1.84 |
| F | 0.00 | 0.00 | 0.00 | 0.00 | 0.00 | n.d. | n.d. | n.d. | 0.01 |
| Cl | 0.06 | 0.05 | 0.00 | 0.00 | 0.03 | n.d. | n.d. | n.d. | 0.06 |
| Total cation | 15.67 | 15.60 | 14.87 | 15.04 | 15.43 | 4.98 | 4.98 | 4.99 | 15.60 |
| Mg/(Fetotal + Mg) | 0.28 | 0.36 | 0.43 | 0.53 | 0.41 | 0.36 | |||
| An | 35 | 20 | 11 |
n.d., not determined.
Plagioclase is oscillatory-zoned in terms of An component (Fig. 7h and Table 2). The core is An35, whereas the rim is An20 (Fig. 7h). Much lower An content domain (∼ An10) is also recognized, which tends to fill grain boundaries (Fig. 7h). Plagioclase rim includes and is in contact with domain-1 of amphibole, whereas the low An domain is in contact with domain-3 (Fig. 7).
Garnet, plagioclase, sillimanite, and K-feldspar with perthitic texture constitute the gneissose structure in samples 01O and 01Q. The garnet core includes nanogranitoid and has high XMg composition, implying that the peak P-T compositions are preserved. The garnet-Al silicate-plagioclase (GASP) geobarometer (Holdaway, 2001) was applied to the composition of garnet core and core of matrix plagioclase in samples 01O and 01Q, because garnet includes sillimanite but does not include plagioclase in both samples. They give similar pressure of ∼ 0.93-1.1 GPa, assuming the temperature of 800-900 °C in both samples (Fig. 9). Using the matrix plagioclase rim composition, pressure of ∼ 0.77-0.94 GPa at 800-900 °C was obtained. Ternary feldspar thermometry (Fuhrman and Lindsley, 1988; Kroll et al., 1993; Benisek et al., 2004, 2010) was applied to the perthite in samples 01O and 01Q. Less zoned perthite grains with respect to the distribution of lamellae were selected. Pre-exsolution compositions of perthite were calculated using chemical analyses of homogeneous host and lamellae domains, their areal proportions, and density, following the procedure of Higashino and Kawakami (2022). The original pre-exsolution compositions can be back-calculated using whole grain as indicated by broken lines in Figure 3b. The re-integrated compositions gave equilibrium temperatures of ∼ 800-900 °C at 0.8-1.1 GPa (Fig. 4) using solvus of Fuhrman and Lindsley (1988) modified by Kroll et al. (1993) and Benisek et al. (2004, 2010). Perthite grains in both samples give similar temperature estimates (Fig. 4). The high-T condition is possibly enough to induce partial melting (Fig. 9). This is also evidenced by nanogranitoid inclusions observed in garnet and monazite in sample 01O (Figs. 3d and 3e). Nanogranitoid inclusions in garnet and monazite in sample 01O suggest that these minerals grew in the presence of melt and that the garnet is a peritectic product (Figs. 3d and 3e).

Garnet is commonly replaced by cordierite-biotite intergrowth in samples 01O and 01Q (Figs. 3a, 3f, and 3g). This suggests that the garnet breakdown to form cordierite and biotite was caused by fluid infiltration. In order to estimate P-T conditions of the cordierite-biotite intergrowth formation, the garnet-biotite geothermometer (Holdaway, 2000), the GASP geobarometer (Holdaway, 2001) and the garnet-biotite-plagioclase-quartz (GBPQ) geobarometer (Wu et al., 2004) were applied to the composition of garnet rim, biotite and plagioclase present in the intergrowth. This results in ∼ 590-600 °C, ∼ 0.24-0.31 GPa and ∼ 605-645 °C, ∼ 0.28-0.35 GPa for samples 01O and 01Q, respectively (Fig. 9). Since sillimanite is observed within the cordierite-biotite intergrowth, the intergrowth was formed under the sillimanite stability field and thus the estimated temperature conditions were probably modified due to Fe-Mg re-equilibrium after the intergrowth formation. Therefore, the temperature condition of the intergrowth formation would have been higher than 645 °C. Part of the nanogranitoid inclusions in garnet (Fig. 3d) also has the same mineral assemblage with that of cordierite-biotite intergrowth microstructure. This implies that cordierite in the nanogranitoid inclusion was modified from the composition of their entrapment.
On the other hand, the biotite-bearing selvage formation followed the cordierite-biotite formation because the selvage cut the cordierite-biotite intergrowth in sample 01Q. Since andalusite is exclusively present in the aggregate within the selvage in sample 01R (Fig. 3i), the selvage was probably formed in the andalusite-stability field. Two-feldspar thermometry (Benisek et al., 2004) is applied to plagioclase and K-feldspar in the aggregate (Fig. 3i and Table 1). Using the mixing model of Benisek et al. (2010), the temperature of ∼ 450-530 °C is obtained under the pressure of andalusite-stability field (Fig. 9).
Solidification P-T conditions of granodioriteThe Al-in-hornblende geobarometer of Mutch et al. (2016) is experimentally calibrated for the mineral assemblage of Qz + Kfs + Pl + Hbl + Bt + Ilm/Ttn + Mag + Ap. Domain-1 of amphibole in sample 01I is confirmed to coexist with the phases required for the application of Al-in-hornblende geobarometer of Mutch et al. (2016) (Fig. 7). Since the domain-1 amphibole is included in the rim of plagioclase (An20-21), they are interpreted to have coexisted in equilibrium at the final crystallization stage of the granodiorite magma. Therefore, the Al-in-hornblende geobarometer of Mutch et al. (2016) and amphibole-plagioclase geothermometer of Holland and Blundy (1994) were applied to the domain-1 of amphibole and plagioclase rim. Application of these geothermobarometer resulted in ∼ 650-670 °C and ∼ 0.34-0.43 GPa (Fig. 9). These results plotted on the H2O-saturated haplogranite solidus within error are accepted as the solidification P-T conditions (Fig. 9). Mingling texture between the granodiorite and leucocratic granite implies that they solidified at similar P-T conditions (Figs. 2 and 9).
Domain-3 of amphibole is interpreted to be in equilibrium with low An domain of plagioclase (Fig. 7). The pair of these minerals results in ∼ 580-590 °C by amphibole-plagioclase geothermometer of Holland and Blundy (1994), assuming the pressure of <0.43 GPa (Fig. 9). This is considered to be the temperature condition for the subsolidus alteration of hornblende.
Since molecular CO2 is usually orientated linearly along the a-axis in cordierite channel, the peak intensity at 1383 cm−1 obtained by the Raman spectroscopy varies considerably depending on the crystal orientation of cordierite (Fig. 6; Kolesov and Geiger, 2000). The CO2 content of cordierite is determined by a semi-quantitative technique calibrated by Kaindl et al. (2006). Kaindl et al. (2006) calibrates two regression equations c1 and c2, which are used for the calculation of CO2 concentrations out of the two intensity ratios I1 = I1383/I973 and I2 = I1383/I1185:
| \begin{align*} &c_{1}\ \text{[wt%]} = 1.3146 {\cdot} I_{1} \\ &\text{and} \\ &c_{2}\ \text{[wt%]} = 1.2651 {\cdot} I_{2} \end{align*} |
Under the condition that the Cl-bearing biotite coexisted with fluid, log[f(H2O)/f(HCl)] of the coexisting fluid can be estimated using the equation of Munoz (1992), which is based on the partition coefficient of Cl-OH between biotite and fluid (Zhu and Sverjensky, 1991, 1992). The equation is:
| \begin{align*} \log[(f\text{H$_{2}$O})/(f\text{HCl})] &= 1000/T {\cdot} (1.15 - 0.55\text{X}_{\text{Mg}}) \\&\quad+ 0.68 - \log(\text{X}_{\text{Cl}}/\text{X}_{\text{OH}}), \end{align*} |
The matrix biotite which defines the foliation is considered to coexist with fluid at ∼ 800-900 °C obtained from the ternary feldspar thermometry (Fig. 4). The fugacity ratios were calculated using the equation of Munoz (1992). The log[f(H2O)/f(HCl)] of the coexisting fluid with the matrix biotite in samples 01Q and 01R was estimated as 3.16-3.27 and ∼ 3.57, respectively. Considering that the matrix biotite might have been formed after the peak P-T conditions, the log[f(H2O)/f(HCl)] values become larger. Additionally, in the case that biotite present in cordierite-biotite intergrowth coexisted with fluid at >645 °C, log[f(H2O)/f(HCl)] of the coexisting fluid was estimated as <3.62 in both samples. The log[f(H2O)/f(HCl)] of the coexisting fluid with biotite in the selvage was calculated as 3.42-3.48 in sample 01Q and ∼ 3.21 in sample 01R at 450-530 °C.
The metamorphic P-T conditions recorded in the matrix mineral assemblage are similar to the peak P-T conditions reported from northern Perlebandet (Fig. 9; Kawakami et al., 2017). However, retrograde P-T conditions recorded in the studied samples are inconsistent with Kawakami et al. (2017). Whereas Kawakami et al. (2017) reported garnet breakdown near the P-T conditions of the Al2SiO5 triple point, this study shows higher-T and lower-P conditions for the cordierite-biotite intergrowth formation (>645 °C, ∼ 0.24-0.35 GPa; Fig. 9). Kyanite and andalusite are not observed within the intergrowth in the studied samples while sillimanite is observed in it. Therefore, the garnet breakdown likely occurred at almost the same P-T conditions to the solidification of the massive granodiorite (Fig. 9). The selvage-formation following the garnet breakdown possibly occurred at similar depth to the garnet breakdown (Fig. 9). The inconsistence of cooling histories in southern and northern Perlebandet suggests the following two possibilities.
(i) Existence of tectonic boundary between southern and northern Perlebandet:
Perlebandet might be an assemblage of different tectonic blocks with different P-T paths. However, granite/granodiorite body is not exposed in northern part of Perlebandet and the strikes of foliations are similar in northern and southern Perlebandet (Fig. 1; Shiraishi et al., 1992). Magnetic boundaries are not suggested between northern and southern Perlebandet (Mieth et al., 2014). Since the MTB is supposed to be a low-angle thrust fault (Osanai et al., 2013), it is possible that the MTB simply does not appear as a magnetic boundary. Even taking this into consideration, there is little supporting evidence for the existence of a tectonic boundary between northern and southern nunataks so far.
(ii) Contact metamorphism occurred following the counter-clockwise P-T path:
Granodiorite intrusion can be a heat source for surrounding metamorphic rocks (Figs. 2a and 2b). The solidification P-T conditions from sample 01I imply that the massive granodiorite intrusion can be a trigger of local temperature increase and subsequent garnet breakdown (Fig. 9). This would be supported by numerical modelling of Annen et al. (2006) which shows that intrusion of sills increases temperature of pre-existing crustal rocks, because sample localities of metamorphic rocks are not so far from the massive granodiorite (Figs. 2a and 2b). In this case, fluid phase may infiltrate into metamorphic rocks from the granodiorite or the leucocratic granite during their crystallization. Although it is difficult to distinguish regional and contact metamorphisms solely from the P-T conditions, geological consistency suggests that the P-T path reflects the retrograde metamorphism after the granodiorite intrusion.
Chemical evolution of fluidsCordierite and biotite within the intergrowth rimming garnet are considered to have formed simultaneously (Fig. 3g). Therefore, fluid composition estimated by these minerals reflects that of the same fluid. Chlorine in biotite and CO2 in cordierite suggest that garnet breakdown occurred in equilibrium with Cl-bearing and CO2-bearing fluids. Chlorine concentration in the fluid was calculated to be ∼ 12 wt% Cl, using thermodynamic equilibrium relationship in the mineral assemblage of Qz-Sil-Pl-Grt-Bt-HCl-H2O at 750 °C, 0.5 GPa (Aranovich, 2017). The P-T conditions are slightly higher than that for the cordierite-biotite intergrowth formation (Fig. 9). Assuming the cation coupled with Cl in the fluid is Na, ∼ 12 wt% is presumed to be the upper limit for NaCl concentration in the fluid. The NaCl-CO2-H2O diagram indicates that the NaCl- and CO2-bearing aqueous fluid is present as a single phase at >600 °C, >0.2 GPa, regardless of the CO2 concentration in the fluid (Ivanov and Bushmin, 2021). Therefore, garnet breakdown is considered to have occurred by the infiltration of one-phase aqueous fluid containing Cl and CO2. The solidification P-T conditions of the massive granodiorite suggest that the temperature of granodiorite when it intruded was higher, and Cl-bearing aqueous fluid was probably released from the crystallizing granodiorite melt (Fig. 9). This is supported by Cl-bearing biotite and hornblende compositions in the granodiorite (Table 2). Since mingling texture between the granodiorite and leucocratic granite implies that they solidified at similar P-T conditions (Figs. 2 and 9), the leucocratic granite might also be the source of Cl-bearing aqueous fluid. Such fluid infiltrated into the host metamorphic rock possibly became a trigger of garnet breakdown and the fluid composition was recorded in cordierite and biotite.
Following the garnet breakdown, biotite-bearing selvage was also formed by fluid infiltration. Since biotite in the selvage has higher Cl concentration (Figs. 3j, 5c, and 5e), the selvage is presumed to be formed by Cl-bearing fluid infiltration. Whereas the log[f(H2O)/f(HCl)] of the coexisting fluid with biotite in cordierite-biotite intergrowth is similar in both samples 01Q and 01R, that in the selvage is different in these samples. The log[f(H2O)/f(HCl)] = 3.42-3.48 of the fluid coexisted with biotite in the selvage in sample 01Q is higher than the value of 3.21 in sample 01R. Since the selvage in both samples are the same ones (Fig. 2e), the same fluid infiltration is presumed. Therefore, the variation of log[f(H2O)/f(HCl)] value in the selvage possibly reflects change of fluid composition due to the consumption of H2O by biotite-forming reaction in the selvage. The temperature condition for the selvage formation is lower than that recorded in domain-3 of amphibole in sample 01I (Fig. 9). This might mean that the biotite-bearing selvage was formed at the final stage of fluid evolution. The K-feldspar-andalusite intergrowth in the selvage means that the selvage-forming P-T conditions are higher than the reaction curve of muscovite breakdown (Figs. 3i and 9). This implies that XH2O of the Cl-bearing fluid that formed the biotite-bearing selvage was lower than 0.3 (Fig. 9; Johannes and Holtz, 1996).
Retrograde isobaric cooling P-T path is detected from southern part of Perlebandet. This is possibly a record of P-T change after the intrusion of igneous rocks.
Garnet breakdown occurred by one-phase CO2-Cl-H2O fluid infiltration at >645 °C, 0.24-0.35 GPa. This is followed by Cl-bearing fluid infiltration at ∼ 450-530 °C under the andalusite stability field.
The inconsistence of P-T paths reported from northern and southern Perlebandet is probably due to igneous bodies beneath the metamorphic rocks.
We would like to thank Prof. Yoshikuni Hiroi and an anonymous reviewer for constructive reviews that helped improving the manuscript and Prof. Tomokazu Hokada for editorial efforts. Members of JARE are thanked for fruitful discussions and supports during the field work in the SRM. This study was financially supported by JSPS KAKENHI Grant Number JP19H01991 and NIPR General Collaboration Project (No. 28-25) to the second author.
Supplementary Table S1 is available online from https://doi.org/10.2465/jmps.230131a.