Abstract
The Napier Complex in Enderby Land and western Kemp Land is a unique component of the East Antarctic Shield because it records a timeline of crustal growth from the Eo- to Neoarchean. It is mainly composed of enderbitic and charnockitic gneisses and granulites that were metamorphosed at ∼ 2.5 Ga, and locally at ∼ 2.8 Ga, under high- to ultra-high-temperature conditions. Despite generating scientific interest for several decades, the geological history of the complex has not been well constrained. In this study, samples from the Napier Mountains were selected for zircon imaging and U-Pb dating by Secondary Ion Mass Spectrometry. They record metamorphic growth, recrystallization, and modification of zircon at 2800-2770, 2740-2720, and 2490-2460 Ma. For the first time, fluid-related alteration at around 2730 Ma is evident in a granitic gneiss from Grimsley Peaks. At the similar time, dioritic gneiss was formed at Mount Marr. Tonalitic and granitic gneisses from Grimsley Peaks yield protolith crystallization ages of around 3210 and 2825 Ma, respectively. The generation of granitic gneiss was coeval with ∼ 2.8 Ga metamorphism in the area. These new data from this little-known part of the complex provide a better understanding of the crustal evolution of the Napier Complex.
INTRODUCTION
Zircon (ZrSiO4) is the mineral of choice for U-Th-Pb geochronology of Archean rocks, as it is chemically and physically robust. It contains radiogenic Pb from the decay of U and Th, but initially excludes Pb from its crystallographic structure during magmatic growth. Moreover, zircon maintains its isotopic signature even during high-grade metamorphic processes because of the extraordinarily low diffusivity of Pb in zircon (Cherniak and Watson, 2001, 2003). It commonly retains accumulated radiogenic Pb despite weathering or metamorphism of the host rock (Hoskin and Schaltegger, 2003). Zircon cathodoluminescence (CL) and back scattered electron (BSE) imaging can reveal a variety of internal structures which can be linked to specific geological processes, including crystallization from a magma, subsolidus recrystallization, dissolution and reprecipitation, or fluid-mediated alteration (Corfu et al., 2003; Harley and Kelly, 2007; Taylor et al., 2016). This imagery can shed light not only on the timing of zircon crystallization but its alteration and recrystallization during metamorphism.
The Napier Complex is one of the least studied regions where early Earth rocks have been preserved. It is likely composed of different crustal domains, each with its own independent geological history (Król et al., 2022) varying in the timing and type of magmatism and metamorphism. This preliminary hypothesis needs to be verified and the extent of each crustal domain needs to be constrained. In this study, we focus on the geochronology of the Napier Mountains, as this region has received little attention compared to more accessible locations, particularly along the coast. Here, we present results obtained on complex zircon grains from orthogneisses from Grimsley Peaks, Mount Marr and Johnston Peak in the Napier Mountains to determine the effects of metamorphism, including the 2.5 Ga high to ultra-high temperature (HT/UHT) event, on the isotopic as well as internal structure of zircon grains. Uranium-Pb geochronology, together with BSE and CL imaging have been used to decipher metamorphic processes in which primary zircon has been recrystallized or there was growth of new zircon domains. Whole-rock geochemistry was also employed to shed more light on possible geotectonic scenarios.
GEOLOGICAL SETTING
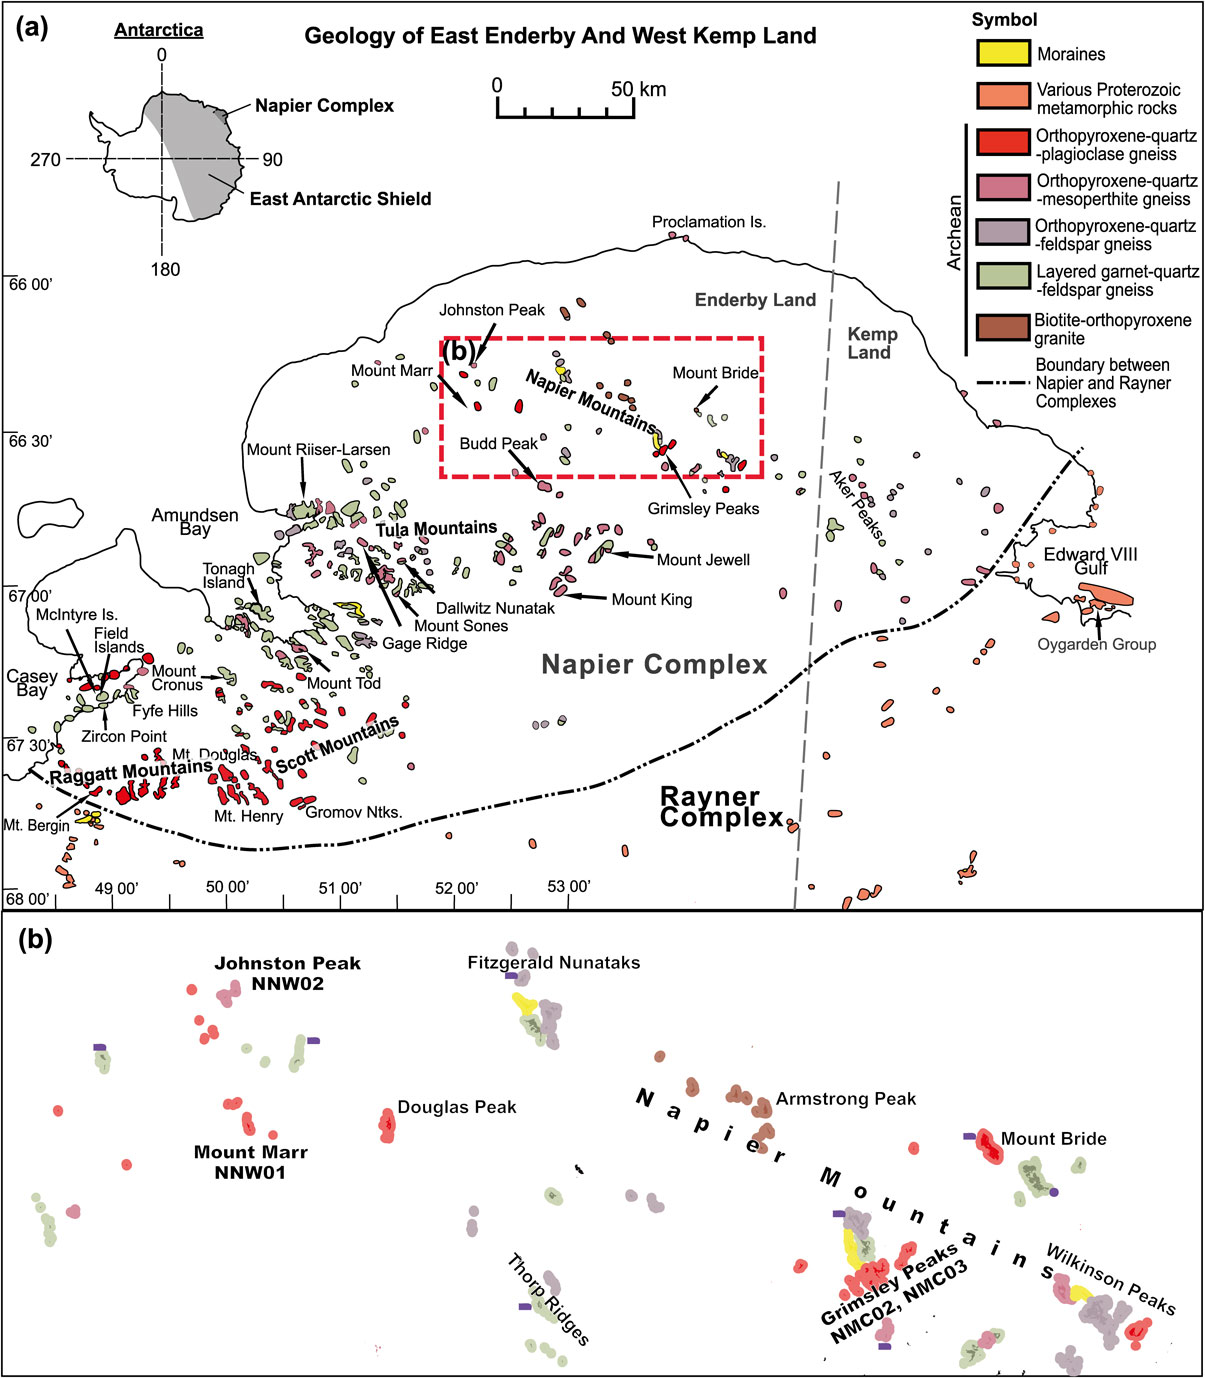
The Napier Complex of Enderby Land and western Kemp Land extends along the Antarctic coast between longitudes 48°E and 57°E (Fig. 1). It forms part of the East Antarctic Shield, which records a prolonged history of continental growth and terrane assembly throughout the Proterozoic, with final assembly in the Cambrian (Fitzsimons, 2000; Harley et al., 2013). The geology of the Napier Complex has been reviewed by Sheraton et al. (1987) and recently by Harley et al. (2019). In a more recent paper, Król et al. (2022) also summarized the available magmatic geochronological data from across the complex. The complex is comprised mostly of gneisses and granulites formed under HT to UHT conditions at ∼ 2.5 Ga (Sheraton et al., 1987; Hokada et al., 2008; Clark et al., 2018; Harley et al., 2019) and locally at ∼ 2.8 Ga (Harley and Black, 1997; Hokada et al., 2008; Clark et al., 2018; Król et al., 2020). Orthopyroxene-quartz-feldspar orthogneisses and layered garnet-quartz-feldspar paragneisses constitute the predominant rock-types, with minor mafic components. Orthogneisses vary from tonalite (enderbite), through tonalite-trondhjemite-granodiorite (TTG), to granite (charnockite) in composition. The Napier Mountains (Fig. 1a and 1b) are an inland mountain range, extending about 60 km in a NW-SE direction, and located in the northern Napier Complex, over 100 km south of Proclamation Island. They are characterized by scarce and isolated outcrops in the form of nunataks. Whereas mesoperthite-bearing charnockitic gneisses metamorphosed up to UHT conditions (Harley, 2016) are particularly abundant around Amundsen Bay and in the Tula Mountains (Fig. 1a), two-feldspar gneisses crop out in the Napier Mountains (Sheraton et al., 1987), probably reflecting lower peak metamorphic temperatures. The Napier Mountains region lies outside of the UHT metamorphic domain as outlined by Harley and Motoyoshi (2000), based on the geothermobarometry of garnet-othopyroxene bearing granulites (Harley, 1985) and characteristic mineral assemblages in pelites (Harley et al., 1990 and references therein). The presence of cordierite rather than an assemblage of sapphirine and quartz in metapelites indicates lower P/T conditions in the Napier Mountains (Sheraton et al., 1987), where post-metamorphic pressures were estimated at ∼ 5 kbar (Harley, 1983, 1985). Apart from gneisses and granulites, younger granitic intrusive rocks are also present in the region (Sheraton et al., 1987).
The crust of the Napier Complex formed throughout most of the Archean. Eoarchean protoliths for felsic orthogneisses are known from zircon dating at several localities in the Tula Mountains, i.e., Gage Ridge (Kusiak et al., 2013a; Guitreau et al., 2019), Mount Sones (Guitreau et al., 2019), Budd Peak and Mt. Jewell (Król et al., 2020); and at Aker Peaks in the western part of Kemp Land (Kusiak et al., 2021). Younger, Paleo- to Mesoarchean protolith ages for felsic orthogneisses were obtained at Mt. Riiser-Larsen (Hokada et al., 2003), ranging from 3267 ± 5 to 3073 ± 12 Ma in age. Mesoarchean zircon U-Pb ages have also been reported from several localities in the central and northern Napier Complex (Harley and Black, 1997; Kelly and Harley, 2005; Król et al., 2020). Although not precise, Rb-Sr whole-rock ages may indicate protolith formation at this time at Fyfe Hills (3120 +230/−180 Ma; Black et al., 1983b), Mount Tod in Amundsen Bay (2934 +196/−127 Ma; Black et al., 1983b), and at Mount Bride in the Napier Mountains (2840 +220/−280 Ma; Black and James, 1983).
The Napier Complex was locally metamorphosed at ∼ 2.8 Ga as demonstrated by several authors (e.g., Harley and Black, 1997; Hokada et al., 2003; Kelly and Harley, 2005; Kusiak et al., 2013a; Clark et al., 2018; Król et al., 2020). Circa 2850 Ma ages for metamorphic zircon were obtained from gneisses at Mt. Riiser-Larsen (Hokada et al., 2003) in the vicinity of Amundsen Bay, Dallwitz Nunatak (Kelly and Harley, 2005; Kusiak et al., 2013a) and Mount King (Król et al., 2020) in the Tula Mountains, and at Proclamation Island in the northern part of the complex (Kelly and Harley, 2005). Hokada et al. (2003) suggested, based on zircon dating, that this tectono-thermal event continued at least until 2790 Ma. A minimum magmatic age of 2788 ± 24 Ma has been obtained for another gneiss from Mt. King (Król et al., 2020), but its relationship to the ∼ 2.8 Ga metamorphic event remains unresolved. The only known protolith ages for orthogneisses that post-date the ∼ 2.8 Ga metamorphism are from localities in the south-western part of the Napier Complex: at Mt. Bergin (2711 ± 5 Ma) and Mt. Henry (2726 ± 6 Ma, Król et al., 2022); Fyfe Hills (∼ 2741 Ma, Horie et al., 2012) and Tonagh Island (2678 ± 8 Ma, Crowe et al., 2002; 2628 ± 12 Ma, Carson et al., 2002).
Metamorphism at high to ultra-high temperatures occurred at ∼ 2.5 Ga, with metamorphic zircon and monazite ages spanning over 150 Myr., from 2585 to 2420 Ma (Grew and Manton, 1979; Asami et al., 2002; Carson et al., 2002; Kelly and Harley, 2005; Suzuki et al., 2006; Horie et al., 2012; Harley, 2016; Clark et al., 2018; Król et al., 2020, 2022). The oldest vestige of this event is represented by zircon growth in anatectic leucosome from McIntyre Island at 2586 ± 8 Ma (Harley, 2016). Ages from metamorphic zircon between 2550 and 2520 Ma were obtained from Tonagh Island (Carson et al., 2002), Zircon Point (Kelly and Harley, 2005), Fyfe Hills (Horie et al., 2012) and recently from Mount King (Król et al., 2020), Mt Bergin and Mt. Douglas (Król et al., 2022). Zircon growth and/or modification until 2450 Ma has been demonstrated in numerous studies (Black et al., 1983a; Carson et al., 2002; Hokada et al., 2003; Kelly and Harley, 2005; Horie et al., 2012; Takehara et al., 2020; Król et al., 2020; Kusiak et al., 2021; Król et al., 2022). In some samples (e.g., Kelly and Harley, 2005; Król et al., 2020, 2022), two discrete stages of metamorphic zircon growth, at ∼ 2510 and 2480 Ma, have been identified through different Th-U compositions (for example at Budd Peak, Król et al., 2020; and at Mt. Bergin, Król et al., 2022). These two stages are present throughout the Napier Complex, as seen in the compilation of U-Pb zircon ages in Król et al. (2022) and references therein, but the exact process explaining this phenomenon is still not known. Age estimates from metamorphic zircon, monazite and xenotime (Black et al., 1984; Asami et al., 2002) as young as ∼ 2420 Ma have been attributed to slow cooling and/or post-peak fluid activity (e.g., Harley, 2016).
SAMPLES AND METHODOLOGY
Four samples representative of intermediate to felsic orthogneisses from the Napier Mountains (Fig. 1) were selected for this study from the archives of Geoscience Australia. The original geochemical and petrographic database of these samples can be found in Sheraton et al. (1987). The samples NMC02 (78285004 in database of Sheraton et al., 1987) and NMC03 (77283989) come from Grimsley Peaks (Fig. 1b). The former is a quartz-feldspar gneiss with potassic feldspar dominant over plagioclase. Orthopyroxene constitutes a minor phase, whereas zircon and opaque minerals are accessory phases. Orthopyroxene and potassic feldspar are commonly altered. Sample NMC03 is an orthopyroxene-quartz-plagioclase gneiss with accessory biotite, apatite, zircon and opaque minerals. Sample NNW01 (77284068) comes from Mount Marr and is a quartz-orthopyroxene-plagioclase gneiss with biotite, zircon and opaque minerals constituting the accessory phases. Sample NNW02 (77284064) from Johnston Peaks is an orthopyroxene-quartz-plagioclase gneiss, with abundant biotite and minor potassic feldspar. Apatite, zircon, and opaque minerals are accessory phases.
Fresh and compositionally uniform samples were selected and pulverized in an agate ball mill for whole-rock analyses of major and trace elements. Analyses were carried out by Bureau Veritas Minerals at ACME Analytical Laboratories, Vancouver, Canada. Major oxides were analyzed by X-ray fluorescence (XRF) spectrometry, whereas trace elements, including rare earth elements (REE), were analyzed by inductively-coupled plasma mass spectrometry (ICP-MS). The volatile content was estimated by loss on ignition (LOI), measured by titration.
For zircon geochronology, samples were reduced in a jaw crusher, sieved, and washed to remove the fines. The magnetic fraction was removed from the concentrate using Carpco and Frantz magnetic separators. Diiodomethane with a density of 3.32 g/cm3 was used to separate the heavy mineral fraction. Zircon grains were hand-picked under a binocular microscope and cast in epoxy resin, together with standard reference materials 91500 (80 ppm U, with an age of 1065 Ma, Wiedenbeck et al., 1995), M257 (561.3 Ma, Nasdala et al., 2008), and OG1 (3465 Ma, Stern et al., 2009). The mounts were ground to reveal the internal structure of the grains, then polished, cleaned in an ultrasonic bath, and coated with ∼ 30 nm of gold.
Zircon imaging and U-Th-Pb isotopic analyses were performed at the Swedish Museum of Natural History. Zircon grains were photographed in reflected light and imaged using a scanning electron microscope (Hitachi S4300) with BSE detector to examine the grain interiors and to choose analytical sites. A Secondary Ion Micro-Probe (SIMS) large geometry CAMECA IMS 1270e7 was used to carry out U-Th-Pb isotopic analyses. Analytical protocols for U-Pb broadly followed those described by Whitehouse and Kamber (2005) and references therein. An O2− primary beam with 23 kV incident energy (−13 kV primary, +10 kV secondary) was generated using an Oregon Physics H201 RF-plasma source and used to sputter zircon. For this study, the primary beam was operated in critically focussed (Gaussian) mode with a small raster retained during analysis to flatten the bottom of the analytical crater. The first analytical session used a 10 nA primary beam yielding a nominal spot size of ∼ 15 µm; the second used a 3 nA primary for a spot size of ∼ 10 µm. Pre-sputtering with a 25 µm raster for 60 seconds, centering of the secondary ion beam in the 3000 µm field aperture (FA), mass calibration optimisation, and optimisation of the secondary beam energy distribution were performed automatically for each run. Field aperture and energy adjustment were done using the 90Zr216O+ species at nominal mass 196 Da. Mass calibration of all peaks in the monocollection sequence was performed at the start of each session; within run mass calibration optimization scanned only the 90Zr216O+ peak, with small drift corrections applied to all mass stations in each run. A mass resolving power (M/ΔM) of ∼ 5400 was used to ensure adequate separation of Pb isotope peaks from nearby HfSi+ species. Ion signals were detected using an axial ion-counting electron multiplier. All analyses were run in fully automated chain sequences. Small within-run linear drift corrections (<0.5%/cycle) were applied to the inter-element ratios (Pb/U and UO2/U) based on the average from the calibration standard in each session (Jeon and Whitehouse, 2021). Data reduction followed the protocols described by Jeon and Whitehouse (2015) and assume a power law relationship between Pb+/U+ and UO2+/U+ ratios with an empirically derived slope in order to calculate actual Pb/U ratios based on those in the M257 zircon standard (Nasdala et al., 2008). Uranium concentrations and Th/U ratio were also referenced to the M257 standard. Common Pb corrections were made only when 204Pb counts statistically exceeded 3x average detector background and assume a 207Pb/206Pb ratio of 0.83 [equivalent to present day Stacey and Kramers (1975) model terrestrial Pb]. The choice of model age for common Pb has a negligible effect on age estimates for samples where the proportion of common 206Pb to total 206Pb is <1%. External spot-to-spot errors on measurements of the calibration standard M257 were propagated to analyses on unknown zircon samples. The Isoplot 3.75 software (Ludwig, 2012) was used to generate concordia plots and to calculate weighted mean ages.
Across both analytical sessions, 39 analyses of 91500 zircon yielded a weighted mean 207Pb/206Pb age of 1065 ± 3 Ma (95% confidence, MSWD = 1.12) and a concordia age of 1058 ± 3 Ma (2σ, MSWD = 1.0). The 14 analyses of OG1 exhibit some discordance attributed to Pb loss: 11 analyses yielding a weighted average 207Pb/206Pb age of 3469 ± 3 Ma (95% confidence, MSWD = 1.4).
RESULTS
Geochemistry
Geochemical results for the whole-rock analyses are provided in Table 1 and are compared with published data for other felsic orthogneisses in the Napier Complex (Sheraton et al., 1987; Król et al., 2020, 2022). Gneisses analyzed in this study are intermediate to felsic with SiO2 ranging from 60.3 to 73.9 wt%. Samples NMC03 and NNW02 plot in the granodiorite field on the Total Alkali-Silica (TAS) diagram (Fig. 2a), sample NNW01 plots as diorite, whereas sample NMC02 plots in the granite field. Samples NMC03 and NNW02 also plot in the tonalite field on the normative albite-anorthite-orthoclase triangle diagram (Fig. 2b) of Barker (1979; modified after O’Connor, 1965), whereas sample NMC02 plots as granite (Fig. 2b). The Alumina Saturation Index (A/CNK) ranges from 0.93 to 1.02, i.e., the samples are weakly peraluminous to metaluminous (Fig. 2c). Samples belong to the calc-alkaline series on the AFM diagram (Fig. 2d), with the exception of sample NNW01, which belongs to the tholeiite series. Samples NMC03, NNW01, and NNW02 have low K2O/Na2O <0.75 (Fig. 2e) and low K2O relative to Na2O + CaO. Sample NMCO2 has high K2O of 4.11 wt%, hence a high K2O/Na2O of 1.31. Samples NMC02 and NMC03 plot in the high-Al2O3 field of Halla et al. (2009), whereas the remaining two samples plot in the low Al2O3 field (Fig. 2f). Sample NMW01 has a much lower content of Al2O3 than NMW02 at a similar silica content. Two samples, NNW01 and NNW02, have high contents of mafic oxides (Fe2O3t + MgO + MnO + TiO2) of 8 and 19 wt%, respectively.
Table 1. Whole-rock major and trace element compositions of orthogneisses from the Napier Mountains
| Sample |
NMC02 |
NMC03 |
NNW01 |
NNW02 |
| (78285004) |
(77283989) |
(77284068) |
(77284064) |
| Grimsley Peaks |
Grimsley Peaks |
Mount Marr |
Johnston Peak |
| wt% |
| SiO2 |
73.9 |
69.4 |
60.3 |
62.2 |
| Al2O3 |
13.6 |
16.2 |
13.3 |
17.1 |
| Fe2O3t |
1.95 |
2.28 |
12.80 |
4.44 |
| CaO |
2.06 |
5.19 |
4.23 |
5.98 |
| MgO |
0.42 |
1.12 |
5.82 |
3.63 |
| Na2O |
3.14 |
3.79 |
2.91 |
3.48 |
| K2O |
4.11 |
0.69 |
0.54 |
1.70 |
| MnO |
0.02 |
0.03 |
0.14 |
0.07 |
| TiO2 |
0.20 |
0.47 |
0.93 |
0.60 |
| P2O5 |
0.04 |
0.05 |
0.05 |
0.14 |
| LOI |
0.05 |
0.03 |
0.00 |
0.00 |
| Total |
99.5 |
99.3 |
101.0 |
99.3 |
| ppm |
| Rb |
124 |
3.7 |
4.8 |
68.7 |
| Ba |
670 |
753 |
468 |
861 |
| Sr |
88.5 |
295 |
228 |
304 |
| Ga |
15.0 |
16.7 |
18.7 |
19.0 |
| Hf |
3.9 |
4.9 |
5.3 |
3.3 |
| Nb |
8.5 |
6.8 |
7.5 |
5.0 |
| Ta |
0.4 |
0.3 |
0.6 |
0.1 |
| U |
1.2 |
1.2 |
0.6 |
0.7 |
| Th |
13.3 |
0.4 |
11.0 |
1.5 |
| Pb |
2.8 |
2.5 |
2.2 |
1.3 |
| V |
17 |
61 |
168 |
89 |
| Cu |
1.9 |
29.8 |
20.7 |
0.9 |
| Ni |
1.3 |
12.7 |
34.5 |
68.1 |
| Zr |
133 |
203 |
195 |
134 |
| Y |
9.8 |
2.6 |
11.7 |
7.5 |
| La |
40.8 |
13.6 |
18.4 |
18.4 |
| Ce |
65.9 |
15.8 |
28.2 |
28.2 |
| Pr |
5.86 |
1.34 |
2.75 |
2.75 |
| Nd |
18.3 |
4.4 |
9.9 |
9.9 |
| Sm |
2.93 |
0.70 |
1.67 |
1.67 |
| Eu |
0.86 |
1.29 |
1.06 |
1.06 |
| Gd |
2.35 |
0.69 |
1.81 |
1.81 |
| Tb |
0.34 |
0.08 |
0.26 |
0.26 |
| Dy |
1.95 |
0.45 |
1.44 |
1.44 |
| Ho |
0.34 |
0.09 |
0.28 |
0.28 |
| Er |
0.91 |
0.30 |
0.88 |
0.88 |
| Tm |
0.12 |
0.04 |
0.11 |
0.11 |
| Yb |
0.83 |
0.38 |
0.66 |
0.66 |
| Lu |
0.14 |
0.06 |
0.11 |
0.11 |
| |
| K2O/Na2O |
2.68 |
3.33 |
3.14 |
3.14 |
| A/CNK |
1.02 |
0.99 |
1.02 |
0.93 |
| A/NK |
1.41 |
2.32 |
2.48 |
2.26 |
| Eu/Eu* |
0.16 |
0.14 |
0.16 |
0.16 |

Based on the earlier work of Sheraton and Black (1983) and Sheraton et al. (1985), Król et al. (2020, 2022) defined two chemical groups of felsic orthogneiss in the Tula, Raggatt and Scott Mountains of the western and south-western Napier Complex: Group 1 with (Y-HREE)sample/primitive mantle or S/PM <1 and (Nb-Ta)S/PM = 2-7; and Group 2 with higher Y-HREE (Y-HREES/PM = 3-4) and Nb-Ta (Nb-TaS/PM = ∼ 10). These groups are distinct on both the primitive mantle-normalized spider diagram (Fig. 3a) and the chondrite-normalized REE diagram (Fig. 3b). In this study, the analyzed samples have Nb-Ta-Y-HREE contents between Group 1 and Group 2, and thus they cannot be unambiguously assigned to either of these two groups. All samples have negative Ti and Nb-Ta anomalies, but with very variable Nb/Ta ratios. Samples NNW02 and NMC02 have negative P anomalies, whereas sample NNW01 has a positive anomaly (Fig. 3a). There are no systematic differences in terms of large ion lithophile (LIL) elements, with the samples showing highly variable Rb and Th contents of 3.7-123.5 and 0.4-13.3 ppm, respectively. The LREE patterns have steep slopes, with LaN/LuN ratios of 17-30. The pattern of sample NMC03 has a concave-upward slope between Gd and Lu. Similarly, sample NNW01 shows a slight rise between Tb and Lu. Samples NNW01 and NNW02 display moderate positive Eu anomalies, whereas sample NMC03 has a large positive anomaly. Sample NMC02 does not show an Eu anomaly.

Representative CL images of analyzed zircon grains are presented in Figure 4. Uranium-Th-Pb isotopic data are presented in Tables 2-5 and plotted on Tera-Wasserburg concordia diagrams (Fig. 5). The reported dates in the text refer to weighted mean 207Pb/206Pb ages with the errors at 2 sigma. Analyses are considered concordant if the error ellipse overlaps the concordia curve.

Table 2. U-Th-Pb data for sample NMC02 (78285004) from Grimsley Peaks
| Analysis |
|
|
|
|
|
Ratiosa |
Agesa |
|
| (Grain.spot) |
U
(ppm) |
Th
(ppm) |
Th/U |
Pb
(ppm) |
206Pbc
(%)b |
238U/206Pb |
±σ
(%) |
207Pb/206Pb |
±σ
(%) |
206Pb/238U |
±σ |
207Pb/206Pb |
±σ |
Conc.
(%)c |
| NMC02_29a* |
2091 |
222 |
0.11 |
1423.9 |
0.00 |
1.8070 |
0.64 |
0.201237 |
0.32 |
2839.3 |
14.7 |
2836.3 |
5.3 |
100.1 |
| NMC02_14a* |
261 |
83 |
0.32 |
183.9 |
{0.00} |
1.8259 |
0.72 |
0.200688 |
0.81 |
2815.5 |
16.5 |
2831.8 |
13.3 |
99.4 |
| NMC02_13b* |
664 |
251 |
0.38 |
490.0 |
{0.01} |
1.7654 |
1.14 |
0.200461 |
0.79 |
2893.2 |
26.7 |
2830.0 |
12.8 |
102.2 |
| NMC02_25a* |
258 |
282 |
1.09 |
206.9 |
0.01 |
1.8511 |
0.59 |
0.199587 |
0.25 |
2784.4 |
13.4 |
2822.8 |
4.0 |
98.6 |
| NMC02_18a* |
90 |
121 |
1.35 |
77.4 |
{0.01} |
1.8155 |
0.89 |
0.198934 |
0.74 |
2828.6 |
20.4 |
2817.5 |
12.1 |
100.4 |
| NMC02_42a |
3454 |
3034 |
0.88 |
3126.0 |
0.00 |
1.5805 |
0.57 |
0.198739 |
0.19 |
3160.4 |
14.4 |
2815.9 |
3.1 |
112.2 |
| NMC02_49a* |
1240 |
632 |
0.51 |
915.3 |
{0.00} |
1.8122 |
0.75 |
0.198582 |
0.55 |
2832.8 |
17.1 |
2814.6 |
9.0 |
100.6 |
| NMC02_47a |
991 |
600 |
0.61 |
751.1 |
{0.00} |
1.7975 |
0.63 |
0.198283 |
0.21 |
2851.5 |
14.6 |
2812.1 |
3.4 |
101.4 |
| NMC02_32a |
951 |
635 |
0.67 |
735.5 |
0.00 |
1.7834 |
0.63 |
0.198230 |
0.43 |
2869.6 |
14.7 |
2811.7 |
7.0 |
102.1 |
| NMC02_31a |
2605 |
1725 |
0.66 |
2182.2 |
0.00 |
1.6364 |
0.86 |
0.197987 |
0.20 |
3074.4 |
21.0 |
2809.7 |
3.3 |
109.4 |
| NMC02_33a |
1559 |
1052 |
0.67 |
1183.4 |
0.00 |
1.8176 |
0.59 |
0.197717 |
0.08 |
2825.9 |
13.5 |
2807.4 |
1.4 |
100.7 |
| NMC02_56a |
597 |
274 |
0.46 |
437.3 |
{0.01} |
1.8031 |
0.81 |
0.197648 |
0.53 |
2844.3 |
18.6 |
2806.9 |
8.6 |
101.3 |
| NMC02_23c |
778 |
319 |
0.41 |
569.2 |
0.24 |
1.7897 |
0.89 |
0.197387 |
0.89 |
2861.5 |
20.6 |
2804.7 |
14.6 |
102.0 |
| NMC02_27a |
904 |
599 |
0.66 |
682.4 |
0.01 |
1.8231 |
1.15 |
0.197338 |
0.24 |
2819.0 |
26.3 |
2804.3 |
3.9 |
100.5 |
| NMC02_28a |
998 |
735 |
0.74 |
759.6 |
0.00 |
1.8361 |
0.68 |
0.197321 |
0.39 |
2802.8 |
15.4 |
2804.2 |
6.4 |
100.0 |
| NMC02_23a |
2777 |
1033 |
0.37 |
2090.5 |
0.00 |
1.7196 |
0.66 |
0.197133 |
0.17 |
2955.0 |
15.5 |
2802.6 |
2.9 |
105.4 |
| NMC02_17a |
2719 |
2453 |
0.90 |
2235.3 |
0.00 |
1.7537 |
0.80 |
0.197124 |
0.22 |
2908.7 |
18.7 |
2802.5 |
3.7 |
103.8 |
| NMC02_10a |
525 |
131 |
0.25 |
362.7 |
0.02 |
1.8308 |
0.72 |
0.196791 |
0.43 |
2809.4 |
16.5 |
2799.8 |
7.1 |
100.3 |
| NMC02_13a |
814 |
368 |
0.45 |
604.6 |
0.00 |
1.7702 |
0.72 |
0.196690 |
0.25 |
2886.8 |
16.9 |
2798.9 |
4.1 |
103.1 |
| NMC02_48a |
201 |
316 |
1.57 |
172.4 |
0.04 |
1.8990 |
0.91 |
0.196294 |
0.48 |
2727.1 |
20.2 |
2795.6 |
7.8 |
97.5 |
| NMC02_55a |
656 |
293 |
0.45 |
472.2 |
0.03 |
1.8311 |
0.74 |
0.196006 |
0.69 |
2809.1 |
16.9 |
2793.2 |
11.3 |
100.6 |
| NMC02_57a |
287 |
196 |
0.68 |
218.0 |
{0.00} |
1.8139 |
0.94 |
0.195768 |
0.79 |
2830.6 |
21.6 |
2791.2 |
12.9 |
101.4 |
| NMC02_2b |
454 |
42 |
0.09 |
300.0 |
0.10 |
1.8497 |
0.73 |
0.195058 |
0.83 |
2786.1 |
16.5 |
2785.3 |
13.6 |
100.0 |
| NMC02_43b |
1830 |
57 |
0.03 |
1178.3 |
0.00 |
1.8692 |
0.67 |
0.194727 |
0.28 |
2762.4 |
15.1 |
2782.5 |
4.6 |
99.3 |
| NMC02_57b |
322 |
230 |
0.71 |
242.8 |
{0.01} |
1.8343 |
0.77 |
0.194333 |
0.56 |
2805.1 |
17.5 |
2779.2 |
9.3 |
100.9 |
| NMC02_46a |
608 |
157 |
0.26 |
415.9 |
0.04 |
1.8508 |
0.73 |
0.193943 |
0.52 |
2784.8 |
16.5 |
2775.9 |
8.4 |
100.3 |
| NMC02_30a |
614 |
43 |
0.07 |
390.5 |
0.01 |
1.9086 |
0.79 |
0.193602 |
0.47 |
2715.9 |
17.5 |
2773.0 |
7.8 |
97.9 |
| NMC02_57c |
1410 |
125 |
0.09 |
928.0 |
0.03 |
1.8491 |
0.62 |
0.193101 |
0.49 |
2786.8 |
14.0 |
2768.8 |
8.0 |
100.7 |
| NMC02_33b |
514 |
270 |
0.52 |
350.6 |
0.01 |
1.9683 |
1.04 |
0.192967 |
0.38 |
2648.3 |
22.5 |
2767.6 |
6.2 |
95.7 |
| NMC02_55b |
739 |
374 |
0.51 |
522.4 |
{0.00} |
1.8861 |
0.93 |
0.192754 |
0.34 |
2742.3 |
20.9 |
2765.8 |
5.6 |
99.1 |
| NMC02_09b |
5761 |
1679 |
0.29 |
3947.7 |
0.01 |
1.8398 |
1.25 |
0.189930 |
0.17 |
2798.2 |
28.3 |
2741.6 |
2.8 |
102.1 |
| NMC02_43a* |
1163 |
182 |
0.16 |
761.2 |
{0.00} |
1.8902 |
0.66 |
0.188819 |
0.51 |
2737.4 |
14.8 |
2731.9 |
8.5 |
100.2 |
| NMC02_03a* |
1352 |
65 |
0.05 |
878.1 |
0.02 |
1.8501 |
0.73 |
0.188692 |
0.27 |
2785.5 |
16.5 |
2730.8 |
4.4 |
102.0 |
| NMC02_56b* |
1017 |
275 |
0.27 |
678.7 |
0.01 |
1.8888 |
0.82 |
0.188328 |
0.77 |
2739.0 |
18.3 |
2727.6 |
12.7 |
100.4 |
| NMC02_39a* |
4885 |
246 |
0.05 |
3232.9 |
0.02 |
1.8158 |
0.58 |
0.188309 |
0.11 |
2828.1 |
13.3 |
2727.4 |
1.8 |
103.7 |
| NMC02_60a* |
1439 |
81 |
0.06 |
904.6 |
0.01 |
1.9130 |
0.60 |
0.187832 |
0.57 |
2710.7 |
13.4 |
2723.3 |
9.4 |
99.5 |
| NMC02_44a* |
1873 |
1427 |
0.76 |
1432.8 |
0.02 |
1.8219 |
0.63 |
0.187324 |
0.30 |
2820.5 |
14.5 |
2718.8 |
4.9 |
103.7 |
| NMC02_11a |
958 |
81 |
0.08 |
603.9 |
0.00 |
1.9193 |
0.63 |
0.185990 |
0.49 |
2703.5 |
14.0 |
2707.0 |
8.0 |
99.9 |
| NMC02_24a |
6056 |
2184 |
0.36 |
7079.5 |
0.01 |
1.0904 |
3.41 |
0.185968 |
0.25 |
4195.5 |
106.1 |
2706.8 |
4.1 |
155.0 |
| NMC02_23b |
1956 |
621 |
0.32 |
1322.4 |
0.00 |
1.8825 |
0.76 |
0.184689 |
0.49 |
2746.5 |
17.1 |
2695.4 |
8.1 |
101.9 |
| NMC02_15b |
2610 |
726 |
0.28 |
1674.7 |
0.07 |
1.9686 |
0.62 |
0.182193 |
0.17 |
2648.0 |
13.4 |
2672.9 |
2.9 |
99.1 |
| NMC02_53a |
1476 |
529 |
0.36 |
935.6 |
0.04 |
2.0247 |
2.10 |
0.181173 |
0.84 |
2587.6 |
44.8 |
2663.6 |
13.9 |
97.1 |
| NMC02_10b |
1396 |
77 |
0.06 |
862.4 |
0.01 |
1.9363 |
0.58 |
0.180945 |
0.32 |
2684.1 |
12.8 |
2661.6 |
5.3 |
100.8 |
| NMC02_20b |
4588 |
943 |
0.21 |
2812.3 |
0.01 |
2.0137 |
0.67 |
0.179824 |
0.11 |
2599.2 |
14.2 |
2651.2 |
1.8 |
98.0 |
| NMC02_20a |
3339 |
618 |
0.19 |
2276.2 |
0.02 |
1.7992 |
0.96 |
0.179031 |
0.17 |
2849.3 |
22.2 |
2643.9 |
2.8 |
107.8 |
| NMC02_15a |
3057 |
920 |
0.30 |
2111.7 |
0.01 |
1.8236 |
0.82 |
0.178084 |
0.37 |
2818.4 |
18.7 |
2635.1 |
6.2 |
107.0 |
| NMC02_45a |
2884 |
2105 |
0.73 |
2160.8 |
0.22 |
2.0412 |
0.90 |
0.177431 |
0.37 |
2570.3 |
19.2 |
2629.0 |
6.2 |
97.8 |
| NMC02_40a |
1514 |
201 |
0.13 |
921.6 |
0.02 |
2.0293 |
0.64 |
0.176667 |
0.67 |
2582.7 |
13.6 |
2621.8 |
11.2 |
98.5 |
| NMC02_44b |
1991 |
174 |
0.09 |
1194.8 |
0.03 |
1.9916 |
0.67 |
0.172263 |
0.27 |
2622.8 |
14.5 |
2579.8 |
4.6 |
101.7 |
| NMC02_41a |
5668 |
438 |
0.08 |
3363.6 |
0.05 |
2.0085 |
0.88 |
0.169047 |
0.34 |
2604.7 |
19.0 |
2548.2 |
5.7 |
102.2 |
| NMC02_21a |
1016 |
97 |
0.10 |
589.6 |
0.01 |
2.0599 |
0.71 |
0.168724 |
0.66 |
2551.0 |
14.9 |
2545.0 |
11.1 |
100.2 |
| NMC02_9b |
1448 |
94 |
0.07 |
834.3 |
0.01 |
2.0595 |
0.63 |
0.167696 |
0.36 |
2551.4 |
13.2 |
2534.8 |
6.1 |
100.7 |
| NMC02_50b |
1404 |
74 |
0.05 |
796.6 |
{0.00} |
2.0819 |
0.71 |
0.166749 |
0.41 |
2528.7 |
14.9 |
2525.3 |
7.0 |
100.1 |
| NMC02_46b |
2715 |
132 |
0.05 |
1719.1 |
0.01 |
1.8871 |
0.74 |
0.165769 |
0.14 |
2741.1 |
16.6 |
2515.4 |
2.4 |
109.0 |
| NMC02_27b |
1455 |
152 |
0.10 |
820.3 |
0.00 |
2.1164 |
0.57 |
0.164284 |
0.20 |
2494.5 |
11.9 |
2500.2 |
3.3 |
99.8 |
| NMC02_21b |
1934 |
288 |
0.15 |
1156.0 |
0.00 |
2.0168 |
0.60 |
0.164131 |
0.37 |
2595.9 |
12.8 |
2498.7 |
6.3 |
103.9 |
| NMC02_52a |
2307 |
114 |
0.05 |
1304.5 |
{0.00} |
2.0825 |
0.66 |
0.164023 |
0.16 |
2528.1 |
13.7 |
2497.6 |
2.7 |
101.2 |
| NMC02_43c |
2550 |
113 |
0.04 |
1447.8 |
{0.00} |
2.0708 |
0.66 |
0.163674 |
0.27 |
2539.9 |
13.9 |
2494.0 |
4.6 |
101.8 |
| NMC02_50a |
1487 |
76 |
0.05 |
829.4 |
{0.00} |
2.1104 |
0.66 |
0.163087 |
0.24 |
2500.4 |
13.8 |
2487.9 |
4.0 |
100.5 |
| NMC02_07a |
2192 |
72 |
0.03 |
1236.2 |
0.01 |
2.0785 |
0.59 |
0.163003 |
0.08 |
2532.2 |
12.4 |
2487.0 |
1.4 |
101.8 |
| NMC02_16a |
1508 |
183 |
0.12 |
860.1 |
0.00 |
2.0968 |
0.58 |
0.162709 |
0.10 |
2513.8 |
12.0 |
2484.0 |
1.7 |
101.2 |
| NMC02_06a* |
2109 |
130 |
0.06 |
1176.6 |
0.00 |
2.1146 |
0.57 |
0.162644 |
0.10 |
2496.3 |
11.9 |
2483.3 |
1.7 |
100.5 |
| NMC02_54b* |
2824 |
131 |
0.05 |
1655.0 |
{0.00} |
2.0050 |
0.58 |
0.162462 |
0.24 |
2608.4 |
12.5 |
2481.4 |
4.1 |
105.1 |
| NMC02_51a* |
3902 |
605 |
0.16 |
2428.1 |
0.04 |
2.0386 |
0.85 |
0.162407 |
0.14 |
2573.0 |
18.2 |
2480.9 |
2.4 |
103.7 |
| NMC02_35a* |
2167 |
364 |
0.17 |
1233.1 |
0.00 |
2.1245 |
0.57 |
0.162308 |
0.13 |
2486.6 |
11.9 |
2479.8 |
2.2 |
100.3 |
| NMC02_32b* |
2097 |
113 |
0.05 |
1179.4 |
0.00 |
2.0924 |
0.61 |
0.162251 |
0.17 |
2518.2 |
12.7 |
2479.2 |
2.8 |
101.6 |
| NMC02_19a* |
2971 |
157 |
0.05 |
1674.4 |
0.00 |
2.0883 |
0.57 |
0.162202 |
0.08 |
2522.3 |
12.0 |
2478.7 |
1.3 |
101.8 |
| NMC02_58a* |
2222 |
128 |
0.06 |
1277.8 |
0.05 |
2.0511 |
0.66 |
0.162187 |
0.29 |
2560.1 |
13.9 |
2478.6 |
4.9 |
103.3 |
| NMC02_36b* |
2441 |
127 |
0.05 |
1345.5 |
0.00 |
2.1350 |
0.59 |
0.162120 |
0.09 |
2476.5 |
12.1 |
2477.9 |
1.6 |
99.9 |
| NMC02_56c |
1500 |
185 |
0.12 |
859.9 |
0.01 |
2.0855 |
0.61 |
0.161840 |
0.23 |
2525.0 |
12.7 |
2475.0 |
3.9 |
102.0 |
| NMC02_26a |
1893 |
54 |
0.03 |
1017.9 |
0.10 |
2.1762 |
1.13 |
0.161215 |
0.16 |
2437.4 |
23.0 |
2468.4 |
2.8 |
98.7 |
| NMC02_59a |
266 |
141 |
0.53 |
161.2 |
0.04 |
2.1545 |
1.10 |
0.160865 |
0.48 |
2457.9 |
22.6 |
2464.8 |
8.1 |
99.7 |
| NMC02_46c |
2422 |
113 |
0.05 |
1325.0 |
0.03 |
2.1404 |
0.69 |
0.157569 |
0.16 |
2471.2 |
14.3 |
2429.7 |
2.8 |
101.7 |
aValues corrected for common Pb.
bPercentage 206Pb which is non-radiogenic, calculated assuming present-day Stacey and Kramers (1975) common Pb. Figures in parentheses are given when no correction has been applied as 204Pb counts are statistically insignificant.
cConc. (%): concordance = 100 + 100 * [(206Pb/238U)/(207Pb/206Pb) − 1], where ratios refers to age.
*Analyses used for weighted mean 207Pb/206Pb age.
Table 3. U-Th-Pb data for sample NMC03 (77283989) from Grimsley Peaks
| Analysis |
|
|
|
|
|
Ratiosa |
Agesa |
|
| (Grain.spot) |
U
(ppm) |
Th
(ppm) |
Th/U |
Pb
(ppm) |
206Pbc
(%)b |
238U/206Pb |
±σ
(%) |
207Pb/206Pb |
±σ
(%) |
206Pb/238U |
±σ |
207Pb/206Pb |
±σ |
Conc.
(%)c |
| NMC03_01a |
1249 |
7 |
0.01 |
854.6 |
0.06 |
1.7927 |
0.65 |
0.224755 |
0.24 |
2857.6 |
14.9 |
3015.1 |
3.9 |
94.8 |
| NMC03_03a |
913 |
164 |
0.18 |
595.4 |
0.07 |
1.9049 |
0.83 |
0.203962 |
0.37 |
2720.2 |
18.4 |
2858.2 |
6.1 |
95.2 |
| NMC03_03b |
1553 |
155 |
0.10 |
1015.5 |
0.01 |
1.8699 |
1.21 |
0.195237 |
0.71 |
2761.6 |
27.3 |
2786.8 |
11.6 |
99.1 |
| NMC03_05b |
566 |
80 |
0.14 |
315.7 |
0.00 |
2.1579 |
0.61 |
0.163390 |
0.22 |
2454.6 |
12.4 |
2491.0 |
3.7 |
98.5 |
| NMC03_06a |
182 |
97 |
0.54 |
161.8 |
{0.01} |
1.5647 |
0.72 |
0.250889 |
0.64 |
3185.5 |
18.2 |
3190.4 |
10.2 |
99.8 |
| NMC03_06b* |
215 |
131 |
0.61 |
195.8 |
{0.00} |
1.5611 |
0.71 |
0.257707 |
0.62 |
3191.3 |
18.0 |
3232.7 |
9.8 |
98.7 |
| NMC03_07a |
2574 |
117 |
0.05 |
1067.3 |
0.09 |
2.8221 |
1.78 |
0.157317 |
0.93 |
1955.3 |
30.1 |
2427.0 |
15.8 |
80.6 |
| NMC03_07b |
2656 |
295 |
0.11 |
903.3 |
0.25 |
3.4183 |
0.69 |
0.132081 |
0.26 |
1654.2 |
10.1 |
2125.8 |
4.6 |
77.8 |
| NMC03_08a* |
314 |
206 |
0.66 |
275.5 |
0.02 |
1.6330 |
0.78 |
0.253571 |
0.27 |
3079.5 |
19.1 |
3207.2 |
4.3 |
96.0 |
| NMC03_09a |
723 |
104 |
0.14 |
402.0 |
0.03 |
2.1582 |
0.64 |
0.160752 |
0.16 |
2454.3 |
13.1 |
2463.6 |
2.6 |
99.6 |
| NMC03_09b |
2965 |
230 |
0.08 |
1131.2 |
0.37 |
3.0282 |
0.66 |
0.134226 |
0.32 |
1839.5 |
10.5 |
2154.0 |
5.5 |
85.4 |
| NMC03_10a |
257 |
123 |
0.48 |
208.8 |
{0.01} |
1.6790 |
0.70 |
0.240323 |
0.64 |
3012.0 |
16.8 |
3122.1 |
10.2 |
96.5 |
| NMC03_11b* |
201 |
36 |
0.18 |
115.0 |
0.02 |
2.1165 |
0.63 |
0.162208 |
0.27 |
2494.4 |
13.0 |
2478.8 |
4.6 |
100.6 |
| NMC03_12a* |
458 |
109 |
0.24 |
391.7 |
0.00 |
1.5385 |
0.76 |
0.254358 |
0.65 |
3228.1 |
19.3 |
3212.1 |
10.2 |
100.5 |
| NMC03_13a |
1093 |
235 |
0.21 |
625.1 |
0.00 |
2.1352 |
0.62 |
0.161794 |
0.12 |
2476.3 |
12.7 |
2474.5 |
2.1 |
100.1 |
| NMC03_16a |
2403 |
27 |
0.01 |
1155.7 |
0.05 |
2.4400 |
1.37 |
0.170002 |
0.66 |
2214.2 |
25.8 |
2557.7 |
11.0 |
86.6 |
| NMC03_17a* |
486 |
125 |
0.26 |
279.5 |
0.00 |
2.1439 |
0.60 |
0.162675 |
0.17 |
2467.9 |
12.4 |
2483.7 |
2.9 |
99.4 |
| NMC03_17b |
91 |
17 |
0.18 |
51.0 |
{0.00} |
2.1551 |
0.68 |
0.164383 |
0.40 |
2457.3 |
14.0 |
2501.2 |
6.7 |
98.2 |
| NMC03_18a* |
294 |
134 |
0.45 |
261.1 |
0.00 |
1.5471 |
0.67 |
0.254491 |
0.32 |
3214.0 |
17.1 |
3212.9 |
5.1 |
100.0 |
| NMC03_18b* |
329 |
154 |
0.47 |
290.2 |
{0.00} |
1.5642 |
0.70 |
0.255031 |
0.82 |
3186.2 |
17.7 |
3216.3 |
12.9 |
99.1 |
| NMC03_18c |
1904 |
380 |
0.20 |
867.4 |
0.66 |
2.6260 |
0.69 |
0.142472 |
0.32 |
2080.0 |
12.3 |
2257.5 |
5.6 |
92.1 |
| NMC03_19a |
1492 |
85 |
0.06 |
794.5 |
0.02 |
2.2403 |
0.78 |
0.180782 |
0.24 |
2379.1 |
15.6 |
2660.1 |
3.9 |
89.4 |
| NMC03_20b |
637 |
550 |
0.86 |
553.3 |
0.09 |
1.6816 |
0.73 |
0.232786 |
0.34 |
3008.4 |
17.5 |
3071.3 |
5.4 |
98.0 |
| NMC03_21a |
1703 |
28 |
0.02 |
1079.9 |
0.01 |
1.8918 |
0.65 |
0.195074 |
0.25 |
2735.5 |
14.4 |
2785.4 |
4.2 |
98.2 |
| NMC03_22a |
1070 |
108 |
0.10 |
736.9 |
0.05 |
1.8058 |
1.54 |
0.221481 |
1.31 |
2840.9 |
35.4 |
2991.5 |
21.1 |
95.0 |
| NMC03_24a |
1141 |
14 |
0.01 |
764.5 |
0.01 |
1.8025 |
0.61 |
0.204499 |
0.29 |
2845.0 |
14.1 |
2862.4 |
4.8 |
99.4 |
| NMC03_25a |
4581 |
574 |
0.13 |
905.7 |
0.09 |
5.6604 |
1.05 |
0.083075 |
0.67 |
1048.7 |
10.1 |
1271.0 |
13.0 |
82.5 |
| NMC03_26a |
1215 |
219 |
0.18 |
674.3 |
0.01 |
2.1827 |
0.61 |
0.161430 |
0.11 |
2431.3 |
12.3 |
2470.7 |
1.9 |
98.4 |
| NMC03_27a |
143 |
87 |
0.61 |
123.1 |
{0.01} |
1.6370 |
0.89 |
0.245864 |
0.91 |
3073.5 |
21.7 |
3158.3 |
14.4 |
97.3 |
| NMC03_28a* |
635 |
462 |
0.73 |
580.8 |
0.02 |
1.5811 |
0.75 |
0.253359 |
0.39 |
3159.3 |
18.7 |
3205.9 |
6.1 |
98.5 |
| NMC03_30a* |
340 |
206 |
0.61 |
314.8 |
0.07 |
1.5283 |
0.78 |
0.257837 |
0.76 |
3245.1 |
19.9 |
3233.5 |
12.0 |
100.4 |
| NMC03_31a |
99 |
34 |
0.34 |
66.8 |
{0.02} |
1.9244 |
0.98 |
0.201275 |
1.06 |
2697.6 |
21.6 |
2836.6 |
17.4 |
95.1 |
| NMC03_33a* |
690 |
195 |
0.28 |
394.6 |
0.01 |
2.1710 |
0.60 |
0.162478 |
0.15 |
2442.3 |
12.3 |
2481.6 |
2.5 |
98.4 |
| NMC03_34a |
1131 |
60 |
0.05 |
663.7 |
0.03 |
2.0484 |
1.49 |
0.188391 |
0.47 |
2562.8 |
31.6 |
2728.2 |
7.8 |
93.9 |
| NMC03_35a |
1576 |
21 |
0.01 |
1054.9 |
0.01 |
1.8034 |
0.97 |
0.203991 |
0.30 |
2843.9 |
22.3 |
2858.4 |
4.8 |
99.5 |
| NMC03_35b |
1304 |
18 |
0.01 |
856.4 |
0.02 |
1.8344 |
0.91 |
0.201148 |
0.47 |
2805.0 |
20.8 |
2835.5 |
7.6 |
98.9 |
| NMC03_37a |
1398 |
33 |
0.02 |
814.2 |
0.05 |
2.0650 |
0.65 |
0.196307 |
0.32 |
2545.8 |
13.6 |
2795.7 |
5.2 |
91.1 |
| NMC03_38a |
3568 |
234 |
0.07 |
1040.0 |
0.75 |
3.8863 |
0.85 |
0.110699 |
0.48 |
1476.1 |
11.2 |
1810.9 |
8.8 |
81.5 |
| NMC03_39a |
1528 |
32 |
0.02 |
949.7 |
0.08 |
1.9619 |
0.81 |
0.216827 |
0.66 |
2655.4 |
17.6 |
2957.3 |
10.7 |
89.8 |
| NMC03_40a |
252 |
294 |
1.16 |
242.5 |
{0.01} |
1.6202 |
0.92 |
0.246709 |
0.44 |
3098.8 |
22.8 |
3163.8 |
7.0 |
97.9 |
| NMC03_41a |
1616 |
501 |
0.31 |
1061.3 |
0.08 |
1.9490 |
0.80 |
0.205460 |
1.02 |
2669.8 |
17.4 |
2870.1 |
16.6 |
93.0 |
| NMC03_41b |
2281 |
60 |
0.03 |
1152.0 |
0.01 |
2.3390 |
0.75 |
0.171322 |
0.48 |
2294.6 |
14.5 |
2570.6 |
8.0 |
89.3 |
| NMC03_42a |
893 |
17 |
0.02 |
563.6 |
0.01 |
1.8912 |
0.82 |
0.189606 |
0.56 |
2736.2 |
18.2 |
2738.7 |
9.2 |
99.9 |
| NMC03_43b |
1512 |
28 |
0.02 |
937.0 |
0.06 |
1.9334 |
0.67 |
0.194580 |
0.55 |
2687.4 |
14.8 |
2781.3 |
9.0 |
96.6 |
| NMC03_44a* |
832 |
878 |
1.06 |
824.0 |
{0.00} |
1.5532 |
0.72 |
0.253680 |
0.25 |
3204.1 |
18.2 |
3207.9 |
3.9 |
99.9 |
| NMC03_45a |
1505 |
69 |
0.05 |
769.1 |
0.03 |
2.3165 |
0.82 |
0.171043 |
0.52 |
2313.3 |
15.9 |
2567.9 |
8.7 |
90.1 |
| NMC03_46a |
684 |
990 |
1.45 |
686.9 |
0.02 |
1.6251 |
0.74 |
0.244367 |
0.23 |
3091.3 |
18.2 |
3148.6 |
3.6 |
98.2 |
| NMC03_48a |
351 |
161 |
0.46 |
273.2 |
{0.01} |
1.7328 |
1.30 |
0.225908 |
0.61 |
2936.9 |
30.6 |
3023.3 |
9.7 |
97.1 |
| NMC03_48b |
1000 |
87 |
0.09 |
616.8 |
0.11 |
1.9551 |
1.86 |
0.185067 |
0.25 |
2663.0 |
40.6 |
2698.8 |
4.2 |
98.7 |
| NMC03_49a |
2497 |
455 |
0.18 |
1217.8 |
0.01 |
2.5380 |
0.97 |
0.193673 |
0.47 |
2141.4 |
17.7 |
2773.6 |
7.8 |
77.2 |
| NMC03_50a |
904 |
144 |
0.16 |
743.8 |
0.00 |
1.5682 |
1.02 |
0.249614 |
0.41 |
3179.9 |
25.6 |
3182.3 |
6.5 |
99.9 |
| NMC03_51a |
1378 |
57 |
0.04 |
780.1 |
0.08 |
2.0907 |
0.61 |
0.172682 |
0.33 |
2519.9 |
12.7 |
2583.8 |
5.4 |
97.5 |
| NMC03_51b* |
551 |
138 |
0.25 |
317.7 |
0.02 |
2.1301 |
0.72 |
0.162256 |
0.42 |
2481.2 |
14.9 |
2479.3 |
7.0 |
100.1 |
| NMC03_53a |
1761 |
678 |
0.38 |
1144.2 |
0.16 |
2.0465 |
0.85 |
0.221550 |
0.29 |
2564.8 |
18.0 |
2992.0 |
4.6 |
85.7 |
| NMC03_53b* |
1888 |
396 |
0.21 |
1099.5 |
0.01 |
2.0924 |
1.17 |
0.161462 |
0.58 |
2518.2 |
24.4 |
2471.0 |
9.8 |
101.9 |
| NMC03_54a |
161 |
67 |
0.42 |
131.6 |
0.05 |
1.6424 |
1.19 |
0.241205 |
0.46 |
3065.5 |
29.0 |
3127.9 |
7.3 |
98.0 |
| NMC03_55a |
197 |
132 |
0.67 |
169.9 |
{0.02} |
1.6388 |
1.01 |
0.236567 |
0.51 |
3070.8 |
24.7 |
3097.0 |
8.1 |
99.2 |
| NMC03_55b |
1300 |
59 |
0.05 |
845.3 |
0.01 |
1.8517 |
0.79 |
0.192079 |
0.20 |
2783.6 |
17.9 |
2760.0 |
3.3 |
100.9 |
| NMC03_56a |
1398 |
101 |
0.07 |
925.6 |
{0.00} |
1.8297 |
0.77 |
0.193487 |
0.19 |
2810.8 |
17.6 |
2772.0 |
3.1 |
101.4 |
aValues corrected for common Pb.
bPercentage 206Pb which is non-radiogenic, calculated assuming present-day Stacey and Kramers (1975) common Pb. Figures in parentheses are given when no correction has been applied as 204Pb counts are statistically insignificant.
cConc. (%): concordance = 100 + 100 * [(206Pb/238U)/(207Pb/206Pb) − 1], where ratios refers to age.
*Analyses used for weighted mean 207Pb/206Pb age.
Table 4. U-Th-Pb data for sample NNW01 (77284068) from Mount Marr
| Analysis |
|
|
|
|
|
Ratiosa |
Agesa |
|
| (Grain.spot) |
U
(ppm) |
Th
(ppm) |
Th/U |
Pb |
206Pbc
(%)b |
238U/206Pb |
±σ
(%) |
207Pb/206Pb |
±σ
(%) |
206Pb/238U |
±σ |
207Pb/206Pb |
±σ |
Conc.
(%)c |
| NNW01_01a |
1740 |
1368 |
0.79 |
1145.7 |
0.01 |
2.0978 |
0.64 |
0.16544 |
0.10 |
2512.6 |
13.3 |
2511.5 |
1.7 |
100.0 |
| NNW01_02a |
1254 |
216 |
0.17 |
899.7 |
0.01 |
1.6987 |
1.04 |
0.18000 |
0.31 |
2984.0 |
24.8 |
2652.5 |
5.2 |
112.5 |
| NNW01_02b |
506 |
195 |
0.39 |
355.9 |
0.01 |
1.8300 |
0.76 |
0.18954 |
0.62 |
2810.3 |
17.3 |
2737.8 |
10.2 |
102.6 |
| NNW01_03a |
674 |
901 |
1.34 |
497.7 |
0.01 |
2.0698 |
0.94 |
0.16651 |
0.15 |
2540.8 |
19.7 |
2522.4 |
2.5 |
100.7 |
| NNW01_04a |
243 |
212 |
0.87 |
169.6 |
0.02 |
2.0137 |
0.66 |
0.17844 |
0.80 |
2598.8 |
14.0 |
2637.3 |
13.3 |
98.5 |
| NNW01_04b |
324 |
201 |
0.62 |
260.1 |
{0.00} |
1.7275 |
0.76 |
0.21800 |
0.99 |
2944.2 |
18.0 |
2966.0 |
15.9 |
99.3 |
| NNW01_05a |
269 |
145 |
0.54 |
167.1 |
{0.01} |
2.1168 |
0.60 |
0.16564 |
0.30 |
2494.1 |
12.4 |
2514.1 |
5.0 |
99.2 |
| NNW01_06a* |
673 |
464 |
0.69 |
421.1 |
0.01 |
2.1587 |
0.58 |
0.16203 |
0.15 |
2453.7 |
11.9 |
2476.5 |
2.5 |
99.1 |
| NNW01_07b* |
939 |
358 |
0.38 |
549.1 |
0.00 |
2.1652 |
0.57 |
0.16168 |
0.13 |
2447.7 |
11.6 |
2473.2 |
2.2 |
99.0 |
| NNW01_08a* |
644 |
472 |
0.73 |
406.7 |
0.01 |
2.1597 |
0.58 |
0.16305 |
0.41 |
2452.7 |
11.8 |
2486.9 |
6.9 |
98.6 |
| NNW01_09b |
169 |
197 |
1.16 |
116.8 |
{0.01} |
2.1391 |
0.60 |
0.16002 |
0.30 |
2472.5 |
12.4 |
2455.8 |
5.1 |
100.7 |
| NNW01_10a |
198 |
137 |
0.69 |
125.7 |
0.01 |
2.1385 |
0.64 |
0.16832 |
0.40 |
2472.8 |
13.2 |
2540.2 |
6.7 |
97.3 |
| NNW01_11a |
153 |
136 |
0.89 |
106.0 |
{0.01} |
2.0380 |
0.63 |
0.17279 |
0.74 |
2573.6 |
13.4 |
2584.9 |
12.3 |
99.6 |
| NNW01_12a |
2617 |
599 |
0.23 |
1611.2 |
0.00 |
1.9949 |
1.42 |
0.16660 |
0.45 |
2619.2 |
30.6 |
2523.7 |
7.6 |
103.8 |
| NNW01_13a |
435 |
441 |
1.01 |
294.1 |
0.01 |
2.1316 |
0.64 |
0.16338 |
0.22 |
2479.5 |
13.2 |
2490.2 |
3.7 |
99.6 |
| NNW01_14a |
71 |
25 |
0.35 |
47.5 |
{0.01} |
1.9168 |
0.72 |
0.18703 |
0.52 |
2706.4 |
16.0 |
2716.2 |
8.5 |
99.6 |
| NNW01_15a |
360 |
385 |
1.07 |
271.1 |
0.01 |
1.9552 |
0.63 |
0.18335 |
0.20 |
2662.5 |
13.8 |
2682.7 |
3.3 |
99.2 |
| NNW01_17a* |
169 |
191 |
1.13 |
114.0 |
{0.01} |
2.1881 |
0.74 |
0.16219 |
0.30 |
2426.4 |
14.9 |
2478.6 |
5.1 |
97.9 |
| NNW01_17b* |
561 |
380 |
0.68 |
347.5 |
0.01 |
2.1838 |
0.59 |
0.16238 |
0.22 |
2430.3 |
12.0 |
2480.3 |
3.6 |
98.0 |
| NNW01_18a |
484 |
201 |
0.42 |
298.7 |
0.02 |
2.0675 |
0.64 |
0.16875 |
0.55 |
2542.9 |
13.4 |
2544.2 |
9.2 |
100.0 |
| NNW01_19a* |
627 |
357 |
0.57 |
384.2 |
0.01 |
2.1523 |
0.58 |
0.16241 |
0.22 |
2459.9 |
12.0 |
2480.5 |
3.7 |
99.2 |
| NNW01_19b* |
193 |
78 |
0.40 |
110.5 |
{0.01} |
2.2292 |
0.81 |
0.16268 |
0.30 |
2389.0 |
16.1 |
2483.7 |
5.1 |
96.2 |
| NNW01_21a |
571 |
328 |
0.57 |
706.1 |
0.00 |
1.2323 |
0.67 |
0.37744 |
0.16 |
3830.0 |
19.4 |
3821.5 |
2.4 |
100.2 |
| NNW01_21b |
602 |
322 |
0.53 |
721.7 |
0.00 |
1.2632 |
0.58 |
0.37692 |
0.12 |
3759.0 |
16.5 |
3819.4 |
1.7 |
98.4 |
| NNW01_23a |
653 |
539 |
0.82 |
423.3 |
0.01 |
2.1517 |
0.58 |
0.16482 |
0.20 |
2460.3 |
11.8 |
2505.4 |
3.4 |
98.2 |
| NNW01_24a |
411 |
304 |
0.74 |
260.4 |
0.01 |
2.1614 |
0.64 |
0.16351 |
0.30 |
2451.2 |
13.1 |
2491.8 |
5.0 |
98.4 |
| NNW01_25a |
410 |
327 |
0.80 |
284.7 |
0.01 |
2.0217 |
0.67 |
0.18423 |
0.18 |
2590.5 |
14.4 |
2690.8 |
2.9 |
96.3 |
| NNW01_27a |
366 |
143 |
0.39 |
220.9 |
0.02 |
2.1178 |
0.90 |
0.17108 |
0.58 |
2492.7 |
18.6 |
2566.8 |
9.8 |
97.1 |
| NNW01_28a* |
583 |
75 |
0.13 |
320.0 |
{0.00} |
2.1843 |
0.59 |
0.16229 |
0.19 |
2429.9 |
11.9 |
2479.7 |
3.2 |
98.0 |
| NNW01_28b |
120 |
53 |
0.44 |
72.8 |
{0.02} |
2.1290 |
0.77 |
0.17194 |
0.62 |
2482.2 |
15.8 |
2576.6 |
10.3 |
96.3 |
| NNW01_30a* |
808 |
389 |
0.48 |
477.7 |
0.00 |
2.1854 |
0.58 |
0.16168 |
0.14 |
2428.8 |
11.8 |
2473.0 |
2.3 |
98.2 |
| NNW01_31a* |
143 |
84 |
0.59 |
86.8 |
0.01 |
2.1741 |
0.64 |
0.16137 |
0.33 |
2439.1 |
13.0 |
2469.0 |
5.6 |
98.8 |
| NNW01_34a |
551 |
429 |
0.78 |
391.9 |
0.00 |
1.9534 |
0.60 |
0.18195 |
0.44 |
2664.8 |
13.0 |
2670.4 |
7.2 |
99.8 |
| NNW01_35a |
256 |
277 |
1.08 |
178.0 |
0.03 |
2.1029 |
0.88 |
0.16808 |
0.29 |
2507.3 |
18.4 |
2536.9 |
5.0 |
98.8 |
| NNW01_36* |
766 |
485 |
0.63 |
469.2 |
0.01 |
2.1811 |
0.57 |
0.16143 |
0.14 |
2432.7 |
11.6 |
2470.2 |
2.4 |
98.5 |
| NNW01_37a |
466 |
198 |
0.43 |
317.8 |
0.01 |
1.9123 |
0.80 |
0.18939 |
0.76 |
2711.4 |
17.6 |
2736.4 |
12.5 |
99.1 |
| NNW01_37b* |
201 |
196 |
0.98 |
130.4 |
{0.01} |
2.2156 |
0.60 |
0.16137 |
0.33 |
2401.2 |
12.1 |
2470.0 |
5.6 |
97.2 |
| NNW01_38a |
3778 |
960 |
0.25 |
2509.7 |
0.00 |
1.8828 |
0.68 |
0.18203 |
0.51 |
2746.1 |
15.2 |
2671.2 |
8.4 |
102.8 |
| NNW01_38b |
1841 |
456 |
0.25 |
1156.8 |
0.01 |
1.9820 |
0.86 |
0.17698 |
0.46 |
2632.9 |
18.6 |
2623.9 |
7.6 |
100.3 |
| NNW01_40b |
1000 |
101 |
0.10 |
615.8 |
{0.01} |
1.9658 |
0.86 |
0.18318 |
0.79 |
2650.9 |
18.8 |
2681.9 |
13.1 |
98.8 |
| NNW01_41a |
3055 |
98 |
0.03 |
1727.5 |
{0.00} |
2.0731 |
0.64 |
0.16364 |
0.14 |
2537.6 |
13.5 |
2493.7 |
2.3 |
101.8 |
| NNW01_42a |
167 |
234 |
1.40 |
124.0 |
{0.02} |
2.0808 |
1.04 |
0.16496 |
0.82 |
2529.5 |
21.7 |
2507.2 |
13.8 |
100.9 |
aValues corrected for common Pb.
bPercentage 206Pb which is non-radiogenic, calculated assuming present-day Stacey and Kramers (1975) common Pb. Figures in parentheses are given when no correction has been applied as 204Pb counts are statistically insignificant.
cConc. (%): concordance = 100 + 100 * [(206Pb/238U)/(207Pb/206Pb) − 1], where ratios refers to age.
*Analyses used for weighted mean 207Pb/206Pb age.
Table 5. U-Th-Pb data for sample NNW02 (77284064) from Grimsley Peaks
| Analysis |
|
|
|
|
|
Ratiosa |
Agesa |
|
| (Grain.spot) |
U
(ppm) |
Th
(ppm) |
Th/U |
Pb |
206Pbc
(%)b |
238U/206Pb |
±σ
(%) |
207Pb/206Pb |
±σ
(%) |
206Pb/238U |
±σ |
207Pb/206Pb |
±σ |
Conc.
(%)c |
| NNW02_02a |
1765 |
197 |
0.11 |
1002 |
- |
2.1021 |
0.63 |
0.162694 |
0.12 |
2508.5 |
13.2 |
2483.8 |
2.1 |
101.0 |
| NNW02_02b |
2526 |
264 |
0.10 |
1428 |
- |
2.1075 |
0.61 |
0.163000 |
0.08 |
2503.2 |
12.6 |
2487.0 |
1.4 |
100.7 |
| NNW02_03a |
1752 |
226 |
0.13 |
975 |
{0.00} |
2.1520 |
0.71 |
0.161609 |
0.12 |
2460.2 |
14.5 |
2472.6 |
2.0 |
99.5 |
| NNW02_03b |
1948 |
320 |
0.16 |
1072 |
- |
2.1982 |
0.60 |
0.162101 |
0.09 |
2417.1 |
12.2 |
2477.7 |
1.5 |
97.6 |
| NNW02_04a* |
286 |
59 |
0.21 |
163 |
{0.01} |
2.1442 |
0.61 |
0.163105 |
0.23 |
2467.7 |
12.5 |
2488.1 |
3.9 |
99.2 |
| NNW02_05a |
1637 |
158 |
0.10 |
929 |
- |
2.1030 |
0.66 |
0.165961 |
0.18 |
2507.6 |
13.7 |
2517.3 |
3.1 |
99.6 |
| NNW02_06a |
1554 |
607 |
0.39 |
1042 |
{0.01} |
1.9278 |
1.14 |
0.183139 |
0.84 |
2693.8 |
25.1 |
2681.5 |
13.9 |
100.5 |
| NNW02_07a |
1529 |
320 |
0.21 |
879 |
- |
2.1223 |
0.63 |
0.162095 |
0.10 |
2488.8 |
13.0 |
2477.6 |
1.7 |
100.5 |
| NNW02_08a |
2177 |
192 |
0.09 |
1233 |
- |
2.0950 |
0.63 |
0.161868 |
0.10 |
2515.6 |
13.2 |
2475.3 |
1.7 |
101.6 |
| NNW02_09a |
1536 |
193 |
0.13 |
870 |
- |
2.1130 |
0.60 |
0.162072 |
0.12 |
2497.8 |
12.4 |
2477.4 |
2.0 |
100.8 |
| NNW02_11a |
1945 |
436 |
0.22 |
1116 |
- |
2.1327 |
0.60 |
0.161451 |
0.10 |
2478.7 |
12.3 |
2470.9 |
1.7 |
100.3 |
| NNW02_12a |
1256 |
251 |
0.20 |
717 |
{0.00} |
2.1315 |
0.62 |
0.161733 |
0.13 |
2479.8 |
12.8 |
2473.9 |
2.1 |
100.2 |
| NNW02_13b |
1582 |
307 |
0.19 |
900 |
- |
2.1376 |
0.60 |
0.162065 |
0.11 |
2473.9 |
12.3 |
2477.3 |
1.9 |
99.9 |
| NNW02_14a* |
1449 |
246 |
0.17 |
824 |
- |
2.1280 |
0.60 |
0.163041 |
0.16 |
2483.2 |
12.4 |
2487.4 |
2.6 |
99.8 |
| NNW02_16a |
1221 |
78 |
0.06 |
702 |
- |
2.0621 |
0.68 |
0.168591 |
0.51 |
2548.8 |
14.3 |
2543.7 |
8.6 |
100.2 |
| NNW02_16b |
1635 |
347 |
0.21 |
935 |
- |
2.1336 |
0.60 |
0.162450 |
0.12 |
2477.9 |
12.4 |
2481.3 |
2.0 |
99.9 |
| NNW02_17a* |
125 |
19 |
0.15 |
70 |
{0.01} |
2.1513 |
0.62 |
0.164160 |
0.34 |
2460.9 |
12.8 |
2499.0 |
5.8 |
98.5 |
| NNW02_18a |
1127 |
192 |
0.17 |
635 |
- |
2.1427 |
0.60 |
0.161370 |
0.12 |
2469.1 |
12.4 |
2470.1 |
1.9 |
100.0 |
| NNW02_19a |
1282 |
280 |
0.22 |
731 |
- |
2.1453 |
0.61 |
0.161429 |
0.11 |
2466.6 |
12.5 |
2470.7 |
1.8 |
99.8 |
| NNW02_20a |
1776 |
238 |
0.13 |
1000 |
- |
2.1301 |
0.61 |
0.162221 |
0.12 |
2481.2 |
12.6 |
2478.9 |
2.0 |
100.1 |
| NNW02_21a |
374 |
75 |
0.20 |
211 |
0.01 |
2.1567 |
0.61 |
0.161383 |
0.22 |
2455.8 |
12.4 |
2470.2 |
3.7 |
99.4 |
| NNW02_22a |
1185 |
267 |
0.23 |
680 |
- |
2.1341 |
0.60 |
0.161524 |
0.11 |
2477.3 |
12.4 |
2471.7 |
1.9 |
100.2 |
| NNW02_23a |
983 |
37 |
0.04 |
554 |
{0.00} |
2.0871 |
0.62 |
0.166855 |
0.29 |
2523.5 |
12.9 |
2526.3 |
4.9 |
99.9 |
| NNW02_23b |
1438 |
99 |
0.07 |
809 |
- |
2.1012 |
0.61 |
0.163204 |
0.19 |
2509.4 |
12.7 |
2489.1 |
3.2 |
100.8 |
| NNW02_24a |
1247 |
136 |
0.11 |
693 |
- |
2.1469 |
0.60 |
0.162045 |
0.11 |
2465.1 |
12.4 |
2477.1 |
1.8 |
99.5 |
| NNW02_26a |
1709 |
408 |
0.24 |
984 |
{0.00} |
2.1315 |
0.60 |
0.161864 |
0.09 |
2479.8 |
12.3 |
2475.2 |
1.6 |
100.2 |
| NNW02_27a |
595 |
154 |
0.26 |
335 |
- |
2.1926 |
0.67 |
0.162000 |
0.16 |
2422.2 |
13.5 |
2476.6 |
2.7 |
97.8 |
| NNW02_28a |
1255 |
241 |
0.19 |
713 |
- |
2.1385 |
0.61 |
0.162662 |
0.14 |
2473.1 |
12.5 |
2483.5 |
2.4 |
99.6 |
| NNW02_29a |
1805 |
259 |
0.14 |
1024 |
- |
2.1151 |
0.70 |
0.160648 |
0.20 |
2495.8 |
14.4 |
2462.5 |
3.3 |
101.4 |
| NNW02_30a |
1416 |
147 |
0.10 |
789 |
- |
2.1378 |
0.60 |
0.162441 |
0.10 |
2473.8 |
12.4 |
2481.2 |
1.7 |
99.7 |
| NNW02_31a* |
404 |
108 |
0.27 |
233 |
0.01 |
2.1419 |
0.60 |
0.163180 |
0.19 |
2469.9 |
12.4 |
2488.9 |
3.2 |
99.2 |
| NNW02_32a* |
347 |
79 |
0.23 |
195 |
0.02 |
2.1819 |
0.60 |
0.162575 |
0.25 |
2432.1 |
12.2 |
2482.6 |
4.1 |
98.0 |
| NNW02_33a |
1188 |
242 |
0.20 |
673 |
- |
2.1508 |
0.61 |
0.161061 |
0.11 |
2461.3 |
12.6 |
2466.8 |
1.9 |
99.8 |
| NNW02_33b |
1454 |
178 |
0.12 |
804 |
- |
2.1626 |
0.62 |
0.160841 |
0.11 |
2450.2 |
12.6 |
2464.5 |
1.8 |
99.4 |
| NNW02_34a* |
276 |
61 |
0.22 |
155 |
0.01 |
2.1737 |
0.62 |
0.162668 |
0.23 |
2439.7 |
12.6 |
2483.6 |
3.9 |
98.2 |
| NNW02_35a |
1511 |
284 |
0.19 |
858 |
- |
2.1388 |
0.61 |
0.161472 |
0.10 |
2472.8 |
12.5 |
2471.1 |
1.7 |
100.1 |
| NNW02_35b |
1619 |
250 |
0.15 |
903 |
- |
2.1612 |
0.60 |
0.162345 |
0.11 |
2451.5 |
12.3 |
2480.2 |
1.8 |
98.8 |
| NNW02_36a |
1886 |
82 |
0.04 |
1078 |
{0.00} |
2.0702 |
0.64 |
0.171415 |
0.47 |
2540.5 |
13.4 |
2571.5 |
7.8 |
98.8 |
| NNW02_37a |
2155 |
326 |
0.15 |
1207 |
- |
2.1491 |
0.60 |
0.162323 |
0.09 |
2462.9 |
12.4 |
2480.0 |
1.5 |
99.3 |
| NNW02_37b |
1484 |
301 |
0.20 |
844 |
- |
2.1446 |
0.61 |
0.162437 |
0.16 |
2467.3 |
12.5 |
2481.2 |
2.7 |
99.4 |
| NNW02_38a |
1571 |
128 |
0.08 |
873 |
- |
2.1311 |
0.61 |
0.161561 |
0.10 |
2480.2 |
12.5 |
2472.1 |
1.6 |
100.3 |
| NNW02_38b |
844 |
248 |
0.29 |
525 |
0.03 |
2.0169 |
1.04 |
0.174205 |
0.38 |
2595.8 |
22.2 |
2598.5 |
6.4 |
99.9 |
| NNW02_40a |
2541 |
296 |
0.12 |
1419 |
- |
2.1390 |
0.60 |
0.162292 |
0.08 |
2472.7 |
12.3 |
2479.7 |
1.3 |
99.7 |
| NNW02_41b |
1283 |
45 |
0.04 |
730 |
0.01 |
2.0781 |
0.90 |
0.173025 |
0.61 |
2532.5 |
18.8 |
2587.1 |
10.2 |
97.9 |
| NNW02_42a |
840 |
177 |
0.21 |
523 |
0.01 |
2.0001 |
0.76 |
0.183027 |
1.12 |
2613.7 |
16.4 |
2680.5 |
18.5 |
97.5 |
| NNW02_42b |
1550 |
294 |
0.19 |
879 |
{0.00} |
2.1440 |
0.59 |
0.161748 |
0.20 |
2467.9 |
12.1 |
2474.0 |
3.4 |
99.8 |
| NNW02_43a |
2011 |
159 |
0.08 |
1119 |
- |
2.1259 |
0.68 |
0.162379 |
0.19 |
2485.3 |
14.1 |
2480.6 |
3.2 |
100.2 |
| NNW02_44a |
1592 |
619 |
0.39 |
1223 |
{0.00} |
1.7290 |
0.70 |
0.214354 |
0.49 |
2942.1 |
16.4 |
2938.8 |
7.8 |
100.1 |
| NNW02_44b |
1501 |
167 |
0.11 |
846 |
{0.00} |
2.1172 |
0.90 |
0.162549 |
0.20 |
2493.7 |
18.7 |
2482.3 |
3.4 |
100.5 |
| NNW02_45a |
1581 |
173 |
0.11 |
888 |
{0.00} |
2.1229 |
0.66 |
0.161392 |
0.20 |
2488.2 |
13.6 |
2470.3 |
3.3 |
100.7 |
| NNW02_46a |
2459 |
544 |
0.22 |
1680 |
0.01 |
1.8400 |
0.79 |
0.198499 |
0.48 |
2798.0 |
18.1 |
2813.9 |
7.9 |
99.4 |
| NNW02_46b |
1958 |
147 |
0.08 |
1097 |
{0.00} |
2.1144 |
0.66 |
0.163074 |
0.17 |
2496.5 |
13.7 |
2487.8 |
2.9 |
100.3 |
| NNW02_47a |
1041 |
247 |
0.24 |
751 |
0.03 |
1.7670 |
0.97 |
0.220021 |
0.49 |
2891.1 |
22.7 |
2980.8 |
7.9 |
97.0 |
| NNW02_48a |
3401 |
1384 |
0.41 |
2264 |
- |
1.9364 |
0.68 |
0.176535 |
0.25 |
2684.0 |
14.8 |
2620.6 |
4.2 |
102.4 |
| NNW02_49a |
2024 |
391 |
0.19 |
1202 |
{0.00} |
2.0558 |
0.66 |
0.166675 |
0.32 |
2555.2 |
14.0 |
2524.5 |
5.4 |
101.2 |
| NNW02_49b |
1627 |
208 |
0.13 |
929 |
{0.00} |
2.1028 |
0.75 |
0.163164 |
0.26 |
2507.9 |
15.6 |
2488.7 |
4.5 |
100.8 |
| NNW02_50a |
2615 |
848 |
0.32 |
1752 |
- |
1.9159 |
0.81 |
0.193717 |
0.35 |
2707.4 |
17.9 |
2774.0 |
5.8 |
97.6 |
| NNW02_51b |
928 |
192 |
0.21 |
644 |
0.01 |
1.8303 |
0.95 |
0.210242 |
0.51 |
2810.0 |
21.8 |
2907.4 |
8.3 |
96.6 |
| NNW02_51c |
2589 |
228 |
0.09 |
1466 |
{0.00} |
2.0954 |
0.58 |
0.161607 |
0.17 |
2515.2 |
12.0 |
2472.5 |
2.9 |
101.7 |
| NNW02_52a* |
272 |
59 |
0.22 |
153 |
{0.02} |
2.1785 |
0.78 |
0.163204 |
0.47 |
2435.3 |
15.8 |
2489.1 |
7.9 |
97.8 |
| NNW02_53a |
1262 |
198 |
0.16 |
714 |
{0.00} |
2.1297 |
0.60 |
0.162025 |
0.31 |
2481.6 |
12.4 |
2476.9 |
5.1 |
100.2 |
| NNW02_54a |
554 |
738 |
1.33 |
573 |
{0.00} |
1.5541 |
0.82 |
0.248357 |
0.46 |
3202.6 |
20.8 |
3174.3 |
7.3 |
100.9 |
| NNW02_54b |
1362 |
277 |
0.20 |
781 |
{0.01} |
2.1236 |
0.68 |
0.161813 |
0.21 |
2487.5 |
14.1 |
2474.7 |
3.6 |
100.5 |
| NNW02_55a |
3254 |
283 |
0.09 |
1846 |
{0.00} |
2.0908 |
0.62 |
0.162156 |
0.15 |
2519.8 |
12.9 |
2478.3 |
2.6 |
101.7 |
| NNW02_55b |
1519 |
147 |
0.10 |
851 |
0.01 |
2.1191 |
0.64 |
0.160428 |
0.20 |
2491.9 |
13.3 |
2460.2 |
3.4 |
101.3 |
| NNW02_56a |
3924 |
4724 |
1.20 |
2892 |
- |
2.0434 |
1.76 |
0.172878 |
0.20 |
2568.0 |
37.3 |
2585.7 |
3.4 |
99.3 |
| NNW02_58a |
1003 |
89 |
0.09 |
559 |
{0.01} |
2.1265 |
0.75 |
0.162394 |
0.31 |
2484.7 |
15.5 |
2480.7 |
5.3 |
100.2 |
| NNW02_59a |
1819 |
239 |
0.13 |
1065 |
0.01 |
2.0579 |
0.63 |
0.168633 |
0.34 |
2553.1 |
13.3 |
2544.1 |
5.8 |
100.4 |
| NNW02_60a |
1714 |
259 |
0.15 |
966 |
- |
2.1338 |
0.63 |
0.162893 |
0.20 |
2477.6 |
13.0 |
2485.9 |
3.4 |
99.7 |
aValues corrected for common Pb.
bPercentage 206Pb which is non-radiogenic, calculated assuming present-day Stacey and Kramers (1975) common Pb. Figures in parentheses are given when no correction has been applied as 204Pb counts are statistically insignificant.
cConc. (%): concordance = 100 + 100 * [(206Pb/238U)/(207Pb/206Pb) − 1], where ratios refers to age.
*Analyses used for weighted mean 207Pb/206Pb age.

Figure 5. Tera-Wasserburg concordia diagrams of zircon U-Pb analyses of orthogneisses from the Napier Mountains. Error ellipses are 1 sigma. Ages along the concordia are in Ma. Colored ellipses represent data used for age calculation. (a) NMC02. (b) NMC03. (c) NNW01. (d) NNW02. Inset in (c) is an extension of concordia, whereas the inset in (d) is an enlargement of the part of the diagram marked with the dashed rectangle. Ellipses in this latter are color-coded according to U content shown in legend at the bottom of the inset.
Sample NMC02, granitic gneiss, Grimsley Peak. The zircon grains are mostly anhedral and equant, with some tabular grains (Fig. 4a) 50-270 µm in length, with aspect ratios ranging from 1:1 to 3:1. Zircon domains are characterized by moderate to weak CL response. Some grains have chaotic or patchy zonation, manifested as moderately luminescent patches and lobes in the weakly luminescent domains. Some grains have prismatic cores (e.g., grains 10 and 49) with oscillatory zonation, locally truncated by zones without visible zonation. There are also grains that are moderately luminescent and do not show any zonation. One grain is an elongate prism with broad banded zoning that is conformable with elongation of the prism faces (grain 57).
A total of 73 analyses were performed (Table 2 and Fig. 5a). Zircon ages range from 2836 to 2430 Ma. The data form three main groups: one from ∼ 2864 to 2780 Ma, another from 2740 to 2700 Ma and the youngest group with an age of 2500 Ma. Within these groups there are many normal and reversely discordant data. Moreover, there are some concordant data between 2700 and 2500 Ma. The zircon grains have high U and Th contents up to 6000 and 3000 ppm, respectively (Fig. 6a and 6b). Almost all the <2.6 Ga zircons have >1000 ppm of U and <600 ppm Th, in contrast to older zircon that has U contents as low as 90 ppm and Th up to 3000 ppm (Fig. 6b). The Th/U ratio varies from 0.03 to 1.57 (Fig. 6c). The zircon with ages <2.6 Ga has Th/U <0.2, whereas the ratio for older zircon is more variable. Forty-one data are discordant, 33 of which are reversely discordant. The most reversely discordant data come from zircon with U contents greater than 2500 ppm (Fig. 6d).

Figure 6. Plots of zircon geochemical properties for the samples from the Napier Mountains. Age refers to 207Pb/206Pb apparent zircon age. (a), (e), (i), and (l) U content in ppm versus Age in Ma. (b), (f), (j), and (n) Th content in ppm versus Age in Ma. (c), (g), (k), and (o) Th/U versus Age in Ma. (d), (h), (l), and (p) U content in ppm versus % discordance. Level of discordance is calculated as follows: 100 * [(206Pb/238U)/(207Pb/206Pb) − 1], where ratios refers to age. White symbols denote discordant data, which represent data with error ellipses not overlapping the concordia curve (a)-(d) NMC02, (e)-(h) NMC03, (i)-(l) NNW01, and (m)-(p) NNW02.
The six oldest statistically equivalent data, represented by prismatic cores (e.g., grains 14 and 49; Fig. 4a), provide the most reliable estimate for the time of protolith crystallization (Fig. 5a), recording a weighted mean 207Pb/206Pb age of 2826 ± 6 Ma (MSWD = 1.4). The 6 data from more luminescent patches and lobes replacing weakly luminescent grains have a weighted mean 207Pb/206Pb age of 2727 ± 3 Ma (MSWD = 0.87; Fig. 5a). The 8 data from moderately luminescent domains without visible zoning (e.g., grain 35, Fig. 4a), and commonly cutting other domains (grain 19, Fig. 4a), record a weighted mean 207Pb/206Pb age of 2479 ± 2 Ma (MSWD = 0.97; Fig. 5a). This age is interpreted as zircon replacement/recrystallization during a metamorphic event.
Sample NMC03, tonalitic gneiss, Grimsley Peak. The zircon grains are mostly anhedral to subhedral with rounded terminations and elongate prisms (Fig. 4b). They are 50-180 µm in length, with aspect ratios ranging from 1:1 to 3:1, similar to the previous sample. Most grains have oscillatory zonation (grain 23; Fig. 4b), typical of growth in a fractionating magma (Corfu et al., 2003; Schaltegger and Davies, 2017). However, some have more highly luminescent cores that are rounded or truncated. There are also thin, highly luminescent seams in the concentrically zoned outer domains, indicative of recrystallization (Grant et al., 2009). Such structures suggest resorption of magmatic cores and domains. Irregular, patchy and convoluted zoning is also present in some grains. The outer domains of anhedral grains tend to be broad and without visible zonation (grain 13; Fig. 4b).
Fifty-nine U-Pb spot analyses were performed, with 33 analyses being discordant (Table 3 and Fig. 5b). Zircon dates range from 3234 to 1271 Ma. The uranium contents can exceed 5000 ppm (Fig. 6e). There is no correlation between U content and age for zircon with ages between 3.0 and 2.5 Ga, but for <2.5 Ga grains U content increases with a decrease in age. Thorium contents range between 7 and 990 ppm and there is no correlation with age (Fig. 6f). The Th/U ratio for >3.0 Ga zircon ranges between 0.15 and 1.45 (Fig. 6g). Most of the 3.00 to 2.49 Ga data have Th/U < 0.1, whereas for 2.90-2.80 Ga zircon the Th/U values are ∼ 0.2, The level of discordance rises with U content (Fig. 6h).
The eight oldest statistically equivalent data, represented by the prismatic cores with oscillatory zoning, provide the most reliable estimate for the time of protolith crystallization. These define a weighted mean 207Pb/206Pb age of 3210 ± 4 Ma (MSWD = 1.8, n = 8; Fig. 5b). The 5 data from broad outer domains without visible zoning record a weighted mean 207Pb/206Pb age of 2481 ± 3 Ma (MSWD = 0.53, Fig. 5b), defining recrystallization during metamorphism.
Sample NNW01, dioritic gneiss, Mount Marr. Zircon grains are anhedral to subhedral with aspect ratio ranging from 1:1 to 2:1 (Fig. 4c). Some grains have luminescent cores with oscillatory zoning, typical of magmatic growth. However, many cores have broad banding or sector zonation and may be prismatic or rounded. Some grains also show progressive zonation, exhibiting a sequence from weak, to high, to weak luminescence (grain 4; Fig. 4c). The two inner zones may cut the cores, whereas the outer rim cuts both cores and inner zones.
Forty-two U-Pb analyses were performed, of which 18 are discordant, including 5 reversely discordant data. The concordant ages range from ∼ 2966 to 2456 Ma (Fig. 5c), with one grain preserving a core with an Eoarchean age of ∼ 3820 Ma (grain 21; Fig. 4c). Ages of oscillatory-zoned domains spread along concordia from 2720 down to 2490 Ma, but it is not possible to determine whether these are cogenetic with variable Pb loss or represent discrete events. Domains without visible zonation, those with sector zoning, and the rims have ages younger than 2494 Ma. These record a weighted mean 207Pb/206Pb age of 2475 ± 3 Ma (MSWD = 1.4, n = 12; Fig. 5c), interpreted to represent the (re)crystallization of zircon during a metamorphic event. The U contents vary from 71 to 3778 (Fig. 6i) and Th contents from 25 to 1368 ppm (Fig. 6j). However, most have values below 1000 ppm for both elements. The Th/U ratio is also variable, with values between 0.03 and 1.40 (Fig. 6k). There is no relationship between the age and Th and U contents or Th/U ratio. Most of the domains with U contents above 1000 ppm are reversely discordant (Fig. 6l).
Sample NNW02, tonalitic gneiss, Johnston Peak. Zircon grains are mostly subhedral, varying from elongate to more rounded in shape (Fig. 4d). They are 50-200 µm in length, with aspect ratios ranging from 1:1 to 4:1. Most grains are weakly luminescent and have chaotic or subtle concentric zoning in the form of broad bands. Rarely, weakly distinguishable, rounded cores are preserved (e.g., grains 4 and 42; Fig. 4d), which may be cut by weakly luminescent zones. Locally, some highly luminescent and irregular seams are present within the weakly luminescent domains, especially near the grain rims (Fig. 4d). Sector zoned, highly luminescent zircon is represented by more stubby to rounded grains, some of which have highly luminescent cores, mostly with chaotic zoning, although broad banded zonation is locally present.
A total of 69 analyses were performed (Table 5 and Fig. 5d). The ages range from 3174 to 2460 Ma, with 17 discordant data, 4 of which are reversely discordant. The contents of U and Th range from 79 to 3923 (Fig. 6m) and from 18 to 848 ppm (Fig. 6n), respectively, although there are two exceptions with 1383 and 4724 ppm of Th. The Th/U of >2600 Ma zircon is 0.1 to 0.6, but for the <2600 Ma grains it varies between 0 and 0.3 (Fig. 6o). There is no relationship between the content of actinides and the age. The level of discordance is low and is not greater than ±4.5% (Fig. 6p).
Highly luminescent rims, together with sector and chaotically zoned zircon, have ages between 2499 and 2482 Ma. Importantly, these are older than most of the weakly luminescent inner domains with chaotic zonation, which have ages between 2487 and 2462 Ma. Eight statistically equivalent data from the older population give a weighted mean 207Pb/206Pb age of 2487 ± 6 Ma (MSWD = 1.5; n = 8; Fig. 5d), which is interpreted to represent the age of zircon (re)crystallization during a metamorphic event.
DISCUSSION
Reverse discordance and Th-U ratio systematics
Thorium and U contents, as well as Th/U ratio, reveal considerable variation among the zircon grains in this study (Fig. 6). This is true not only for zircon of different genesis, i.e., magmatic or metamorphic, but also within the same generation. This is best reflected in the sample from Mount Marr (NNW01, Fig. 6k). In the literature, Th/U ratio has been used to distinguish metamorphic from igneous zircon (Hoskin and Black, 2000; Rubatto, 2002), although such differences are not systematic, and high Th/U zircon has been recognized in many high-grade metamorphic rocks (e.g., Hokada et al., 2004; Kelly and Harley, 2005; Santosh et al., 2007; Król et al., 2020, 2022). This study adds to known examples from the Napier Complex (Hokada et al., 2004; Kelly and Harley, 2005; Guitreau et al., 2019; Król et al., 2020, 2022) and points to variable metamorphic Th/U being a common phenomenon within the complex. The differences in Th/U in metamorphic zircon can be attributed to the presence or absence of certain co-existing minerals or phases (including melt or fluid) that partition Th over U, especially monazite and allanite (Rubatto, 2017; Yakymchuk et al., 2018). This is particularly complex as the major element composition is variable, and hence the stability of such minerals.
Many U-Pb analyses in this study are discordant, including reversely discordant data (Fig. 6). As shown in Figure 6d, 6h, 6l, zircon domains with high U contents over 1500 ppm are commonly (reversely) discordant. This is in accord with the observation of Black et al. (1991) that the most U-rich zircon shows the greatest reverse discordance. This may be a result of either, the high-uranium matrix effect as described by White and Ireland (2012), or inhomogeneity of Pb at the micron scale (Kusiak et al., 2013a, 2013b). The matrix effect affects only Pb/U ages and results in a horizontal trend in Terra-Wasserburg diagrams, which may be the case for the ∼ 2720 and 2500 Ma reversely-discordant populations in sample NMC02 from Grimsley Peak (Fig. 5a). Kusiak et al. (2013a, 2013b) demonstrated inhomogeneity of Pb at the micron scale in zircon from the Napier Complex, confirming the presence of unsupported radiogenic Pb as a result of U and Th radioactive breakdown and production of nanoclusters and metallic Pb nanospheres (Kusiak et al., 2015; Whitehouse et al., 2017). This affects the U-Pb system at the micro- and nanoscale, causing 206Pb/238U ages to be spuriously older. This may be the case for the ∼ 2800 Ma grains in sample NMC02, where there is a correlated reverse discordance in which both the 206Pb/238U and 207Pb/206Pb ages get apparently older.
Post-magmatic modification of zircon
Metamorphic and recrystallized zircon observed in the Napier Complex samples display domains that are characterized by different structures seen in CL. The internal structures can be divided into those that existed prior to metamorphism and have been subsequently modified, and those that grew as a result of metamorphic processes. Examples of the modification of primary zircon are domains with high luminescent patches and lobes invading the weaker luminescent domains, commonly in elongate prisms, pointing to a primary magmatic origin for the zircon. This feature may be the result of high temperature annealing or coupled dissolution-reprecipitation due to fluid alteration (e.g., Vavra et al., 1999; Corfu et al., 2003; Harley and Kelly, 2007; Geisler et al., 2007; Taylor et al., 2014, 2016) after crystallization from a melt. These features are observed only in ∼ 2720 Ma zircon in Grimsley Peak sample NMC02. Given that this sample is granitic with a high silica content of ∼ 74%, it has more potential to contain and be affected by fluids than the tonalitic sample from the same locality (NMC03).
The 2480-2460 Ma zircon varies not only in internal structure but also in Th-U systematics (Figs. 4 and 6). In the gneiss from Johnston Peak (NNW02), primary zonation is rarely preserved, and appears to have been obliterated or altered through recrystallisation. Nonetheless, many zircon grains retain their original morphology and aspect ratio, and are ascribed to be of magmatic origin (see also Hoskin and Black, 2000; Corfu et al., 2003; Hoskin and Schaltegger, 2003). However, the U-Pb system in such domains is disrupted to varying degrees, resulting in a spread of the data along concordia from ∼ 2600 to ∼ 2460 Ma, so local preservation of original zoning is no guarantee of closed system behavior during high-grade metamorphism.
Several samples have zircon with sector zoning, which may be of igneous (Hanchar and Miller, 1993) or metamorphic origin (Watson and Liang, 1995). However, these grains have equant, rounded grain morphologies, similar to so-called ‘soccerball’ grains (Vavra et al., 1999), typical for many UHT terrains (Hokada and Harley, 2004; Harley and Kelly, 2007) and interpreted to be the result of growth from a partial melt (Kelly and Harley, 2005). Some grains are composed of multiple components with a distinct core, commonly with an igneous morphology. They may also feature a metamorphic overgrowth, which results in a more equant grain shape. Some grains display truncation of the internal structures by broad domains with no visible zonation. These grains are typical of metamorphic supra-solidus growth at high temperature (Schaltegger et al., 1999; Corfu et al., 2003), characteristic of granulitic-facies metamorphism.
Timing of geological events in the Napier Mountains
Significance of ∼ 3.2 and 2.8 Ga ages. The present study provides new ages for protolith crystallization at 3210 ± 4 and 2826 ± 6 Ma for a tonalitic and a granitic gneiss, respectively, from Grimsley Peaks. The older age is similar, but slightly younger, than an age of 3267 ± 5 Ma and older than an age of 3073 ± 12 Ma reported for felsic orthogneisses at Mt. Riiser-Larsen (Hokada et al., 2003), a locality ∼ 125 km to the WSW. It is also older than the 2988 ± 23 Ma age (Kelly and Harley, 2005) of protolith crystallization, ∼ 100 km to the N on Proclamation Island. Mesoarchean magmatic activity, however, seems to be restricted to the northern part of the Napier Complex and part of the Tula Mountains, based on available data. The much younger age of ∼ 2825 Ma for the granitic gneiss from Grimsley Peaks overlaps with the timing of high-grade metamorphism in the Mt. Riiser-Larsen area (Kelly and Harley, 2005; Clark et al., 2018), and at Proclamation Island and a part of the Tula Mountains (Harley and Black, 1997; Kelly and Harley, 2005; Kusiak et al., 2013a; Clark et al., 2018; Król et al., 2020) where ages from 2850 to 2790 Ma have been recorded. A younger minimum age of 2788 ± 24 Ma for granitic gneiss has also been obtained from Mt. King in the eastern Tula Mountains (Król et al., 2020). Circa 2800 Ma protoliths from Grimsley Peaks and Mount Marr both represent the generation of syn-metamorphic rocks. Both belong to geochemical Group 2, having elevated Nb-Ta-Y-HREE contents that are interpreted to represent protoliths generated at shallower depths than the rocks of Group 1, which have low values of Nb-Ta-Y-HREE. In both localities the magmatic rocks crystallized before the ∼ 2.8 Ga metamorphic event (Król et al., 2020).
Granitic gneiss sample NMC02 from Grimsley Peaks shows evidence of a metamorphic event around 2800 Ma based on the spread of data along concordia from ∼ 2825 to 2770 Ma. A concordant date from a rim surrounding an older core (grain 57, Fig. 4), and from more chaotic zones are also interpreted to be generated during metamorphism, providing a lower limit for this event at ∼ 2770 Ma. However, this is 20 Myr younger than the estimate of the last stage of this tectono-metamorphic event at around 2790 Ma from previous workers (Hokada et al., 2003). The tonalitic gneiss sample (NMC03) from Grimsley Peaks, also contains some zircon grains with concordant dates between 2800 and 2700 Ma. These may be a result of either the late vestiges of ∼ 2.8 Ga metamorphism, as in the granitic gneiss, or may represent ∼ 3210 Ma grains partially affected by ∼ 2500 Ma UHT metamorphism.
The granitic gneiss sample (NMC02) from Grimsley Peaks also contains zircon with evidence of recrystallization in the form of patches and lobes that have relatively low U and higher luminosity than the zircon it is replacing; features typical of fluid-induced recrystallization (Mathieu et al., 2001; Taylor et al., 2016). The U-Pb systematics of such domains may have completely reset the initial values, allowing accurate dating of fluid alteration and constraining fluid-rock interaction (Taylor et al., 2014). An estimate of the timing of that replacement has been calculated at 2727 ± 3 Ma, an age not previously reported for metamorphic activity, although similar to magmatism in the southeastern Napier Complex (Król et al., 2022). The cause of such fluid ingress remains speculative, but it may have been triggered by the expulsion of fluids due to crystallization of melts related to either magmatism or metamorphism at high (Harley, 2016) or ultra-high temperatures (Clark et al., 2018).
Chronology of ∼ 2.5 Ga magmatic and metamorphic events. It has been well established that (ultra-)high temperature metamorphism occurred in the Napier Complex between 2585 and 2420 Ma (Harley, 2016, Clark et al., 2018, Harley et al., 2019 and references therein; Król et al., 2020, 2022; Kusiak et al., 2021). This study provides new data regarding this event in the Napier Mountains. The dioritic gneiss sample (NNW01) from Mount Marr contains zircon with oscillatory-zoned domains that spread along concordia from 2720 Ma down to 2490 Ma, typical of growth in a fractionating magma. The domains without visible zonation, together with sector zoning and rims, can be ascribed to (re)crystallization during metamorphism, and have younger ages of ∼ 2490 Ma. As such, 2490 Ma may constitute a minimum age for crystallization of the dioritic protolith and the maximum age for zircon growth or recrystallization during metamorphism. This sample differs from the other rocks studied here, distinguished by its tholeiitic affinity and having much lower Al2O3 for a given SiO2 content. It cannot be unequivocally determined whether the dioritic gneiss represents a protolith crystallized at ∼ 2720 Ma, with younger data representing those domains disturbed during the ∼ 2500 Ma event, or if it crystallized at ∼ 2490 Ma with data extending from 2720 to 2490 Ma representing inherited zircon incorporated during magma transport and eruption and variously affected by subsequent metamorphism. Given that there is no cross-cutting relationship to the zoning in these ∼ 2720 Ma zircon grains, unequivocally implying a xenocrystic/inherited origin, the preferred scenario is that this rock represents crystallization of the dioritic protolith at ∼ 2720 Ma. The rock, however, incorporated Eo- and Mesoarchean zircon, and although only one grain recorded an Eoarchean age, it is likely evidence for the presence of Eoarchean crust in the area.
The two samples from Grimsley Peaks (NMC02 and NMC03) record ages of ∼ 2480 Ma for recrystallization of, or overgrowth on, older zircon grains. This is similar to ∼ 2475 Ma ages of new growth, including overgrowth on older zircon, for the dioritic gneiss for Mount Marr (NNW01). A slightly older age of ∼ 2486 Ma for new growth of metamorphic zircon is represented by sector-zoned grains in tonalitic gneiss sample NNW02 from Johnston Peak, followed by solid-state replacement of magmatic zircon at ∼ 2460 Ma. As outlined above, the samples studied here provide evidence for extensive zircon growth and solid-state replacement at ∼ 2490 Ma, preceded by earlier dioritic magmatism. Along with the lack of strong evidence for extensive metamorphic zircon growth before 2500 Ma, this contrasts with the metamorphic record from other localities in the Napier Complex, where metamorphic zircon growth occurred as early as ∼ 2520 Ma (Harley and Black, 1997; Król et al., 2020, 2022).
CONCLUSIONS
Zircon grains from the Napier Mountains with an igneous protolith record an array of different structures and morphologies related to a variety of processes, including mineral growth and modification during metamorphism and fluid-mediated alteration. These zircon grains display a range of U and Th contents and Th/U ratios, the latter atypical of what is traditionally perceived as ‘metamorphic’ values. The ∼ 2800 Ma metamorphic event is recorded in zircon from Grimsley Peaks with data extending down to 2770 Ma, which prolongs the duration of this event by ∼ 20 Myr when compared to the earlier date of 2790 Ma (Hokada et al., 2003). These zircon grains were also affected by ∼ 2730 Ma fluid-mediated alteration, creating patchy zonation in primary magmatic grains. All the samples in this study contain zircon that was intensely modified between 2490 and 2460 Ma, which contrasts with the lack of evidence for recrystallization and growth before 2500 Ma, as is common elsewhere in the Napier Complex. The recognition of Mesoarchean igneous activity in the Napier Mountains is established by protolith ages for tonalitic and granitic gneiss of ∼ 3210 and 2825 Ma, respectively. The generation of younger granites at this locality was synchronous with the ∼ 2.8 metamorphic event.
ACKNOWLEDGMENTS
This research was funded by NCN grants UMO2019/34/H/ST10/00619 to MAK and received support from the SYNTHESYS+ Project which is financed by European Community Research Infrastructure Action under the H2020 Integrating Activities Programme, Project number 823827 to PK. The NordSIMS facility operates as a Swedish Research Council funded national infrastructure (grant # 2017-00671 at time of analysis); this is NordSIMS contribution 735. We thank Heejin Jeon and Kerstin Lindén for technical assistance. Chris Carson and Alix Post are thanked for help, discussion, and especially for access to legacy samples stored at Geoscience Australia and collected by the Bureau of Mineral Resources during Australian National Antarctic Research Expeditions. We thank M. Guitreau and M. Takehara for their constructive comments and T. Hokada for editorial handling of the manuscript.
REFERENCES
- Asami, M., Suzuki, K. and Grew, E.S. (2002) Chemical Th-U-total Pb dating by electron microprobe analysis of monazite, xenotime and zircon from the Archean Napier complex, East Antarctica: Evidence for ultra-high-temperature metamorphism at 2400 Ma. Precambrian Research, 114, 249-275.
- Barker, F. (1979) Trondhjemite: Definition, environment and hypotheses of origin. In Developments in Petrology (Barker, F. Ed.). Elsevier, 1-12.
- Black, L. and James, P. (1983) Geological history of the Archaean Napier complex of Enderby Land. Antarctic Earth Science International Symposium. 4, 11-15.
- Black, L.P., James, P. and Harley, S.L. (1983a) The geochronology, structure and metamorphism of early Archean rocks at Fyfe Hills, Enderby Land, Antarctica. Precambrian Research, 21, 197-222.
- Black, L.P., James, P.R. and Harley, S.L. (1983b) Geochronology and geological evolution of metamorphic rocks in the Field Islands area, East Antarctica. Journal of Metamorphic Geology, 1, 277-303.
- Black, L.P., Fitzgerald, J.D. and Harley, S.L. (1984) Pb isotopic composition, colour, and microstructure of monazites from a polymetamorphic rock in Antarctica. Contributions to Mineralogy and Petrology, 85, 141-148.
- Black, L.P., Kinny, P.D. and Sheraton, J.W. (1991) The difficulties of dating mafic dykes: an Antarctic example. Contributions to Mineralogy and Petrology, 109, 183-194.
- Carson, C.J., Ague, J.J. and Coath, C.D. (2002) U-Pb geochronology from Tonagh Island, East Antarctica: Implications for the timing of ultra-high temperature metamorphism of the Napier Complex. Precambrian Research, 116, 237-263.
- Cherniak, D. and Watson, E. (2001) Pb diffusion in zircon. Chemical Geology, 172, 5-24.
- Cherniak, D.J. and Watson, E.B. (2003) Diffusion in zircon. Reviews in Mineralogy and Geochemistry, 53, 113-143.
- Clark, C., Taylor, R.J.M., Kylander-clark, A.R.C. and Hacker, B.R. (2018) Prolonged (>100 Ma) ultrahigh temperature metamorphism in the Napier Complex, East Antarctica: A petrochronological investigation of Earth’s hottest crust. Journal of Metamorphic Geology, 36, 1117-1139.
- Corfu, F., Hanchar, J.M., Hoskin, P.W.O. and Kinny, P. (2003) Atlas of zircon textures. Reviews in Mineralogy and Geochemistry, 53, 469-500.
- Crowe, W.A., Osanai, Y., Toyoshima, T., Owada, M., et al (2002) SHRIMP geochronology of a mylonite zone on Tonagh Island: characterisation of the last high-grade tectonothermal event in the Napier Complex, East Antarctica. Polar Geosciences, 15, 17-36.
- Fitzsimons, I.C.W. (2000) A review of tectonic events in the East Antarctic Shield and their implications for Gondwana and earlier supercontinents. Journal of African Earth Sciences, 3-23.
- Geisler, T., Schaltegger, U. and Tomaschek, F. (2007) Re-equilibration of zircon in aqueous fluids and melts. Elements, 3, 43-50.
- Grant, M.L., Wilde, S.A., Wu, F.Y. and Yang, J.H. (2009) The application of zircon cathodoluminescence imaging, Th-U-Pb chemistry and U-Pb ages in interpreting discrete magmatic and high-grade metamorphic events in the North China Craton at the Archean/Proterozoic boundary. Chemical Geology, 261, 155-171.
- Grew, E.S. and Manton, W.I. (1979) Archean Rocks in Antarctica: 2.5-Billion-Year Uranium-Lead Ages of Pegmatites in Enderby Land. Science, 206, 443-445.
- Guitreau, M., Boyet, M., Paquette, J.L., Gannoun, A., et al (2019) Hadean protocrust reworking at the origin of the Archean Napier Complex (Antarctica). Geochemical Perspectives Letters, 12, 7-11.
- Halla, J., van Hunen, J., Heilimo, E. and Hölttä, P. (2009) Geochemical and numerical constraints on Neoarchean plate tectonics. Precambrian Research, 174, 155-162.
- Hanchar, J.M. and Miller, C.F. (1993) Zircon zonation patterns as revealed by cathodoluminescence and backscattered electron images: implications for interpretation of complex crustal histories. Chemical Geology, 110, 1-13.
- Harley, S.L. (1983) Regional geobarometry-geothermometry and metamorphic evolution of Enderby Land, Antarctica. Antarctic Earth Science, 25, 30.
- Harley, S.L. (1985) Garnet-orthopyroxene bearing granulites from Enderby Land, Antarctica: metamorphic pressure temperature-time evolution of the Archaean Napier Complex. Journal of Petrology, 26, 819-856.
- Harley, S.L. (2016) A matter of time: the importance of the duration of UHT metamorphism. Journal of Mineralogical and Petrological Sciences, 111, 50-72.
- Harley, S.L., Hensen, B.J. and Sheraton, J.W. (1990) Two-stage decompression in orthopyroxene-sillimanite granulites from Forefinger Point, Enderby land, Antarctica: implications for the evolution of the Archaean Napier Complex. Journal of Metamorphic Geology, 8, 591-613.
- Harley, S.L. and Black, L.P. (1997) A revised Archaean chronology for the Napier Complex, Enderby Land, from SHRIMP ion-microprobe studies. Antarctic Science, 9, 74-91.
- Harley, S.L. and Motoyoshi, Y. (2000) Al zoning in orthopyroxene in a sapphirine quartzite: Evidence for >1120 °C UHT metamorphism in the Napier Complex, Antarctica, and implications for the entropy of sapphirine. Contributions to Mineralogy and Petrology, 138, 293-307.
- Harley, S.L. and Kelly, N.M. (2007) Zircon: Tiny but timely. Elements, 3, 13-18.
- Harley, S.L., Fitzsimons, I.C.W. and Zhao, Y. (2013) Antarctica and supercontinent evolution: Historical perspectives, recent advances and unresolved issues. Geological Society Special Publication, 383, 1-34.
- Harley, S.L., Kelly, N.M. and Kusiak, M.A. (2019) Chapter 35 - Ancient Antarctica: The Archean of the East Antarctic Shield. In Earth’s Oldest Rocks (Second Edition) (Kranendonk, M.J.V., Bennett, V.C. and Hoffmann, J.E. Eds.). Elsevier, 856-897.
- Hokada, T., Misawa, K., Shiraishi, K. and Suzuki, S. (2003) Mid to late Archaean (3.3-2.5 Ga) tonalitic crustal formation and high-grade metamorphism at Mt. Riiser-Larsen, Napier Complex, East Antarctica. Precambrian Research, 127, 215-228.
- Hokada, T. and Harley, S.L. (2004) Zircon growth in UHT leucosome: constraints from zircon-garnet rare earth elements (REE) relations in Napier Complex, East Antarctica. Journal of Mineralogical and Petrological Sciences, 99, 180-190.
- Hokada, T., Misawa, K., Yokoyama, K., Shiraishi, K. and Yamaguchi, A. (2004) SHRIMP and electron micropobe chronology of UHT metamorphism in the Napier Complex, East Antarctica: Implications for zircon growth at >1,000 °C. Contributions to Mineralogy and Petrology, 147, 1-20.
- Hokada, T., Motoyoshi, Y., Suzuki, S., Ishikawa, M. and Ishizuka, H. (2008) Geodynamic evolution of Mt. Riiser-Larsen, Napier Complex, East Antarctica, with reference to the UHT mineral associations and their reaction relations. Geological Society, London, Special Publications, 308, 253-282.
- Horie, K., Hokada, T., Hiroi, Y., Motoyoshi, Y. and Shiraishi, K. (2012) Contrasting Archaean crustal records in western part of the Napier Complex, East Antarctica: New constraints from SHRIMP geochronology. Gondwana Research, 21, 829-837.
- Hoskin, P.W. and Schaltegger, U. (2003) The composition of zircon and igneous and metamorphic petrogenesis. Reviews in Mineralogy and Geochemistry, 53, 27-62.
- Hoskin, P.W.O. and Black, L.P. (2000) Metamorphic zircon formation by solid-state recrystallization of protolith igneous zircon. Journal of Metamorphic Geology, 18, 423-439.
- Irvine, T.N. and Baragar, W. (1971) A guide to the chemical classification of the common volcanic rocks. Canadian Journal of Earth Sciences, 8, 523-548.
- Jeon, H. and Whitehouse, M.J. (2015) A critical evaluation of U-Pb calibration schemes used in SIMS zircon geochronology. Geostandards and Geoanalytical Research, 39, 443-452.
- Jeon, H. and Whitehouse, M.J. (2021) A robust LG-SIMS method for Sr isotope determination in apatite across a wide Sr concentration range. Geostandards and Geoanalytical Research, 45, 325-340.
- Kelly, N.M. and Harley, S.L. (2005) An integrated microtextural and chemical approach to zircon geochronology: Refining the Archaean history of the Napier Complex, east Antarctica. Contributions to Mineralogy and Petrology, 149, 57-84.
- Król, P., Kusiak, M.A., Dunkley, D.J., Wilde, S.A., et al (2020) Diversity of Archean crust in the eastern Tula Mountains, Napier Complex, East Antarctica. Gondwana Research, 82, 151-170.
- Król, P., Kusiak, M.A., Dunkley, D.J., Wilde, S.A., et al (2022) Neoarchean magmatism in the southern Scott and Raggatt Mountains, Napier Complex, east Antarctica. Precambrian Research, 106530.
- Kusiak, M.A., Whitehouse, M.J., Wilde, S.A., Dunkley, D.J., et al (2013a) Changes in zircon chemistry during Archean UHT metamorphism in the Napier Complex, Antarctica. American Journal of Science, 313, 933-967.
- Kusiak, M.A., Whitehouse, M.J., Wilde, S.A., Nemchin, A.A. and Clark, C. (2013b) Mobilization of radiogenic Pb in zircon revealed by ion imaging: Implications for early Earth geochronology. Geology, 41, 291-294.
- Kusiak, M.A., Dunkley, D.J., Wirth, R., Whitehouse, M.J., et al (2015) Metallic lead nanospheres discovered in ancient zircons. Proceedings of the National Academy of Sciences, 112, 4958-4963.
- Kusiak, M.A., Dunkley, D.J., Wilde, S.A., Whitehouse, M.J. and Kemp, A.I.S. (2021) Eoarchean crust in East Antarctica: Extension from Enderby Land into Kemp Land. Gondwana Research, 1-16.
- Ludwig, K.R. (2012) Isoplot 3.75, A Geochronological Toolkit for Microsoft Excel. Berkeley Geochronology Center Special Publication No. 5, 1-72.
- Mathieu, R., Zetterström, L., Cuney, M., Gauthier-Lafaye, F. and Hidaka, H. (2001) Alteration of monazite and zircon and lead migration as geochemical tracers of fluid paleocirculations around the Oklo-Okélobondo and Bangombé natural nuclear reaction zones (Franceville basin, Gabon). Chemical Geology, 171, 147-171.
- McDonough, W.F. and Sun, S.s. (1995) The composition of the Earth. Chemical Geology, 120, 223-253.
- Middlemost, E.A.K. (1994) Naming materials in the magma/igneous rock system. Earth Science Reviews, 37, 215-224.
- Nasdala, L., Hofmeister, W., Norberg, N., Martinson, J.M., et al (2008) Zircon M257-a homogeneous natural reference material for the ion microprobe U-Pb analysis of zircon. Geostandards and Geoanalytical Research, 32, 247-265.
- O’Connor, J. (1965) A classification for quartz-rich igneous rocks based on feldspar ratios. US Geological Survey, Professional Papers, 525B, B79-B84.
- Rubatto, D. (2002) Zircon trace element geochemistry: partitioning with garnet and the link between U-Pb ages and metamorphism. Chemical Geology, 184, 123-138.
- Rubatto, D. (2017) Zircon: The Metamorphic Mineral. Reviews in Mineralogy and Geochemistry, 83, 61-295.
- Santosh, M., Wilde, S. and Li, J. (2007) Timing of Paleoproterozoic ultrahigh-temperature metamorphism in the North China Craton: evidence from SHRIMP U-Pb zircon geochronology. Precambrian Research, 159, 178-196.
- Schaltegger, U., Fanning, C.M., Günther, D., Maurin, J.C., et al (1999) Growth, annealing and recrystallization of zircon and preservation of monazite in high-grade metamorphism: conventional and in-situ U-Pb isotope, cathodoluminescence and microchemical evidence. Contributions to Mineralogy and Petrology, 134, 186-201.
- Schaltegger, U. and Davies, J.H. (2017) Petrochronology of zircon and baddeleyite in igneous rocks: Reconstructing magmatic processes at high temporal resolution. Reviews in Mineralogy and Geochemistry, 83, 297-328.
- Sheraton, J.W. and Black, L.P. (1983) Geochemistry of Precambrian gneisses: relevance for the evolution of the East Antarctic Shield. Lithos, 16, 273-296.
- Sheraton, J.W., Ellis, D.J. and Kuehner, S.M. (1985) Rare-Earth Element Geochemistry of Archean Orthogneisses and Evolution of the East Antarctic Shield. BMR Journal of Australian Geology & Geophysics, 9, 207-218.
- Sheraton, J.W., Tingey, R.J., Black, L.P., Offe, L.A. and Ellis, D.J. (1987) Geology of Enderby Land and western Kemp Land, Antarctica. Bureau of Mineral Resources, Geology and Geophysics, Bulletin, 223, 1-51.
- Stacey, J.S. and Kramers, J.D. (1975) Approximation of terrestrial lead isotope evolution by a two-stage model. Earth and Planetary Science Letters, 26, 207-221.
- Stern, R.A., Bodorkos, S., Kamo, S.L., Hickman, A.H. and Corfu, F. (2009) Measurement of SIMS instrumental mass fractionation of Pb isotopes during zircon dating. Geostandards and Geoanalytical Research, 33, 145-168.
- Suzuki, S., Arima, M., Williams, I.S., Shiraishi, K. and Kagami, H. (2006) Thermal History of UHT Metamorphism in the Napier Complex, East Antarctica: Insights from Zircon, Monazite, and Garnet Ages. The Journal of Geology, 114, 65-84.
- Takehara, M., Horie, K. and Hokada, T. (2020) Geochemical characterization of zircon in fyfe hills of the napier complex, east Antarctica. Minerals, 10, 1-15.
- Taylor, R.J., Clark, C., Fitzsimons, I.C., Santosh, M., et al (2014) Post-peak, fluid-mediated modification of granulite facies zircon and monazite in the Trivandrum Block, southern India. Contributions to Mineralogy and Petrology, 168, 1-17.
- Taylor, R.J., Kirkland, C.L. and Clark, C. (2016) Accessories after the facts: Constraining the timing, duration and conditions of high-temperature metamorphic processes. Lithos, 264, 239-257.
- Vavra, G., Schmid, R. and Gebauer, D. (1999) Internal morphology, habit and U-Th-Pb microanalysis of amphibolite-to-granulite facies zircons: geochronology of the Ivrea Zone (Southern Alps). Contributions to Mineralogy and Petrology, 134, 380-404.
- Watson, E.B. and Liang, Y. (1995) A simple model for sector zoning in slowly grown crystals: Implications for growth rate and lattice diffusion, with emphasis on accessory minerals in crustal rocks. American Mineralogist, 80, 1179-1187.
- White, L.T. and Ireland, T.R. (2012) High-uranium matrix effect in zircon and its implications for SHRIMP U-Pb age determinations. Chemical Geology, 306, 78-91.
- Whitehouse, M.J. and Kamber, B.S. (2005) Assigning dates to thin gneissic veins in high-grade metamorphic terranes: a cautionary tale from Akilia, southwest Greenland. Journal of Petrology, 46, 291-318.
- Whitehouse, M.J., Kusiak, M., Wirth, R. and Ravindra Kumar, G. (2017) Metallic Pb nanospheres in ultra-high temperature metamorphosed zircon from southern India. Mineralogy and Petrology, 111, 467-474.
- Wiedenbeck, M., Alle, P., Corfu, F., Griffin, W.L., et al (1995) Three natural zircon standards for U-Th-Pb, Lu-Hf, trace element and REE analyses. Geostandards Newsletter, 19, 1-23.
- Yakymchuk, C., Kirkland, C.L. and Clark, C. (2018) Th/U ratios in metamorphic zircon. Journal of Metamorphic Geology, 36, 715-737.
