INTRODUCTION
Opals are natural hydrous silica with either amorphous (opal-A) or disordered cristobalite/tridymite structures (opal-CT). Opals are generally white or milky white under ambient light. Some opals are known to be tinged with iridescence, which is also known as play of color. The play of color is caused by the light diffraction from the periodic arrangement of silica nanoparticles and the unfilled void space (Sanders, 1964). Colored opals of geological interest without play of color have also been studied to date. It was reported that red and blue colors of opals were associated with Fe3+ and copper minerals (Rossman, 1994). The study of the dependence of color on trace element composition of quartz and opals from Macedonia indicated that the appearance of red and green colors was connected with Fe and Ni, respectively (Makreski et al., 2004). In addition, milky white and black colors were attributed to the presence of Ca, and Pb, Mn, and Al impurities, respectively. The high concentration inclusion of cinnabar (HgS) in minerals leads to orange and red color (Melero et al., 2019), and the cinnabar inclusion in Ethiopian opal has been reported recently (Blumentritt et al., 2022).
Opals showing photoluminescence are rare. The opal showing green fluorescence was discovered in Mexico (Fritsch et al., 2015). The origin of pink color of opals from Mexico was studied using ultraviolet (UV)-visible absorption, Raman, and Fourier-transform infrared (FT-IR) spectroscopies, and orange fluorescence with the excitation by UV light was observed for these opals (Fritsch et al., 2004). The opal from the Shikaribetsu area, Shikaoi, Hokkaido can also emit fluorescence with the excitation by UV light (Okazaki et al., 2014). The opal from the Shikaribetsu area is often orange under ambient light. The extensive investigation on the chemical composition and the fluorescence color has been performed using inductive coupled plasma analysis method by Kanai et al. (2016). However, clear relationship between the chemical composition and fluorescence color was not found. Although further investigation using polarized optical microscopy, Raman, FT-IR, and energy-dispersive X-ray fluorescence spectroscopies was performed, no clear results were obtained (Williams and Williams, 2018). The origin of the photoluminescence of the opal from Shikaribetsu area remains an open question.
Here, we report the characterization of the opal from the Shikaribetsu area using fluorescence spectroscopy. Molecules or atoms which can emit fluorescence upon UV, thermal, and electron excitations of minerals are called activators or fluorophores. The fluorescence spectra and the study of photophysical property of the opal are essentially important to understand the characteristics of the fluorophore. However, systematic study of fluorescence characteristics of the opal from Shikaribetsu area has not been reported to the best of our knowledge. The fluorescence lifetime is a property which is specific to materials emitting fluorescence. This parameter is useful as a clue to gain insight into the electronic transition responsible for the fluorescence in the fluorophore. Therefore, the fluorescence lifetime is also reported in this letter.
EXPERIMENTAL METHODS
Materials
Opals used in this work come from the Sikaribetu area, Hokkaido, Japan. The location of the sampling has been reported in a previous study (Kanai et al., 2016). A small part of the opal specimens which had been collected in Shikaoi town geopark promotion office was used for research purposes in this study. The photograph of the sample used in this study is shown in Figure 1. The opal showed various fluorescence colors such as yellow and orange with the excitation at 365 nm. A portion of the sample which showed uniform orange fluorescence was divided into flakes using a chisel. The divided flakes which showed orange fluorescence were further ground in an agate mortar to prepare the powdered samples (Fig. 1c). The powdered sample was dried in vacuum using a vacuum pump, and then stored in a glass bottle with a top in the dark before the experiments if otherwise noted.

Figure 1. (a) The opal observed under room light. (b) Fluorescence of the opal observed with excitation at 365 nm. (c) The powdered sample ground using an agate mortar. (d) Cyan fluorescence observed for the powdered sample mixed with ethanol. The sample was excited using 365 nm UV light. The background faint blue fluorescence comes from the agate mortar. (Inset) The powdered sample mixed with water. The sample was excited at 365 nm.
Methanol (HPLC grade, Junsei chemical), ethanol (special grade, Junsei chemical), acetone (special grade, Junsei chemical), toluene (special grade, Kanto chemical), and hexane (1st grade, Kanto chemical) were used as received. In the experiments of the extraction to solvents, the powdered opal of approximately 0.2 g was mixed with 5 ml of the solvent and stirred for 1 h using a PTFE coated magnetic stir bar in a glass bottle. Two-step filtration of the solution was carried out in air using a filter paper (No. 5C), and then a PTFE membrane filter having 0.20 µm of pore size (Dismic 13HP, Advantec). The aerated filtrate was stored at room temperature in the dark in a glass bottle, and handled in air for the fluorescence measurements. To prevent inner filter effects, which can adversely affect spectrofluorometric measurements, the absorbance of all solutions at the excitation wavelength was reduced to below 0.1 through dilution of the filtrate (Valeur and Berberan-Santos, 2013).
Characterization methods
The fluorescence spectrum was measured using a spectrofluorometer (Hitachi, F-4500 and JASCO, FP8500). The powdered sample was held between the quartz plates. The liquid sample was contained in a quartz cell of 1 cm optical path length. The geometry of the excitation and fluorescence light paths was right-angle observation. The bandwidths for the excitation and fluorescence were set to 2.5 and 5 nm, respectively. The fluorescence and fluorescence excitation spectra were corrected for wavelength-dependent effects such as excitation light intensity variation. Fluorescence lifetime was measured using a time-correlated single photon counting technique with the pulsed excitation light of diode lasers (Hamamatsu photonics, Quantaurus Tau). The repetition rate of the pulsed excitation laser light was 1 MHz. X-ray diffraction (XRD) pattern for the powdered sample was measured using the CuKα line (Rigaku, SmartLab). The sample powder for the XRD measurement was hold on a glass plate in air. The absorbance of the liquid sample was measured using a UV-visible spectrophotometer (Hitachi, U4100).
RESULTS AND DISCUSSION
Characterization of powdered samples
To assess the structural homogeneity of the opal, multiple samples were prepared from the flakes which uniformly showed orange fluorescence as described above and analyzed using XRD measurements. The typical powder XRD patterns obtained using two of the prepared samples are shown in Figure 2. Every samples showed the XRD pattern similar to those in Figure 2, and therefore the samples were nearly structurally homogeneous. The d-spacing which was calculated from a broad peak at ∼ 22° was 4.04 Å, showing that the sample can be identified as opal-A (Curtis et al., 2019).

Figure 2. XRD pattern of the powdered opal. The results obtained using two samples prepared from the flakes uniformly showing orange fluorescence are shown. See the text for details of the sample preparation. The baseline of the data of the sample 1 is shifted vertically for clarity.
The fluorescence spectrum of the powdered sample obtained with excitation at 365 nm is shown in Figure 3. We measured the fluorescence and fluorescence excitation spectra of different samples, and the typical spectrum is shown in Figure 3. The broad fluorescence spectrum was observed from 450 to 750 nm. The spectrum had a maximum at approximately 590 nm, corresponding to orange fluorescence color of the opal. In the fluorescence excitation spectrum measurement, the intensity of fluorescence at a given wavelength was recorded while varying the wavelength of excitation light. The absorption spectrum of the fluorophore which is present in the powdered sample can be measured using the fluorescence excitation spectrum. In the fluorescence excitation spectrum (Fig. 3), three major excitation peaks were observed at about 358, 410, and 475 nm.

Figure 3. Fluorescence spectrum obtained with the excitation at 365 nm, and fluorescence excitation spectrum obtained by monitoring the fluorescence at 582 nm. The 38L (380 nm) long-pass filter was used for recording the fluorescence spectrum. The spiky peak at 730 nm in the fluorescence spectrum was ascribed to the experimental artifact of the second-order diffraction of the excitation light through the monochromator of the spectrofluorometer.
The fluorescence lifetime is useful to determine whether the electronic transition of the fluorophore is allowed or forbidden. Fluorescence decay curve observed with excitation at 365 nm is shown in Figure 4. Three-component exponential function was used in the fitting of the decay curve:
| \begin{equation}
I(t) = \sum_{i=1}^{3}A_{i}\exp\left(-\frac{t}{\tau_{i}}\right)
\end{equation}
| (1), |
where I(t) is the fluorescence intensity as a function of time t, Ai is the preexponential factor of the i-th component, and τi is the lifetime. The fitting parameters of the lifetimes and preexponential factors are shown in Table 1. The average fluorescence lifetime, $\langle \tau \rangle = \sum_{i=1}^{3}A_{i}\tau_{i}$, varied between approximately 5 and 10 ns depending on the sample and the excitation wavelength. One of the typical results of the fitting of the fluorescence decay curve is shown in Table 1.

Figure 4. (Black) Fluorescence decay curve observed with the excitation at 365 nm. The fluorescence was monitored at 593 nm. (Red) The result of fitting. (Dashed blue) The instrument response function (IRF).
Table 1. Fitting results of the fluorescence decay curves of the powdered opal
| Exc. (nm) |
Obs. (nm) |
$\langle \tau \rangle$ (ns) |
τ1 (ns) (A1) |
τ2 (ns) (A2) |
τ3 (ns) (A3) |
| 365 |
593 |
6.53 |
0.65 (0.76) |
3.83 (0.20) |
14.22 (0.04) |
| 405 |
596 |
5.72 |
0.83 (0.73) |
3.36 (0.20) |
11.60 (0.07) |
| 470 |
615 |
5.97 |
0.96 (0.76) |
4.32 (0.21) |
16.74 (0.03) |
Exc., excitation wavelength; Obs., observed emission wavelength.
Extraction of fluorophores to solvents
The fluorescence color of the opal changed from orange to bright cyan upon adding ethanol to the powdered sample (Fig. 1d). The cyan fluorescence was similarly observed using methanol, acetone, toluene, and hexane. When water was added to the dried sample, orange fluorescence was observed, and fluorescence color did not change from that of the dried powdered sample. This intriguing observation upon addition of organic solvent indicates that fluorophore was extracted from the solid opal to the solvent. Therefore, it is suggested from our observations that the fluorophore in the opal is organic molecules that are easily soluble in organic solvents. The opal samples which were treated with solvents and dried in air still emitted orange fluorescence, and the fluorescence spectrum was similar to that shown in Figure 3.
Three-dimensional fluorescence spectrum of fluorescence intensity as a function of both excitation and emission wavelengths is shown in Figure 5. We can obtain a comprehensive overview of the entire range of absorption and fluorescence spectra of the fluorophore present in the solvent from the three-dimensional spectrum. The fluorophore could be excited in the range from approximately 450 nm to shorter wavelength. The fluorescence intensity became stronger as the excitation wavelength was shortened, and the excitation maximum was observed in the region close to 300 nm of the excitation light. The fluorescence spectrum exhibited the peaks in the 420-460 nm range across all excitation wavelengths. This result shows that the major fluorophore is organic molecules that show the cyan fluorescence with the maximum at 420-460 nm, and the amount of the fluorophore capable of emitting fluorescence at longer wavelength is negligibly small.
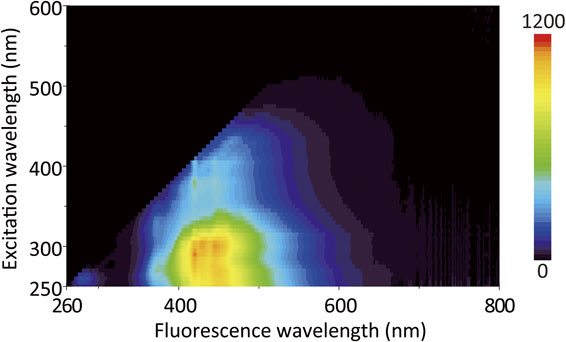
Figure 5. Three-dimensional fluorescence spectrum of the extract to ethanol. The intensity of fluorescence is indicated using the color scale in arbitrary units.
The fluorescence and fluorescence excitation spectra of the fluorophores extracted to the solvents are shown in Figures 6 and 7. In ethanol, fluorescence spectrum was observed in the range from 400 to 600 nm with the relatively sharp bands at 422 and 446 nm. Fluorescence excitation spectra showed the maxima at 404 and 383 nm and a shoulder band at 418-420 nm. The sharp peaks can be assigned to the vibrational structure upon the vertical electronic transition of organic molecules (Valeur and Berberan-Santos, 2013). The fluorescence and fluorescence excitation spectra of the samples extracted to nonpolar hexane showed similar characteristics to those extracted to ethanol. The sample extracted with toluene showed a relatively strong fluorescence excitation maximum at 409 nm and a shoulder band at 420 nm.

Figure 6. Fluorescence spectra of the samples extracted to the solvents observed with the excitation at 365 nm.

Figure 7. (a) Fluorescence excitation spectra of the samples extracted to the solvents. The fluorescence was monitored at 421 (ethanol), 421 (acetone), 421 (methanol), 423 (toluene), and 420 nm (hexane). (b) The figure from (a) has been enlarged for a clearer illustration of the spectral features.
The fluorescence lifetime was measured for these solvents (Table 2). The fitting was performed using two-component exponential decay function. The average lifetime $\langle \tau \rangle$ was approximately 8 ns. The fluorescence lifetime varied slightly depending on the solvent used for extraction. The fluorescence lifetime of the order of nanoseconds is typically observed for the allowed π-π* transition of π-conjugated organic molecules or fluorescent dye molecules (Valeur and Berberan-Santos, 2013). In general, the fluorescence decay of fluorophores dissolved in solvents follows the exponential with one component of the form $I(t) = A\exp \left(-\frac{t}{\tau}\right)$. The two-component fluorescence decay shows that at least two distinct fluorescent organic molecules were mixed in the solvents. The composition of the molecules in the solvent should depend on the solvents used for the extraction. The change of the fluorescence and excitation spectra with changing the solvents indicates that the composition of the molecules in the solvent is different from each other. Therefore, the results of the fluorescence lifetime and fluorescence spectra are consistent with the presence of multiple organic molecules as fluorophore in the opal.
Table 2. Fitting results of the fluorescence decay curves of the samples extracted to the solvents
| Solvent |
Obs. (nm) |
$\langle \tau \rangle$ (ns) |
τ1 (ns) (A1) |
τ2 (ns) (A2) |
| Ethanol |
420 |
8.24 |
3.63 (0.75) |
12.34 (0.25) |
| Acetone |
420 |
6.64 |
2.86 (0.70) |
9.35 (0.30) |
| Methanol |
420 |
7.67 |
3.34 (0.65) |
10.89 (0.35) |
| Toluene |
420 |
7.54 |
2.83 (0.70) |
10.35 (0.30) |
| Hexane |
445 |
8.24 |
3.89 (0.70) |
11.61 (0.30) |
The samples were excited at 365 nm.
Obs., observed emission wavelength.
The origin of the fluorescence of the opal from Shikaribetsu
Trivalent ions of some lanthanide elements can show photoluminescence in minerals (Sidike et al., 2003; Czaja et al., 2012). The emission spectrum of the trivalent lanthanide ions originates from the 4f-4f transitions. The 4f-4f transitions are forbidden according to the selection rule of the electronic transition, and their emission intensities are usually weak. Lanthanide elements exhibit the sharp 4f-4f transitions at characteristic wavelengths that are specific to each elements. However, the observed fluorescence spectrum was rather broad and the sharp bands were not observed (Fig. 3). Accordingly, the fluorescence is not attributable to the lanthanide ions. Although the divalent Eu2+ ion can emit broad blue photoluminescence in fluorite, the fluorescence color is not consistent with the observed one. Therefore, the Eu2+ ion is not the origin of the fluorescence of the opal.
The d-d transition of the Mn2+ complex is known as the origin of the photoluminescence in the range from 560 to 700 nm (from orange to red) in many minerals (Gaft et al., 2015). The d-d transition is forbidden according to the Laporte selection rule, but weakly occurs upon the structural distortion of the complex. The emission lifetime of the forbidden d-d transition should be generally longer than the order of microseconds. The fluorescence lifetime in this study with the time scales of nanoseconds was much shorter than that expected for the d-d transition of Mn2+ ion, and therefore our results are not consistent with the d-d transition of Mn2+ ion.
The origin of the pink color and fluorescence of the opals from Mexico were studied in detail by Fritsch et al. (2004). It was proposed that the coloration and fluorescence originated from quinone molecules. While it was also suggested that the extraction from the opal would be necessary to characterize quinones in detail, the authors did not perform the extraction because they did not have enough material to attempt the experiment. We could extract organic compounds from the opal samples using various organic solvents, and the fluorescence properties of the extracted compounds as well as the solid opals were thoroughly investigated. To the best of our knowledge, this study is the first study of the origin of the fluorescence of the opals using the solvent extraction.
A new hydrocarbon mineral named Hokkaidoite has been reported by Tanaka et al. very recently (Bosi et al., 2023). The Hokkaidoite was discovered from the same locality with that of the fluorescent opal. The Hokkaidoite is the crystal of benzo[g,h,i]perylene (BPer), showing yellowish to yellowish-green fluorescence upon the excitation with UV light. In addition, a part of minerals from the same locality is believed to include karpatite (Sagami Chemical Research Institute, 2023). Karpatite is a mineral composed of pure coronene (Cor) (Echigo et al., 2007).
It is reasonable to consider that the opal used in this study also contains these two polycyclic aromatic hydrocarbons (PAHs) as fluorophore. In a previous study (Aihara et al., 1970), it was reported that the absorption spectrum of BPer in hexane showed a weak peak at 405 nm and a strong peak at 383 nm. Cor in benzene showed the weak peaks at 428 and 419 nm and a strong peak at 410 nm. The peak positions in the fluorescence excitation spectrum of the extract to hexane (Fig. 7) closely match those in the absorption spectrum of BPer, although the peak at 383 nm reported in the previous study was not obvious for the sample in this study. The extract to toluene exhibited a fluorescence excitation peak at 409 nm, which closely matched the absorption band of Cor. Cor in aerated hexane has been reported to exhibit a single exponential fluorescence lifetime of 8.0 ns (Davenport and Targowski, 1996). Their result is close to the fluorescence lifetime obtained in this study. Perylene is also a member of the family of PAHs. The fluorescence peak of perylene in solvent is located at approximately 470 nm, and the fluorescence lifetime is approximately 6-7 ns (Berlman, 1965). Therefore, our results suggest that the opal that exhibits orange fluorescence contains the PAHs such as Cor, BPer, and perylene.
The crystal of Cor shows blue or green fluorescence when excited with UV light (Potticary et al., 2017). The fluorescence of the crystal of BPer is yellowish or yellowish-green (Sagami Chemical Research Institute, 2023). The fluorescence of the crystals of these two molecules is inconsistent with the orange fluorescence of the opal. There are two possible explanations of the different color. The first is that the fluorescence of the opal comes from PAHs other than BPer and Cor. In the solid phase of organic molecules, the energy transfer plays an important role in photophysics. The fluorescence of the crystal of perylene is orange, or green depending on the polymorph (Tanaka, 1963). The wavelength of orange fluorescence (600 nm) is longer than those for BPer and Cor, suggesting that the energy level of the exited state of the corresponding perylene crystal is lower than those for BPer and Cor. If perylene microcrystals are present even as impurity in the solid phase, the microcrystals can be an energy trap site which emits the orange fluorescence. It is also inferred that PAHs which are different from BPer, Cor, and perylene may also be present as the mixture, and behave the fluorophore of the opal. The second explanation is the difference in the nanomorphology of crystals at nanoscale. Although synthetic Cor crystal shows green fluorescence, natural karpatite shows blue fluorescence despite the fluorescence of the same molecule. It was suggested that the blue fluorescence of natural karpatite originates from the photonic nanotexture that is not present in the crystal synthesized in the laboratory (Potticary et al., 2017).
The coloration and fluorescence of minerals induced by quinone molecules has been proposed in some previous studies. It was reported that a pink Eocene clay mineral contained several quinone molecules having different structures (Prowse et al., 1991). The structures of these quinone molecules were all based on the peri-xanthenoxanthenequinone skeleton. It was proposed that the pink opals from Mexico similarly contained quinone molecules (Fritsch et al., 2004). The possibility of the presence of organic material during the formation of the opal from Shikaribetsu has been mentioned in a previous study, although clear experimental results were not obtained (Williams and Williams, 2018). As far as we know, this letter represents the initial documentation suggesting that the opal exhibits fluorescence due to the presence of PAH, accompanied by supportive experimental evidence. This study will lead to understanding of the formation process of the opal in the Shikaribetsu volcano area.
