ORIGINAL ARTICLE
Applicability of some trace element discrimination diagrams to rhyolites: Tectonic interpretation of silicic volcanism during opening of the Sea of Japan
2025 Volume 120 Issue 1 Article ID: 241128

Details
2025 Volume 120 Issue 1 Article ID: 241128
Rhyolite, a volcanic rock with high SiO2 content (≥69 wt%; sensu lato), is commonly found in a range of tectonic settings. Because few tectonic discrimination diagrams have been proposed for rhyolites, the major and trace element compositions of rhyolites from syn-collision zones, continental arcs, oceanic arcs, within-continental plate settings, and within-oceanic plate settings were compiled and plotted on previously proposed Y versus Nb, Y + Nb versus Rb, and Zr versus (Nb/Zr)N discrimination diagrams. The results indicate that the Y versus Nb and Y + Nb versus Rb diagrams are highly effective for distinguishing between orogenic (collision and arc-related) and anorogenic (within-plate) tectonic settings. Especially on the Y versus Nb diagram, immature arc rhyolites are characterized by significantly lower Nb concentrations compared to mature arc rhyolites, clearly discriminating between them. However, syn-collisional rhyolites often plot within the volcanic arc granite field on the Y + Nb versus Rb diagram. Thus, it is difficult to distinguish between syn-collisional rhyolites and mature arc rhyolites. The Zr versus (Nb/Zr)N diagram enables relatively effective discrimination among within-plate rhyolites, syn-collisional rhyolites, and immature arc rhyolites. Nevertheless, this diagram also fails to clearly separate syn-collisional from mature arc rhyolites. This overlap would be due to the similar source characteristics of syn-collision and mature arc rhyolites, derived from thick continental crust. In contrast, immature arc rhyolites are interpreted to originate predominantly from a mantle-derived magma source. Although within-continental plate rhyolites tend to exhibit slightly higher Rb concentrations than within-oceanic plate rhyolites, none of the three discrimination diagrams can reliably differentiate between within-continental and within-oceanic plate rhyolites. Despite these limitations, the power of discrimination of the three diagrams was utilized to evaluate and interpret the tectonic setting of silicic volcanism associated with the back-arc spreading in the Sea of Japan (∼ 23-15 Ma). The compiled data show that the early-stage rhyolites during opening of the Sea of Japan display geochemical signatures consistent with a within-plate setting and a crustal source, whereas the late-stage rhyolites exhibit characteristics of volcanic arc settings with a strong mantle source influence. These results are consistent with tectonic models proposed in previous studies and demonstrate the utility of trace element discrimination diagrams for evaluating silicic volcanism related to back-arc spreading.
Since Pearce and Cann (1971, 1973) introduced the concept of using rock chemistry to ‘fingerprint’ different tectonic settings, trace element discrimination diagrams have been developed primarily for basaltic rocks and are widely used in the geological, petrological, and geochemical communities (Rollinson and Pease, 2021). When studying ancient rocks whose original petrogenetic context is not apparent, these diagrams can assist in tectonic interpretation.
Rhyolite is a volcanic rock with high SiO2 content, typically above ∼ 69 wt% (Le Maitre et al., 2002). Rhyolitic volcanism commonly occurs in collision zones, subduction zones, hotspots, and intraplate rift zones. Although granite (sensu lato) is also a high-SiO2 igneous rock, it differs from rhyolite in that it is an intrusive (plutonic) rock. As granite is the main component of the continental crust, many researchers have studied its petrogenesis and developed classification schemes. For example, the Y versus Nb and Y + Nb versus Rb diagrams proposed by Pearce et al. (1984) are commonly used to determine the geotectonic origins of granitoids. Although few tectonic discrimination diagrams have been proposed specifically for rhyolites (e.g., Thiéblemont and Tégyey, 1994), the granite discrimination diagrams proposed by Pearce et al. (1984) are still commonly applied to rhyolites for tectonic discrimination.
Back-arc spreading in the Sea of Japan (∼ 23-15 Ma) led to extensive volcanism ranging from basaltic to rhyolitic compositions in the Japanese Arc. These rhyolitic magmas are considered to have been generated through melting or assimilation of the continental crust (Shuto et al., 2006; Yamada et al., 2023; Al-Busaidi et al., 2024). As back-arc basin basalts exhibit chemically intermediate compositions between mid-ocean ridge and island arc basalts (Pearce and Stern, 2006), back-arc regions represent tectonically complex settings between divergent and convergent plate boundaries. This study aims to provide a tectonic interpretation on rhyolites from back-arc basin regions, using trace element discrimination diagrams.
In this study, Cenozoic and Late Cretaceous rhyolites from various tectonic settings were compiled and plotted on the discrimination diagrams proposed by Pearce et al. (1984) and Thiéblemont and Tégyey (1994) to evaluate their reliability in distinguishing the tectonic settings of rhyolites from back-arc basin regions. The results also provide insights into the tectonic setting of Miocene rhyolites related to back-arc spreading during the opening of the Sea of Japan.
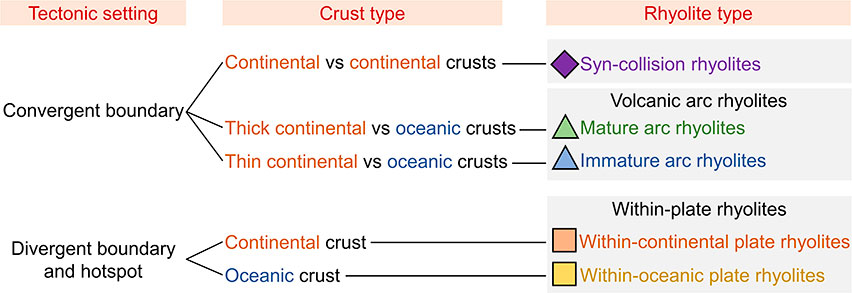
Based on the rhyolite (sensu stricto) field on the total alkali (Na2O + K2O) versus SiO2 diagram proposed by Le Maitre et al. (2002), volcanic rocks with whole-rock SiO2 contents of ≥69 wt% are considered rhyolites (sensu lato). Whole-rock geochemical data of rhyolites were gathered from global Cenozoic and Late Cretaceous rhyolite lavas and pyroclastic rocks that can be distinguished according to their tectonic settings, as summarized in Supplementary Document (Supplementary Document is available online from https://doi.org/10.2465/jmps.241128). These tectonic settings, based on the classification proposed by Pearce et al. (1984), include syn-collisional rhyolites, mature arc rhyolites, immature arc rhyolites, within-continental plate rhyolites, and within-oceanic plate rhyolites (Fig. 1; Table 1). Although significant collisional settings also occur along arc-arc plate boundaries, such as the Japan-IBM (Izu-Bonin-Mariana) arcs, this study focuses on the Eurasian-Indian continental collision zone as a representative example of continental collision. Arcs were classified as either mature or immature, based on the thickness of the continental crust. Mature arcs, such as the Andean and Japanese arcs, are characterized by relatively thicker continental crust compared to immature arcs, including the Izu-Bonin-Mariana and Scotia arcs. Silicic volcanism within tectonic plates predominantly occurs in continental settings and only rarely in oceanic ones. Yellowstone in the United States and Iceland are representative examples of within-plate silicic volcanism in continental and oceanic plates, respectively.
| Rhyolite type | Area name | Number | SiO2 (wt%; ±2SE) |
Na2O + K2O (wt%; ±2SE) |
| Syn-collision rhyolites | Anatolia-Iran, Himalaya-Tibet | 75 | 75.78 ± 0.76 | 7.52 ± 0.30 |
| Mature arc rhyolites | Aegean Arc, Andean Arc, Cascade Arc, NE Japan Arc, New Zealand, Sunda Arc, the Phillipines, SW Japan Arc | 197 | 73.79 ± 0.34 | 7.60 ± 0.13 |
| Immature arc rhyolites | Aleutian Arc, Izu-Bonin-Mariana Arc, Kuril Arc, Scotia Arc, Tonga Arc | 70 | 73.36 ± 0.43 | 6.22 ± 0.20 |
| Within-continental plate rhyolites | Deccan Trap, Great Rift Valley, Yellowstone-Snake River Plain | 62 | 75.42 ± 0.51 | 8.70 ± 0.23 |
| Within-oceanic plate rhyolites | Ascension Island, Galápagos Islands, Iceland, Kerguelen Plateau | 55 | 75.23 ± 0.67 | 8.26 ± 0.36 |
| Syn-Sea of Japan opening rhyolites | Niigata, Toyama, Ishikawa, Fukui, Shimane | 39 | 76.53 ± 0.33 | 7.43 ± 0.12 |
| Rhyolite type | A/CNK (±2SE) |
A/NK (±2SE) |
Rb (ppm; ±2SE) |
Y (ppm; ±2SE) |
Zr (ppm; ±2SE) |
Nb (ppm; ±2SE) |
| Syn-collision rhyolites | 1.16 ± 0.04 | 1.41 ± 0.07 | 216 ± 37 | 22 ± 3 | 138 ± 14 | 17.5 ± 2.7 |
| Mature arc rhyolites | 1.07 ± 0.02 | 1.39 ± 0.03 | 109 ± 8 | 24 ± 2 | 141 ± 10 | 11.3 ± 0.7 |
| Immature arc rhyolites | 0.97 ± 0.02 | 1.54 ± 0.04 | 26 ± 5 | 32 ± 4 | 134 ± 18 | 2.5 ± 0.6 |
| Within-continental plate rhyolites | 0.95 ± 0.05 | 1.05 ± 0.06 | 182 ± 15 | 104 ± 13 | 751 ± 128 | 125 ± 22 |
| Within-oceanic plate rhyolites | 0.94 ± 0.02 | 1.12 ± 0.04 | 94 ± 10 | 103 ± 10 | 822 ± 125 | 94 ± 15 |
| Syn-Sea of Japan opening rhyolites | 1.17 ± 0.03 | 1.33 ± 0.03 | 125 ± 9 | 40 ± 3 | 258 ± 18 | 11.4 ± 1.2 |
A/CNK, Al2O3/(CaO + Na2O + K2O); A/NK, Al2O3/(Na2O + K2O); SE, standard error.
In addition, data on Miocene rhyolites from the Japan Arc, formed during the opening of the Sea of Japan (referred to as syn-Sea of Japan opening rhyolites), were compiled. These rhyolites can be further subdivided into the early-stage (23-22 Ma) and the late-stage (18-15 Ma) volcanism associated with the opening of the Sea of Japan. During the early stage (23-22 Ma, or possibly 24-22 Ma), prior to the rapid rifting of the Sea of Japan, extensive rhyolitic pyroclastic density currents were deposited across various regions of the Japan Arc (Yamada et al., 2025). Following the development of a regional unconformity between 22-18 Ma, bimodal basaltic-rhyolitic volcanism became widespread during the main phase of Sea of Japan opening (18-15 Ma), coinciding with rotation of the Japan Arc (Yamada et al., 2023).
Trace element discrimination diagramsThe compiled dataset was plotted on the Y versus Nb, Y + Nb versus Rb, and Zr versus (Nb/Zr)N diagrams proposed by Pearce et al. (1984) and Thiéblemont and Tégyey (1994). The availability of these trace elements is relatively high compared to other trace elements, such as rare earth elements, because they can also be determined through routine analyses using X-ray fluorescence (XRF) spectrometry.
Pearce et al. (1984) compiled compositional data for over 600 granitic rocks, defined as plutonic rocks containing more than 5% modal quartz, to develop trace element discrimination diagrams, including Y versus Nb, Yb versus Ta, Y + Nb versus Rb, and Yb + Ta versus Rb. On the Y versus Nb diagram, granites can be divided into three tectonic groups: volcanic arc granites and syn-collision granites (VAG + syn-COLG), within-plate granites (WPG), and ocean ridge granites (ORG). These groups can be further classified into orogenic types (VAG + syn-COLG) and anorogenic types (WPG + ORG). In addition, syn-COLG can be distinguished from VAG on a Y + Nb versus Rb diagram as well as from other tectonic groups. However, Pearce et al. (1984) and Verma et al. (2012) identified several issues and limitations associated with using these diagrams to discriminate collision-zone granites. In certain cases, granites from collisional settings plot broadly across the syn-COLG, VAG, and WPG fields.
Thiéblemont and Tégyey (1994) compiled more than 10000 compositional data of differentiated igneous rocks with SiO2 ≥55 wt%. A discrimination diagram based on Zr contents and Nb/Zr ratios normalized by the primitive mantle composition of Hofmann (1988) can distinguish between differentiated volcanic and plutonic rocks from continent-continent collision zones, subduction zones, and intra-plate settings (Thiéblemont and Tégyey, 1994). Thiéblemont and Tégyey (1994) noted a petrogenetic limitation of tectonic discrimination using Zr and Nb due to comparable Zr contents and Nb/Zr ratios between differentiated igneous rocks in continental tholeiitic provinces and in some collisional/post-collisional settings.
The total alkali contents of immature arc rhyolites are generally ∼ 1-3 wt% lower than those of rhyolites in the other tectonic settings (Fig. 2a). Peralkaline compositions are restricted to within-plate rhyolites, and the other rhyolites overlap the metaluminous and peraluminous fields in Figure 2b. Similarly, syn-collision and mature arc rhyolites are more enriched in Rb, Y, Zr, and Nb than are immature arc rhyolites (Figs. 3a-3l). This reflects lower proportion of continental crustal material or terrigenous sediment input in immature arc setting (Chen et al., 2024). On the other hand, within-plate rhyolites are clearly more enriched in high field strength elements (HFSEs), including Y, Zr, and Nb. This can be explained by the fact that HFSE are relatively immobile in hydrous environments (e.g., Rollinson and Pease, 2021). Therefore, the spread of data on the three discrimination diagrams shown in Figure 3 is thought to be controlled mainly by crustal input, the presence of H2O, and source material during magma generation.

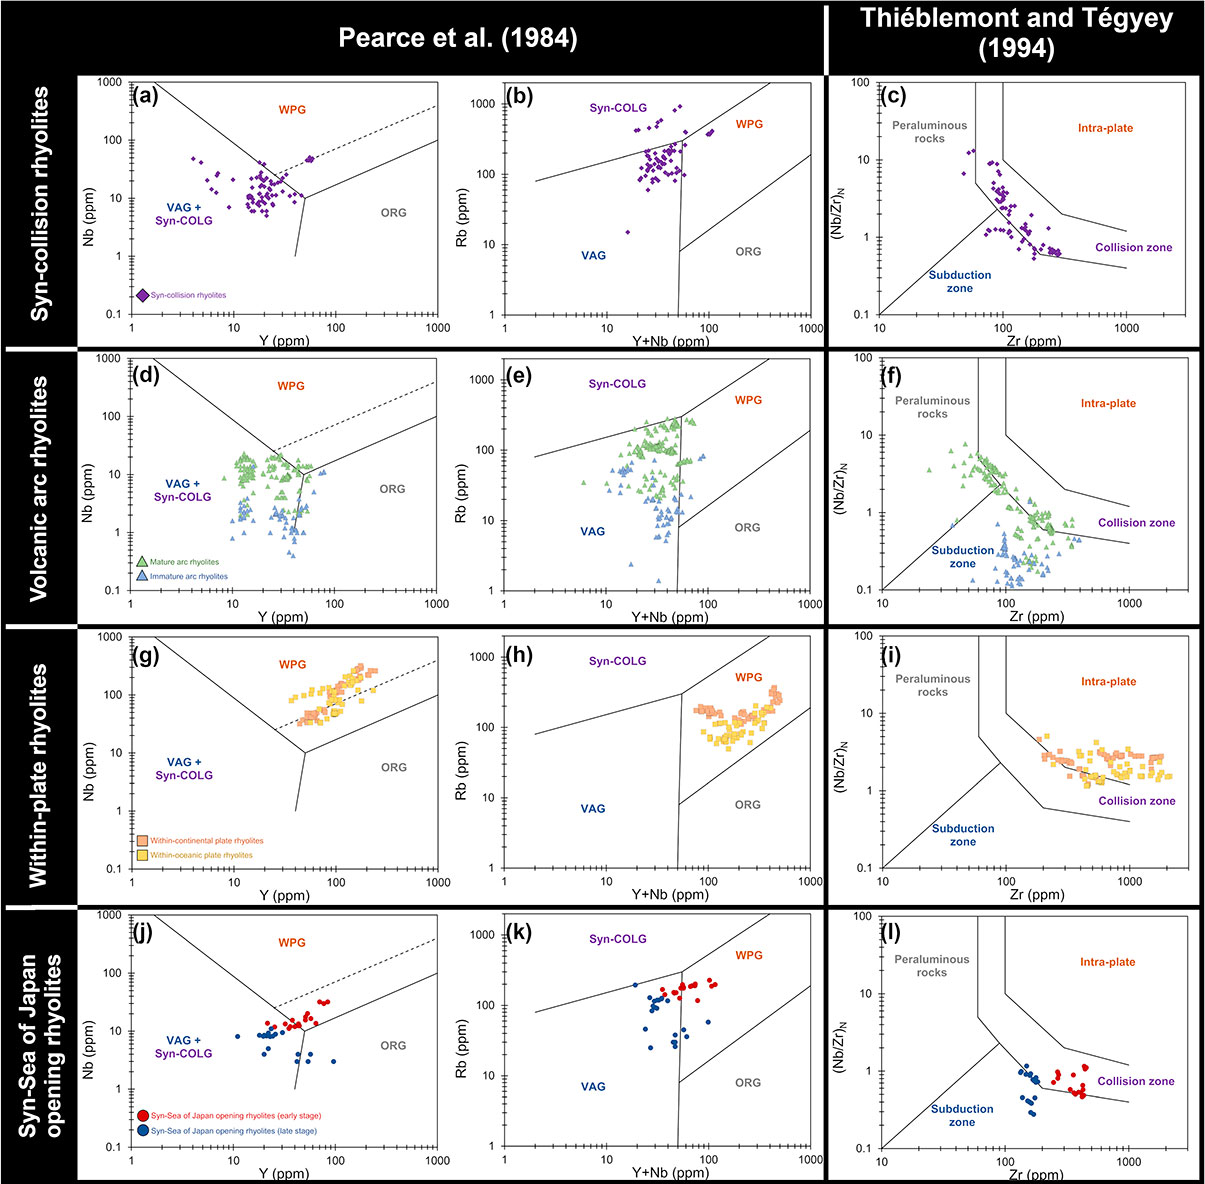
In the Y versus Nb diagram (Figs. 3a, 3d, and 3g), a clear distinction is observed between orogenic (syn-collisional and volcanic arc) and anorogenic (within-plate) rhyolites. The orogenic group predominantly plots within the volcanic arc and syn-collisional granite field (VAG + syn-COLG), including syn-collisional (93.3%), mature arc (90.9%), and immature arc (71.4%) settings. In contrast, the anorogenic group plots within the within-plate granite field, comprising within-continental (100%) and within-oceanic (100%) settings. However, the Y versus Nb diagram does not effectively discriminate between mature volcanic arc and syn-collisional rhyolites. Although Pearce et al. (1984) did not address this distinction, the data show that immature arc rhyolites display notably lower Nb concentrations than both syn-collisional and mature arc rhyolites (Figs. 3a and 3d). This observation suggests that immature arc settings may be distinguishable from the others by an approximate discrimination line passing through the coordinates (Y, Nb) = (10, 4.5) and (70, 3). Similar results were obtained for the Y + Nb versus Rb diagram as for the Y versus Nb diagram. Specifically, although Pearce et al. (1984) introduced the Y + Nb versus Rb diagram to distinguish between VAG and syn-COLG settings, the present analysis demonstrates that this diagram does not effectively discriminate between collisional and mature arc rhyolites (Table 2). This observation is consistent with the limitations and issues previously noted by Pearce et al. (1984) and Verma et al. (2012) regarding the applicability of this discrimination diagram.
| Number / Total (%) |
A/CNK versus A/NK diagram | Y versus Nb diagram | ||||
| Per- aluminous |
Met- aluminous |
Per- alkaline |
VAG + Syn-COLG |
WPG | ORG | |
| Syn-collision rhyolites | 65 / 75 (86.7%) |
10 / 75 (13.3%) |
0 / 75 (0%) |
70 / 75 (93.3%) |
5 / 75 (6.7%) |
0 / 75 (0%) |
| Mature arc rhyolites | 141 / 197 (71.6%) |
56 / 197 (28.4%) |
0 / 197 (0%) |
179 / 197 (90.9%) |
4 / 197 (2.0%) |
14 / 197 (7.1%) |
| Immature arc rhyolites | 27 / 70 (38.6%) |
43 / 70 (61.4%) |
0 / 70 (0%) |
50 / 70 (71.4%) |
0 / 70 (0%) |
20 / 70 (28.6%) |
| Within-continental plate rhyolites | 23 / 62 (37.1%) |
21 / 62 (33.9%) |
18 / 62 (29.0%) |
2 / 62 (3.2%) |
60 / 62 (96.8%) |
0 / 62 (0%) |
| Within-oceanic plate rhyolites | 7 / 55 (12.7%) |
35 / 55 (63.6%) |
13 / 55 (23.6%) |
0 / 55 (0%) |
55 / 55 (100%) |
0 / 55 (0%) |
| Syn-Sea of Japan opening rhyolites | 38 / 39 (97.4%) |
1 / 39 (2.6%) |
0 / 39 (0%) |
28 / 39 (71.8%) |
8 / 39 (20.5%) |
3 / 39 (7.7%) |
| Number / Total (%) |
Y + Nb versus Rb diagram | Zr versus (Nb/Zr)N diagram | ||||||
| Syn- COLG |
VAG | WPG | ORG | Collisional zone |
Subduction zone |
Intra-plate | Peraluminous rocks |
|
| Syn-collision rhyolites | 16 / 75 (21.3%) |
52 / 75 (69.3%) |
7 / 75 (9.3%) |
0 / 75 (0%) |
47 / 75 (62.7%) |
25 / 75 (33.3%) |
0 / 75 (0%) |
3 / 75 (4.0%) |
| Mature arc rhyolites | 9 / 197 (4.6%) |
170 / 197 (86.3%) |
18 / 197 (9.1%) |
0 / 197 (0%) |
83 / 197 (42.1%) |
83 / 197 (42.1%) |
0 / 197 (0%) |
31 / 197 (15.7%) |
| Immature arc rhyolites | 0 / 70 (0%) |
64 / 70 (91.4%) |
6 / 70 (8.6%) |
0 / 70 (0%) |
1 / 70 (1.4%) |
69 / 70 (98.6%) |
0 / 70 (0%) |
0 / 70 (0%) |
| Within-continental plate rhyolites | 0 / 62 (0%) |
0 / 62 (0%) |
62 / 62 (100%) |
0 / 62 (0%) |
17 / 62 (27.4%) |
0 / 62 (0%) |
45 / 62 (72.6%) |
0 / 62 (0%) |
| Within-oceanic plate rhyolites | 0 / 55 (0%) |
0 / 55 (0%) |
55 / 55 (100%) |
0 / 55 (0%) |
22 / 55 (40.0%) |
0 / 55 (0%) |
33 /55 (60.0%) |
0 / 55 (0%) |
| Syn-Sea of Japan opening rhyolites | 1 /39 (2.6%) |
24 / 39 (61.5%) |
14 /39 (35.9%) |
0 / 39 (0%) |
11 / 39 (28.2%) |
28 / 39 (71.8%) |
0 / 39 (0%) |
0 39 (0%) |
ORG, ocean ridge granites; Syn-COLG, syn-collision granites; VAG, volcanic arc granites; WPG, within plate granites.
With regard to the Zr versus (Nb/Zr)N diagram, it fails to effectively discriminate mature arc rhyolites, which are distributed almost equally between the subduction zone (42.1%) and collision zone (42.1%) fields (Table 2). 62.7% of collision rhyolites plot in the correct field. However, it is still difficult to discriminate collision and mature arc rhyolites. For immature arc and within-plate rhyolites, the Zr versus (Nb/Zr)N diagram yielded generally consistent results with those obtained from the Y versus Nb and Y + Nb versus Rb diagrams. Specifically, 96.8% of immature arc rhyolites plot within the subduction zone field, while 72.6% of within-continental plate rhyolites and 60.0% of within-oceanic plate rhyolites plot within the intra-plate field.
These results indicate that the trace element discrimination diagrams [Y versus Nb, Y + Nb versus Rb, and Zr versus (Nb/Zr)N diagrams] proposed by Pearce et al. (1984) and Thiéblemont and Tégyey (1994) can be effectively applied to rhyolites (sensu lato; SiO2 ≥69 wt%). However, several limitations should be considered when applying these diagrams: (1) Collision rhyolites are generally not well discriminated using these diagrams, especially Y versus Nb and Y + Nb versus Rb diagrams. Moreover, it is often difficult to distinguish between collision and mature arc rhyolites. Thiéblemont (1999) argued that the primary distinction between the subduction and collision fields lies in the source of the magmas: predominantly mantle-derived in subduction settings and crustal-derived in collisional settings. This distinction is clearly illustrated by the Andes, where felsic rocks from the overthickened segment of the arc (i.e., the Central Andes) plot within the collision field, whereas those from the more typical arc segments (i.e., the Southern Andes) plot within the subduction field (Thiéblemont, 1999). (2) Within-continental and within-oceanic plate rhyolites cannot be reliably distinguished using any of the diagrams. Nevertheless, within-continental rhyolites tend to exhibit slightly higher Rb concentrations compared to their within-oceanic counterparts (Fig. 3h).
Implications for silicic volcanism during opening of the Sea of JapanRhyolites formed during the opening of the Sea of Japan (syn-Sea of Japan opening rhyolites), a back-arc basin, should yield intermediate compositions between those of subduction-zone and rift-zone volcanism, because the silicic volcanism during the opening of the Sea of Japan was triggered by the injection of hot asthenospheric mantle into the mantle wedge followed by crustal melting (Shuto et al., 2006; Yamada et al., 2023). In fact, early stage opening rhyolites mainly plot in the WPG field (anorogenic type), while late stage opening rhyolites plot in the VAG + syn-COLG field (orogenic type) in Y versus Nb and Y + Nb versus Rb discrimination diagrams (Figs. 3j and 3k). This is consistent with a transitional setting from continental rift to mature arc during the opening of the Sea of Japan.
In the Zr versus (Nb/Zr)N diagram (Fig. 3l), the chemical temporal change of the syn-Sea of Japan opening rhyolites from the collision to subduction fields could reflect the transition from a crustal (collision type) source to a mantle (subduction type) as Thiéblemont (1999) discussed. Therefore, it can be concluded that the chemical compositions of syn-Sea of Japan opening rhyolites indicate a back-arc spreading environment. These results demonstrated that the Y versus Nb and Y + Nb versus Rb diagrams can be applied to rhyolites from back-arc basins, reflecting the tectonic evolution of back-arc spreading.
This paper originated from my M.Sc. and Ph.D. theses. I thank Associate Professor Toshiro Takahashi and members of the petrology group at Niigata University for their critical and constructive comments. The original manuscript was greatly improved by constructive comments from Dr. Denis Thiéblemont and an anonymous reviewer and handling by Dr. Yoshimitsu Suda. This study was funded by the Ministry of Economy, Trade and Industry, Japan as part of its R&D support program ‘Establishment of Technology for Comprehensive Evaluation of the Long-term Geosphere Stability on Geological Disposal of Radioactive Waste’ (JPJ007597; Fiscal Years 2024).
Supplementary Document is available online from https://doi.org/10.2465/jmps.241128.