Notes and Correspondence: Special Edition on Research on Extreme Weather Events that Occurred around East Asia in 2017-2021
気象庁降水短時間予報を用いた線状降水帯に伴う3時間積算雨量の予測精度検証

2022 年 100 巻 6 号 p. 995-1005

詳細
2022 年 100 巻 6 号 p. 995-1005
In recent years, “senjo-kousuitai”, characterized as a band-shaped area of heavy rainfall, has frequently caused river floods and landslides in Japan. Preventing and mitigating such disasters requires skillful forecasts of accumulated rainfall for several hours with an adequate lead time. The immediate very-short-range forecast of precipitation (VSRF) provided by the Japan Meteorological Agency is well suited to this purpose, representing a blended forecast of hourly accumulated precipitation for up to 6 h ahead based on extrapolation and numerical weather prediction. This study examined the predictability of the VSRF for 3-h accumulated precipitation associated with 21 senjo-kousuitai events that occurred in Kyushu in 2019 and 2020. Predictability was evaluated based on forecast accuracy at each forecast time (FT; 1–6 h) using categorical and neighborhood verification techniques. Overall, the VSRF product was useful for heavy rainfall areas of ≥ 80 mm (3h)−1 up to an FT of 2 h at the original grid spacing of 1 km, but with large uncertainty in the accuracy of the forecasts. After that FT, it was not possible to obtain a useful precipitation forecast for the threshold of ≥ 80 mm (3h)−1, even if displacement errors at municipal or larger scale (15–31 km) were tolerated. Further analysis showed that the VSRF is less skillful in the stage of senjo-kousuitai formation at shorter FTs (1–2 h) owing to limitations of the extrapolation forecasts. The poor skill during this period affects the timing of both issuance of warnings and decision-making regarding evacuation, representing major challenges for future development of forecasting methods and systems for senjo-kousuitai.
In recent years, the occurrence of severe disasters in Japan caused by localized and persistent heavy rainfall has increased (Danjo et al. 2018; Tsuguti et al. 2019; Tsuji et al. 2020). For example, in the latter stage of the Baiu season in both 2017 and 2020, Kyushu experienced torrential rainfall of > 200 mm (3h)−1 [Japan Meteorological Agency (JMA) 2017, 2020]. Both events caused multiple landslides and river floods that resulted in the loss of many lives. Such events are mainly triggered by band-shaped precipitation systems that broadly stagnate over the same location for a period of a few hours (Kato 2006; Takemi 2018; Min et al. 2021). Recently, band-shaped areas of heavy rainfall caused by such quasi-stationary precipitation systems were named “senjo-kousuitai” in Japanese (Kato 2020). To understand the statistical characteristics of areas of heavy rainfall in Japan, including senjo-kousuitai, Hirockawa et al. (2020a) objectively identified and classified areas of heavy rainfall into four types (i.e., linear-stationary, linear, stationary, and others) on the basis of the spatiotemporal continuity of the 3-h accumulated precipitation. They demonstrated that most areas of linear-stationary type were produced by typical elongated and stagnated precipitation systems that represent senjo-kousuitai. They also showed that linear-stationary areas of precipitation occurred mostly over the western side of Kyushu Island and in association with stationary fronts. Using long-term dense observational data from Japan, Hatsuzuka et al. (2021) showed that extreme precipitation under the synoptic pattern characterized by stationary fronts could intensify under warmer conditions, as well as short-duration local thunderstorms, which implies likely increases in both the frequency and the intensity of senjo-kousuitai in the future. Therefore, it is urgent that reliable methods and systems be developed for forecasting senjo-kousuitai.
Because of the characteristic of persistent heavy rainfall of senjo-kousuitai, skillful forecasts of accumulated rainfall for several hours are required for preventing and mitigating disasters related to such events. A very-short-range forecast of precipitation (VSRF; Nagata 2011), operated by the JMA, provides hourly precipitation forecasts for up to 6 h ahead by blending radar-based extrapolation with output from numerical weather prediction (NWP) models. In March 2018, the JMA launched a new VSRF product with more frequent (from 30-min to 10-min intervals) and more rapid (from within 18 to 8 min after observation time) updates, together with some other technical improvements (Japan Meteorological Agency 2019). The JMA (Japan Meteorological Agency 2019) reported that in one heavy rainfall case, the immediate VSRF was able to provide heavy rainfall information to the public approximately 20 min earlier for a 1-h forecast because of the frequent and rapid updates of the forecasts. Therefore, the new VSRF could be a product already in current operation that is suitable for predicting heavy rainfall associated with senjo-kousuitai. Furthermore, this product has been used as input for calculating the Soil Water Index that represents conceptual water stored in the soil (Japan Meteorological Agency 2019). In fact, considering this index, the JMA and the affected prefecture collaboratively issue landslide alert information with a 2-h lead time to allow sufficient time for evacuation. It indicates that the skill of VSRF could substantially affect the timing of both issuance of warnings and decision-making regarding evacuation for sediment disasters associated with senjo-kousuitai.
Given this background, the objective of this study was to quantitatively evaluate the predictability of the VSRF for the 3-h accumulated precipitation (P3h) associated with senjo-kousuitai. The statistical analysis considered 21 senjo-kousuitai events that occurred in Kyushu during the warm seasons of 2019 and 2020. In the present study, predictability was evaluated on the basis of the forecast accuracy at each forecast time (FT; i.e., 1–6 h) using not only grid-to-grid categorical verification statistics but also neighborhood verification with the Fractions Skill Score (FSS; Roberts and Lean 2008) that can consider the displacement errors of heavy rainfall areas at various spatial scales. Based on these verifications, we also examined the uncertainty of the forecasts and the potential impact regarding prevention against senjo-kousuitai disasters.
As forecast data, we used the immediate VSRF (hereafter, referred to simply as VSRF) launched by the JMA in March 2018. This product provides hourly accumulated precipitation for FTs of 1–6 h with spatial resolution of 1 km (0.0125° × 0.00833°). The forecast is issued at 10-min intervals, which is higher frequency in comparison with the conventional version (30-min update intervals). The VSRF employs a blending technique that merges radar-based extrapolation with output from the JMA's operational NWP models at an appropriate ratio. Generally, the extrapolation forecasts are more skillful than the NWP forecasts up to FTs of 1–2 h. However, their skill decreases rapidly with increasing FT because the initiation, growth, and dissipation of precipitation systems are not considered. In contrast, the skill of NWP forecasts decreases gradually with increasing FT, which can exceed that of extrapolation forecasts for longer FTs (Golding 1998; Sun et al. 2014; Japan Meteorological Agency 2019). To take advantage of the strengths of these forecasting methods, higher weights are assigned to the extrapolation forecasts for the first few hours in the blending process, and then the weighting is reversed for longer FTs (i.e., higher weights for the NWP forecasts). In the JMA VSRF, the blending weights are set to nearly zero for NWP forecasts for the first hour, meaning that the VSRF product is approximately the same as the extrapolation forecast (Japan Meteorological Agency 2019). Subsequently, the weighting assigned to the NWP forecasts increases as the FT increases, but the actual weightings are determined on a case-by-case basis through comparison of the skills of the extrapolation and NWP forecasts. For example, when the skills between these two methods of forecasting are comparable, the weight for the extrapolation forecast is approximately 0.75 (0.5) at the 2-h (3-h) FT. A detailed description of the VSRF, including the technical improvements from the previous version, can be found in JMA (Japan Meteorological Agency 2019).
The radar/rain gauge-analyzed (R/A) precipitation (Nagata 2011) from the JMA was used to validate the forecast accuracy of the VSRF. Similar to the VSRF, the R/A product provides hourly accumulated precipitation with 1-km spatial resolution based on radar observations calibrated by rain gauge measurements. The product is provided with a 30-min update interval.
2.2 Selection of senjo-kousuitai eventsIn the current study, 21 senjo-kousuitai events that occurred in Kyushu during the warm seasons of 2019 and 2020 (Fig. 1) were selected using the methods of Hirockawa et al. (2020a, b). Their methods are based on the distributions of 3-h accumulated precipitation produced at hourly intervals from regridded 5-km mesh R/A data. Hirockawa et al. (2020a) identified heavy rainfall areas as an aggregation of spatiotemporally continuous areas of P3h ≥ 80 mm. The identified heavy rainfall areas were further classified into four types (i.e., linear-stationary, linear, stationary, and others) by defining criteria such as aspect ratio and persistence period. Hirockawa et al. (2020b) also included some modifications from the procedure of Hirockawa et al. (2020a), such as the criterion of the overlap ratio for aggregation, for better extraction of the heavy rainfall areas. Details of the procedure and criteria (e.g., the overlap ratio and aspect ratio) are described in Hirockawa et al. (2020a, b). In the present study, the linear-stationary type of areas of heavy precipitation, identified by the procedure of Hirockawa et al. (2020b), was considered representative of senjo-kousuitai events. Following consideration of surface weather maps, we also subjectively excluded senjo-kousuitai events associated with tropical cyclones to minimize the effect of differences in synoptic background conditions. Consequently, the selected 21 events mostly occurred around stationary (Baiu) fronts.
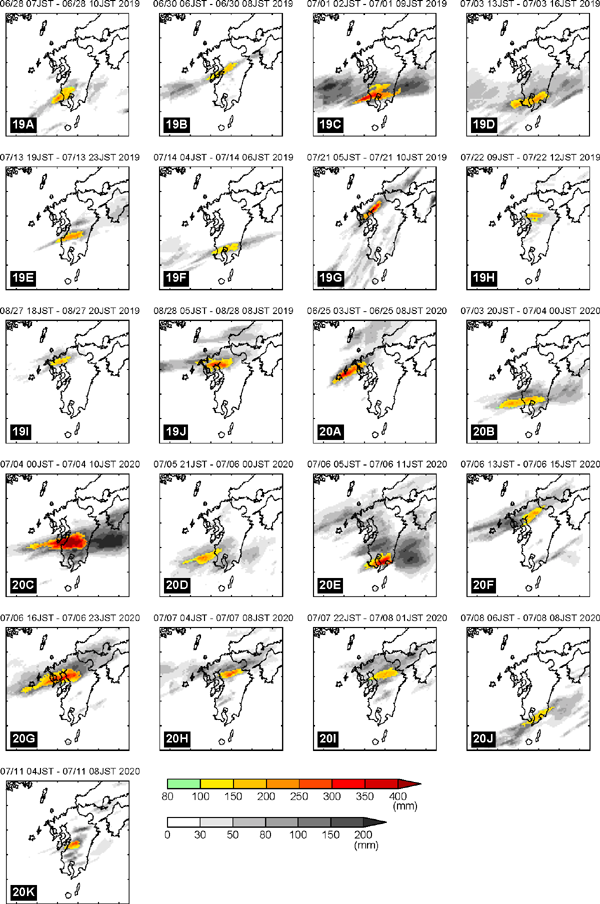
Distributions of total rainfall amount for the 21 selected senjo-kousuitai events calculated from 5-km-mesh analyzed rainfall (R/A). Other precipitation areas outside the senjo-kousuitai are displayed in monochrome for clarity. The event ID and the duration are indicated in each panel. The domain in each panel denotes the target area for verification.
As heavy rainfall areas, including senjo-kousuitai, were identified based on the distributions of 3-h accumulated rainfall (Hirockawa et al. 2020a, b), this study also verified the forecast accuracy of the VSRF for 3-h accumulated precipitation associated with senjo-kousuitai events at each FT. Here, we explain the verification methods adopted using a single senjokousuitai event (event 19C, Fig. 1) as an example, as shown in Fig. 2. Verification was performed every 30 min (at 00 and 30 min past the hour) during the event in accordance with the update times of the R/A observations (Fig. 2a). In total, 189 verification times were considered for each FT. The schematic illustration in Fig. 2b shows how the 3-h accumulated precipitation was derived for each FT, as verified at 02:00 JST on June 30, 2019. Although our method inevitably included observed R/A precipitation in calculating the 3-h precipitation for the FTs of 1–2 h (i.e., the first 2 h for FT = 1 h and the first 1 h for FT = 2 h; Fig. 2b), which may allow high scores in the verification at these FTs, the main purpose of this study is to assess the usefulness of the VSRF products with respect to prevention of senjo-kousuitai disasters, and thus the accumulative rainfall is validated in this manner. On and after FT = 3 h, the 3-h accumulated precipitation consisted of only forecasts with those different initial times (Fig. 2b). In this example, the forecasts substantially underestimated the heavy rainfall areas such as P3h ≥ 80 mm for longer FTs, that is, 4–6 h (Fig. 2c).

(a) Time series of rainfall areas for P3h ≥ 80 mm at 30-min intervals calculated from 1-km-mesh R/A. The vector indicates the duration of the senjo-kousuitai event for ID = 19C based on the method of Hirockawa et al. (2020a, b). Red values indicate the elapsed time Δt (h) since the first detection of heavy rainfall area of P3h ≥ 80 mm for the event. (b) Schematic illustration explaining the calculation of 3-h accumulated precipitation for each FT at the verification time of 02:00 JST June 30, with the observations, and (c) the corresponding distributions of 3-h accumulated precipitation. Green circles in (b) indicate the initiation time of the forecast.
Categorical verification statistics (Wilks 2011) of the bias score (BI), probability of detection (POD), false alarm ratio (FAR), and equitable threat score (ETS) were used to evaluate the predictability of 3-h accumulated precipitation for the 21 senjo-kousuitai events. BI is the ratio of the total number of grid cells with forecasted values above a given threshold to the total number of grid cells observed above that threshold. POD and FAR are the fractions of occurrences that were correctly forecasted and that were forecasted but did not occur, respectively. For a perfect forecast, BI = 1, POD = 1, and FAR = 0. ETS is the fraction of observed and/or forecasted grid cells that were correctly forecasted, adjusted for the frequency of hits expected by random chance. ETS can range from −0.33 to 1.0, with higher scores indicating more skillful forecasts. This score is sensitive to both false alarms and misses, resulting in a more balanced measurement than either POD or FAR. In the present study, ETS ≥ 0.3 was considered indicative of a useful forecast, as adopted in previous studies (Germann and Zawadzki 2002; Ruzanski and Chandrasekar 2012a, b). The ETS value of 0.3 corresponds approximately to both POD and FAR values being equal to 0.5. Several threshold values of P3h (i.e., TH = 10, 20, 50, 80, and 100 mm) were used in calculating the categorical verification statistics. Specifically, this study focused on the forecast accuracy for TH = 80 mm (3h)−1 because a senjo-kousuitai event was defined as a temporal aggregation of heavy rainfall areas of P3h ≥ 80 mm (Hirockawa et al. 2020a, b). All these scores were calculated over a large domain covering the Kyushu region [30.0–35.0°N, 127.5–133.5°E; Fig. 1] at the original 1-km grid spacing.
When categorical verification statistics based on grid-to-grid comparisons are applied to verification of high-resolution precipitation data, small displacement errors are more likely to produce poor results, even though the forecast might be valuable. It also means that the usefulness of forecasts will be increased if some displacement errors are considered acceptable. Here, we employed FSS, which is a neighborhood verification method developed by Roberts and Lean (2008), to evaluate the spatial skill of precipitation forecast at different scales. The FSS is an approach used to assess the level of agreement between observed and forecasted fractional coverage of precipitation exceeding a given threshold within the neighborhood square. The FSS values can be in the range of 0–1, with higher scores indicating more skillful forecasts. In the current study, a threshold for 80 mm (3h)−1 was used in calculating the FSS values. To show how skill varies with spatial scale L (km), that is, a neighborhood square of L × L (km), the FSS was also evaluated for L = 1, 5, 15, and 31 km. In Roberts and Lean (2008), the useful skill was given by an FSS value of 0.5 + f0/2, where f0 is the fraction of observed grid points in the domain exceeding the threshold. Larger thresholds of precipitation generally have small fractional coverage in the verification domain (i.e., small f0); thus, FSS ≥ 0.5 was considered indicative of a useful forecast in this study.
Figure 3 shows the grid-to-grid verification statistics of BI, POD, FAR, and ETS with various thresholds of 3-h accumulated precipitation as a function of FT. The statistics for each FT were produced by averaging scores at all verification times (i.e., 30-min intervals) for the 21 senjo-kousuitai events. Overall, forecast accuracy decreases as the FT becomes longer and the precipitation threshold becomes larger, except for the BI score for lower thresholds such as TH = 10 mm (3h)−1 and 20 mm (3h)−1 that remain almost constant irrespective of FT. For all thresholds, the forecast accuracy is reasonably high at FT = 1 h, but it tends to decrease rapidly within a few hours, especially for heavier precipitation (i.e., larger TH). Hereafter, we focus on the forecast accuracy for TH = 80 mm (3h)−1 (filled squares, Fig. 3), which was used as the criterion for extraction of senjo-kousuitai events (Hirockawa et al. 2020a, b). BI is typically negative over the FT (Fig. 3a), indicating that forecasts underestimate the 3-h precipitation associated with senjo-kousuitai. The negative BI becomes more apparent (< 0.5) for longer FTs, consistent with the example shown in Fig. 2c. The POD and FAR scores (Figs. 3b, c) indicate reasonable accuracy (POD > 0.5 and FAR < 0.5) up to FT = 2 h. However, at FT = 3 h, the POD value decreases to 0.21, whereas the FAR remains at approximately 0.5. The lower values of POD from FT = 3–6 h are probably due to significant underestimation of the 3-h precipitation in the forecast. Similar to the result of POD, ETS retains relatively high skill (∼ 0.4) up to FT = 2 h, but it subsequently drops to below 0.2 (Fig. 3d). As explained in Section 2.3, forecasts are considered useful when ETS ≥ 0.3; thus, this result indicates that the VSRF can usefully predict heavy precipitation areas of P3h ≥ 80 mm associated with senjo-kousuitai up to 2 h ahead. It should be also noted that the forecast accuracy of heavy rainfall areas varies widely at individual verification times (blue shading, Fig. 3). These uncertainties of forecasts are investigated further in Section 3.2. To evaluate forecast skill when the displacement errors of heavy rainfall areas are considered, a neighborhood verification score of FSS is examined for TH = 80 mm (3h)−1 with various tolerance scales of displacement error (L = 1, 5, 15, and 31 km). Figure 4 shows the FSS averaged for all verification times as a function of FT. Similar to the results for POD and ETS from the grid-to-grid verification (Figs. 3b, d), the FSS for all spatial scales decreases rapidly with increasing FT, especially by FT = 3 h. It is also found that the FSS clearly increases with increasing spatial scale at shorter FTs, that is, 1–3 h. At FT = 2 h, the FSS satisfies the criterion for a useful forecast (defined as FSS ≥ 0.5), even at the grid scale (L = 1 km), and it can increase to ∼ 0.7 by tolerating displacement error of L = 15 km, that is, a scale comparable with that of a municipality. In contrast, the FSS values are < 0.4 at FT = 3 h for all spatial scales, indicating that a useful forecast cannot be obtained, even if displacement errors at municipal or larger scale (15–31 km) are tolerated for the heavy rainfall area. On and after FT = 4 h, the forecast accuracy is low (FSS < 0.2) and less sensitive to the tolerance scale of the displacement errors, probably owing to significant underestimation of the heavy precipitation area (Fig. 3a).
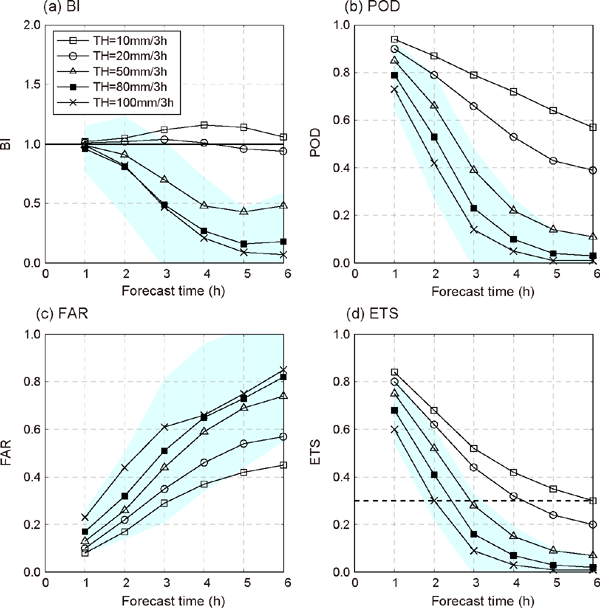
Scores as a function of FT for all verification times. (a) BI, (b) POD, (c) FAR, and (d) ETS. Different symbols indicate the thresholds of 3-h accumulated precipitation [TH = 10, 20, 50, 80, and 100 mm (3h)−1]. Blue shading denotes ±1.0 standard deviation from the average for each FT. Horizontal dashed line in (d) denotes the criterion for a useful forecast described in the text.

FSS values averaged for all verification times as a function of FT using a threshold for 80 mm (3h)−1. Different symbols indicate the neighborhood lengths (L = 1, 5, 15, and 31 km). Horizontal dashed line represents the criterion for a useful forecast described in the text.
The VSRF can be useful for heavy rainfall areas of P3h ≥ 80 mm associated with senjo-kousuitai up to the FT of 2 h. However, large variability in forecast accuracy was noted among the verification times. We attempt to explore the possible factors responsible for the forecast uncertainty, focusing on the stage of senjo-kousuitai evolution (e.g., the formation stage and maintenance stage). Here, the elapsed time Δt is defined as the time following the first detection of a heavy rainfall area of P3h ≥ 80 mm for an individual senjo-kousuitai event based on the method of Hirockawa et al. (2020b). For each event, the elapsed time is set to 30-min intervals according to the verification times (Fig. 2a). In the present study, Δt = 0–0.5 h, broadly corresponding to the formation stage of senjokousuitai. Specifically, we focus on forecast accuracy during this period because it can substantially affect the timing of both issuance of warnings and decisionmaking regarding evacuation. Figure 5 shows the time series of the verification statistics (BI, ETS, and FSS) as a function of elapsed time for the FT of 2 h. The precipitation threshold used was 80 mm (3h)−1. The statistics for each elapsed time were calculated as averages for all available events depending on event duration. Note that the results, plotted between Δt = 0 h and 3 h, involve at least 16 senjo-kousuitai events. All verification statistics show clear dependence on elapsed time, which tends to increase as elapsed time increases (i.e., higher accuracy in the maintenance stage than in the formation stage of senjo-kousuitai). At Δt = 0 h, the ETS is < 0.3 with the largest negative bias of BI ≈ 0.4, indicating a less useful forecast owing to reduced detection of observed heavy rainfall (i.e., lower POD; not shown). In contrast, 1 h after the first detection (Δt = 1 h), the criteria for a useful forecast can be satisfied (defined as ETS ≥ 0.3), along with significant improvement in the BI score. The neighborhood verification using FSS also shows a similar tendency to that of the ETS for all spatial scales, that is, lower accuracy for shorter elapsed times. The FSS increases with increasing spatial scale, but with less sensitivity at the formation stage (Δt = 0 h), which is probably attributable to significant underestimation of the heavy precipitation area (Fig. 5a). Additionally, it is found that useful forecasts (defined as FSS ≥ 0.5) cannot be obtained at Δt = 0 h, even if the 31-km displacement error is tolerated; however, on and after Δt = 1 h, the criteria for a useful forecast are satisfied even at the grid scale (L = 1 km). These results indicate that the uncertainty of forecast accuracy is partly attributable to the evolution stage of senjo-kousuitai. Specifically, we note that the lower accuracy during the formation stage of senjo-kousuitai could result in significant uncertainty with respect to disaster prevention, such as decision-making regarding evacuation in sediment disasters.
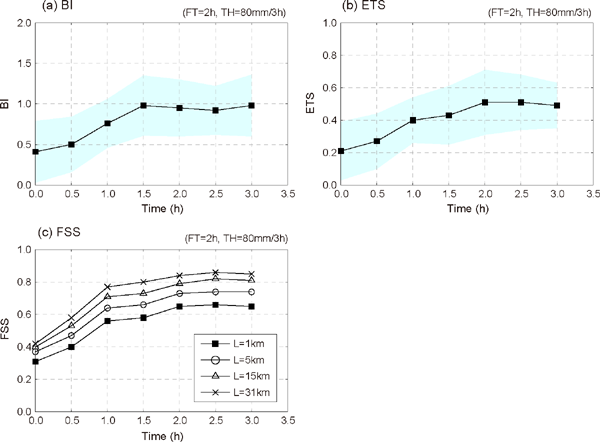
Scores as a function of elapsed time Δt for the FT of 2 h using a threshold for 80 mm (3h)−1: (a) BI, (b) ETS, and (c) FSS. (a) and (b) Blue shading represents ±1.0 standard deviation from the average for each elapsed time. (c) Different symbols indicate the neighborhood lengths (L = 1, 5, 15, and 31 km).
We further discuss the details of lower accuracy at the formation stage of senjo-kousuitai for the FT of 2 h. One possible reason is the lower accuracy of the extrapolation forecast during this period. As explained in Section 2.1, the VSRF is derived from a combination of NWP model- and extrapolation-based forecasts determined by assigning appropriate weighting factors. For the first 1 h of the forecast, nearly the full weight is assigned to the extrapolation forecast. The extrapolation forecast still has a weight of approximately 0.75 at 2 h ahead, when the skills of the extrapolation and NWP forecasts are comparable (Japan Meteorological Agency 2019). It means that the extrapolation forecast contributes substantially to the forecast of 3-h precipitation at FT = 2 h. Because the extrapolation approach assumes a steady state of existing precipitation systems, the accuracy might be not high during the formation stage of senjo-kousuitai when cumulonimbus cloud clusters might not be sufficiently well organized to be stagnant. This is consistent with the results of Kato et al. (2017), derived using extrapolation-based nowcasts, who demonstrated that useful forecasts are limited to approximately 10 min for meso-γ-scale localized heavy rainfall associated with unorganized cumulonimbus clouds. A feature similar to that at FT = 2 h is also found at FT = 1 h (Figs. S1a, b), where almost no NWP output is used for the forecast of 3-h precipitation, indicating that forecast accuracy can be lower in the formation stage than in the maintenance stage, even without NWP forecasts. Another possible reason for the lower accuracy in the formation stage might be the lesser contribution of observations to the 3-h precipitation forecasts for this period. Although observations are used for the first 1 h in calculating the 3-h precipitation at FT = 2 h (Fig. 2b), less precipitation might be observed at the formation stage because it will correspond to the initiation of cumulonimbus development. In contrast, the observations are expected to make a larger contribution after formation (e.g., on and after Δt = 1 h), which might lead to higher accuracy of the 3-h precipitation forecasts in comparison with the formation stage. To exclude the effect of the observations, we also conducted the same analysis as FT = 2 h for FT = 3 h (Figs. S1c, d), which consisted only of forecast data (Fig. 2b). The result showed lower forecast accuracy at the formation stage, as found at FT = 2 h. It is expected that the extrapolation forecast still makes substantial contribution to the blending forecast even at 3 h ahead (Japan Meteorological Agency 2019). Thus, we can conclude that the skill of the extrapolation forecast is one of the major factors affecting the lower accuracy during the formation stage of senjo-kousuitai. To overcome this limitation, consideration of NWP forecasts produced using a high-resolution model that can predict convection initiation and growth (typically ≤ 1 km) might be a useful approach (Kato et al. 2018; Takemi 2018; Oizumi et al. 2018). Furthermore, use of initial conditions that are more realistic through assimilation of observations that are fundamental to the prediction of senjo-kousuitai might reduce the model spin-up period (Yoshida et al. 2020), which is often associated with the low skill of NWP forecasts during the first few hours. Further development of the VSRF system is needed to optimize the timing of issuance of warnings, evaluation of decision-making procedures, and reduction of the risk of natural disasters associated with senjo-kousuitai.
The increasing number of disasters caused by senjo-kousuitai in Japan in recent years highlights the pressing need for development of reliable forecasts/ systems for the heavy rainfall associated with senjokousuitai. The immediate VSRF product launched by the JMA in March 2018 is expected to provide useful information for such disasters because of its frequent updates and adequate FTs. This study undertook comprehensive verification for 21 selected senjo-kousuitai events. Analysis using categorical and neighborhood verification techniques showed that the VSRF can provide a useful forecast for heavy rainfall areas of ≥ 80 mm (3h)−1 associated with senjo-kousuitai for up to 2 h ahead, even at the grid scale (1 km). In contrast, after that time, a useful forecast cannot be obtained, even if displacement errors at municipal or larger scale (15–31 km) are tolerated, which is probably attributable to underestimation of the heavy rainfall area in the VSRF. The statistical accuracy of the VSRF presented here will serve as the basis for verification of operational forecast systems for senjo-kousuitai. In the current study, we investigated the forecast accuracy only during the senjo-kousuitai events, but the VSRF will also include some false alarms of events outside the analysis period (forecasted as a senjo-kousuitai event, but it did not occur). To consider the use of predicted rainfall as disaster prevention information, such false alarm must be evaluated in the future.
With respect to disaster prevention, this study considered the essential challenge of how to improve forecast accuracy during the formation stage of senjokousuitai, because it can substantially affect the timing of issuance of warnings and decision-making regarding evacuation. At shorter FTs, the lower accuracy and underestimation during the formation stage are mainly due to poor performance of the extrapolation forecast. Moreover, these results are not sensitive to the tolerance scale of displacement errors, suggesting a limitation in applying extrapolation forecasts for a few hours ahead. However, NWP forecasts also generally have notable limitation during the first few hours attributable to the model spin-up period. It is worth noting that the use of a cloud-resolving NWP model (1-km grid spacing) with corrected storm locations could produce a better forecast than the VSRF for the FT of 2 h, especially in the stage of senjo-kousuitai formation (Shimizu et al. 2022). The results were based on a single typical senjo-kousuitai event, and more representative results might be derived from a larger sample in the future.
The datasets generated and/or analyzed in this study are available from the corresponding author on reasonable request.
Figure S1: As in Figs. 5a, b, but for the FT of (a) and (b) 1 h and (c) and (d) 3 h.
We would like to thank two anonymous reviewers and Dr. Naoko Seino for helpful suggestions to improve the manuscript. This study was supported by the Council for Science, Technology, and Innovation (CSTI), Cross-ministerial Strategic Innovation Promotion Program (SIP) Second Phase, Enhancement of Societal Resilience against Natural Disasters. We would also like to thank Dr. Yasutaka Hirockawa of the Meteorological Research Institute for providing the data of heavy rainfall areas used in Hirockawa et al. (2020a, b). The very-short-range forecast of precipitation was provided by Dr. Aritoshi Masuda of the Japan Weather Association. We are grateful to James Buxton, MSc, from Edanz (https://jp.edanz.com/ac) for editing a draft of this manuscript.