Abstract
In July and August (JA) 2018, the monsoon trough in the western North Pacific (WNP) was unusually strong, the anticyclonic ridge was anomalously northward-shifted, and enhanced and northward-shifted tropical cyclone activity was observed. Studies have examined the effects of sea surface temperature (SST) anomalies on the North Atlantic (NA), the Indian Ocean (IO), and the tropical North Pacific. However, a synthetic view of SST forcings has yet to be identified. Based on a series of numerical experiments, this study demonstrated that the SST anomaly in the tropical WNP was the key forcing that formed the structure of the observed anomalous phenomena in the monsoon trough. Moreover, the combined effect of the SST anomaly in both the tropical and extratropical WNP resulted in enhanced circulation anomalies in the WNP. The NA SST anomaly also enhanced the monsoon trough in the presence of WNP SST anomaly. By contrast, the individual SST anomaly in the NA, IO, the extratropical WNP, and the subtropical eastern North Pacific could not force the enhanced monsoon trough. We proposed that the local effect of both the tropical and extratropical WNP SST anomaly as the major driver and the remote effect of NA SST anomaly as a minor contributor jointly induced the anomalous circulation and climate extremes in the WNP during JA 2018.
1. Introduction
The tropical western North Pacific (WNP) was characterized by active tropical cyclone (TC) activity in July and August (JA) 2018. With 14 TCs, WNP TC activity in JA 2018 was only exceeded by the 16 TCs each in 1967 and 1994 (Japan Meteorological Agency; JMA, https://www.data.jma.go.jp/fcd/yoho/typhoon/index.html) compared with the long-term average of 9.5. The overall TC tracks in JA 2018 shifted north of long-term averaged tracks (Fig. 1a), whereas the mean genesis locations mainly shifted eastward (Fig. 1b) along with the eastward-extended monsoon trough (Fig. 1a). Japan had three TC landfalls, an anomalous number compared with the long-term average of 1.4. Eleven TCs approached Japan (i.e., reached within 300 km of Japanese weather stations, including those on Hokkaido, Honshu, Shikoku, and Kyushu; JMA, http://www.data.jma.go.jp/fcd/yoho/typhoon/statistics/landing/landing.html) in JA 2018, a record-high number since 1981. The ratio of TCs (11) affecting Japan to the total WNP TCs (14) was unusually high (79 %, 11/14). Northward-shifted TC tracks were linked to unusually high TC activity in the subtropical WNP. As shown in Fig. 2a, the number of TC days north of 30°N in the WNP in JA 2018 was the highest since 1981. The northward-expanded monsoon trough in JA 2018 provided a favorable background for the excess stormy conditions and severe rainfall events in Japan (e.g., the strong southwesterly and extremely heavy rainfall caused devastating landslides, flooding, and more than 200 deaths in west Japan after Typhoon Prapiroon in early July 2018 and Typhoon Jebi in early September, which was the strongest typhoon in 25 years and severely affected Japan's mainland in late August and early September) (Tokyo Climate Center 2018a; Moteki 2019; Sekizawa et al. 2019; Shimpo et al. 2019; Sueki and Kajikawa 2019; Takemi and Unuma 2019; Takemura et al. 2019; Yokoyama et al. 2020).
Notably, when the TCs shifted northward in JA 2018, Northeast Asia experienced severe heat wave events (Tokyo Climate Center 2018a; Qian et al. 2019; Shimpo et al. 2019; Takaya 2019). Recent studies have associated these abnormal phenomena with anomalous large-scale circulation. A strong northern circumpolar perturbation, characterized by zonally distributed positive 500-hPa geopotential height (GHT) anomalies between 30°N and 60°N circumglobally in the upper troposphere, was observed and associated with the widespread heat wave events in the northern extratropics, including Northeast Asia, North America, northern Europe, and the Arctic, from May to August 2018 (Chen, L. et al. 2019; Kobayashi and Ishikawa 2019; Liu et al. 2019; Vogel et al. 2019; Ha et al. 2020). These anomalous events in the WNP were accompanied by an unusually northward shift in the subtropical high and an enhanced monsoon trough (Wang et al. 2019). The anomalous circulation pattern exhibited characteristics of the positive phase of the Pacific–Japan (PJ) pattern, which was the strongest since 1981 (Fig. 2b). The PJ pattern, characterized by a tripolar structure of circulation and rainfall, is recognized as a major mode that affects summertime climate variability in East Asia and the WNP (Nitta 1987; Kosaka and Nakamura 2006; Hsu and Lin 2007). Consistent with the record-breaking positive PJ index, the WNP summer monsoon was the most active since 1981 in terms of the WNP monsoon index and the Asia summer monsoon outgoing long-wave radiation (OLR) index (SAMOI, average OLR over 10–20°N, 115–140°E), as shown in Fig. 2b (Wang et al. 2001; Tokyo Climate Center, Japan Meteorological Agency 2018b). Notably, correlations between any two of the three indices ranged from 0.4 to 0.59 (WNP–PJ 0.4, SAMOI–PJ 0.49, and WNP–SAMOI 0.59).
The main causes of these abnormal phenomena remain unclear. First, the North Atlantic (NA) sea surface temperature (SST) tripole that triggered a barotropic Rossby wave pattern in the northern extra-tropics was suggested to be a factor that caused the northward shift of the WNP subtropical high (Chen, L. et al. 2019; Deng et al. 2019; Liu et al. 2019). Second, Chen, L. et al. (2019) suggested that the observed reduction in snow cover over the Tibetan Plateau in winter 2017–2018 led to a stronger thermal effect of the Tibetan Plateau in the following early summer, indirectly contributing to the enhancement of the monsoon trough over the Philippine Sea and leading to a strong East Asian summer monsoon. These findings are consistent with those of Hsu and Liu (2003), who concluded that diabatic heating over the Tibetan Plateau triggered a wave-like circulation pattern that affected East Asian summer rainfall. In addition, Kobayashi and Ishikawa (2019) suggested the importance of SST anomalies in the tropical Pacific in predicting northern-mid-latitude tropospheric warming. Furthermore, the summer of 2018 followed a La Niña, which created favorable conditions for a cyclonic circulation anomaly over the Philippine Sea and strengthened the East Asian summer monsoon (Chen, L. et al. 2019). Cooling in the southeastern tropical Indian Ocean (IO) was also suggested (Tao et al. 2012; Gao et al. 2018; Chen, R. et al. 2019) to be the main reason for a low-level southwesterly anomaly and an anomalous cyclonic circulation over the WNP. Finally, studies have also suggested that the Pacific Meridional Mode (PMM)-like SST anomalies in the eastern North Pacific played a crucial role in establishing a favorable background flow for active TC conditions and eastward-shifted genesis locations in the WNP (Hong et al. 2018; Stuecker 2018; Qian et al. 2019; Takaya 2019). By contrast, Imada et al. (2019) suggested the effect of human-induced global warming on the July 2018 high-temperature event in Japan.
The studies mentioned above have focused either on the anomalous warmth in Northeast Asia and the northward-shifted subtropical high or on the enhanced monsoon trough. The various described mechanisms indicate that the anomalous behavior of the subtropical high and monsoon trough could be viewed as a synthetic response to various forcings, the aggregated impact of which is described as a compound effect in this study. Because an SST anomaly is often the major forcing that causes anomalous large-scale circulation, the relative role of observed SST anomalies in different basins during JA 2018 should be explored. For example, the possibility that extremely high SSTs in the WNP as a key forcing of anomalous circulations has not been explored. The impact of other SST anomalies compared with the effect of the WNP SST anomaly also warrants exploration. This study used an atmospheric general circulation model (AGCM) to evaluate the relative effects of SST anomalies in the Pacific, NA, and IO on inducing the northward shift in the subtropical high and the enhanced monsoon trough in the WNP during JA 2018. The data and model are described in Section 2. Section 3 presents the results, and Section 4 presents the discussion.
2. Data and model
The observational data used in this study were the monthly atmospheric fields retrieved from the NCEP/NCAR Reanalysis I (Kalnay et al. 1996), and SSTs were retrieved from the NOAA_ERSST_V4 data (provided by the NOAA/OAR/ESRL Physical Sciences Laboratory, Boulder, Colorado, USA, https://www.esrl.noaa.gov/psd/) (Huang et al. 2015). Precipitation data were obtained from NOAA's PRECipitation REConstruction Dataset (PREC; Chen et al. 2002). OLR data (Liebmann and Smith 1996) were retrieved from NOAA/ESRL (ftp://ftp.cdc.noaa.gov). The anomalies in Figs. 3 and 4 are presented in as percentiles, which are statistical measures indicating the value below which a given percentage of observations in a group of observations falls, to demonstrate the extremity. Here, SST and NCEP atmospheric variables for 1948–2018 and PREC precipitation data for 1951–2018 were ranked from smallest to largest. The 95th and 5th percentiles indicate that an observation was in the highest and lowest 5 % of observed values, respectively. The atmospheric component of the NCAR Community Earth System Model (Neale et al. 2012) CAM5 with a resolution of 1.9° latitude and 2.5° longitude and 30 vertical levels was used in the numerical experiments to determine the relative effects of the SST anomalies in various regions on the anomalous circulations in the WNP. The target period was JA 2018. The detailed settings of the experiments are described in Subsection 3.2.
3. Results
3.1 General circulation characteristics in JA 2018
This section presents the characteristics of circulation in JA 2018. Rainfall exceeded the 90th percentile over the South China Sea and the Philippine Sea, whereas it was lower than the 30th percentile in the south over the Maritime Continent and in the north over Japan and Korea (Fig. 3a). This dry–wet–dry precipitation pattern exhibited characteristics of the PJ pattern in the positive phase (Nitta 1987; Kosaka and Nakamura 2006) or the tripolar rainfall pattern in the negative phase (Hsu and Liu 2003; Hsu and Lin 2007). Figure 3b presents the moisture flux and convergence anomalies at 925 hPa. The enhanced moisture flux and convergence confirmed the substantially strengthened monsoon trough over the Philippine Sea. These observations corresponded to those of the positive phase of the WNP monsoon index and SAMOI as shown in Fig. 2b. The dry-wet-dry rainfall pattern coincided with the warm–cold–warm structure in the 2-m temperature (Fig. 3c). Notably, the heat wave events occurred in the extensive warm belt (exceeding the 95th percentile) over China, Korea, and Japan (Chen, R. et al. 2019; Kornhuber et al. 2019; Shimpo et al. 2019; Vogel et al. 2019; Wang et al. 2019; Ha et al. 2020). Likewise, the 500-hPa geopotential height (GHT500) exceeding the 95th percentile between 30°N and 40°N revealed a strong anticyclonic anomaly that manifested in the northward-shifted subtropical high in the WNP (Fig. 3d), whereas the region lower than the 30th percentile in the south reflected an enhanced monsoon trough. A comparison between the 1490-m contour of 850-hPa geopotential height (GHT850) in 2018 (red line) and the climatological mean (blue line) verified both the northward-shifted subtropical high and the enhanced monsoon trough.


As mentioned in the Introduction, TC tracks in JA 2018 tended to shift northward compared with the long-term average track distribution. This northward shift was consistent with the steering flow, which was located between the anticyclonic circulation in the north and the cyclonic circulation in the south (i.e., the region of tight gradients in the 1000–400-hPa mean steering flow shown in Fig. 1a). Most TC tracks in JA 2018 closely followed the western flank of the anticyclonic circulation and moved in a clockwise direction (Fig. 1a). The anomalous circulation in JA 2018 explained the record-breaking TC activity north of 30°N and why Japan was affected by more TCs in JA 2018 (Fig. 2a).
To further investigate the influence of the northward- shifted subtropical high and active WNP summer monsoon, we examined the large-scale circulation in a much larger domain (Fig. 4). In the upper troposphere (e.g., 200-hPa GHT anomalies; Fig. 4a), a circumpolar pattern consisting of predominantly positive GHT anomalies in the northern extratropics (30–60°N) was the dominant feature. By contrast, the negative anomaly in the Philippine Sea and the South China Sea that reflected the enhanced monsoon trough dominated in the lower troposphere (Fig. 4b). Although the circumpolar pattern was weaker, it was still evident in the lower troposphere in the northern extratropics, except over Northeast Asia, reflecting the equivalent barotropic nature of the pattern. By contrast, no notable perturbation in the upper troposphere was observed over the active monsoon trough region. In summary, the extratropical anomaly exhibited a top-heavy deep hemispheric structure, whereas the one in the lower latitudes was a shallow regional feature occurring mainly in the subtropical WNP.

To explore possible forcing from oceans, the percentiles of SSTs in JA 2018 were shown in Fig. 4c to demonstrate the occurrence of extreme SSTs in various basins. First, an SST tripole in the NA was evident. The feature has been suggested to force a barotropic Rossby wave pattern in the northern extratropics that contributed to the extreme heatwave events in 2018 (Chen, L. et al. 2019; Deng et al. 2019; Liu et al. 2019). The extreme positive and negative SST anomalies were above the 95th percentile and below the 5th percentile in JA 2018, respectively, reflecting the record-high amplitude of the NA SST tripole since 1981 (not shown). Second, the particularly warm SST anomalies exceeding the 95th percentile spread from the tropical western Pacific and tilted slightly northward to the subtropical eastern North Pacific (Fig. 4c; blue outlined region marked with 2). This positive SST anomaly belt was south of the negative 1000-hPa GHT anomalies in the western and central subtropical North Pacific. An examination of vertical structure indicated that the negative GHT anomaly in the western Pacific extended up to 500-hPa, whereas the counterpart in the eastern Pacific was shallow and appeared generally below 850-hPa (not shown). This phase relationship suggests that positive SST anomalies forced the anomalous cyclonic circulation in the lower troposphere in these regions. The contrast between negative GHT anomalies in the vertical extent appeared consistent with the contrasting atmospheric stability between the subtropical western and eastern North Pacific. The WNP is climatologically characterized by the monsoon trough with active convection and TC activity, whereas the eastern North Pacific is climatologically more stable and prevailed by the subtropical anticyclone and widespread stratocumulus clouds. Thus, a positive SST anomaly of similar strength would trigger deeper convections and larger negative GHT anomalies in the western Pacific than in the eastern Pacific.
The OLR and 200-hPa velocity potential anomalies shown in Fig. 4d indicate that strong negative OLR and velocity potential anomalies (implying anomalous upward motion) occurred over the North Pacific between the equator and 30°N, where the positive SST anomaly was observed. This active convection system was likely triggered by the anomalously warm SSTs nearby. In addition to the anomalously active convection in the North Pacific in JA 2018, convection was suppressed in the tropical South Pacific and IO, as indicated by the positive OLR and velocity potential anomalies. These results suggest that the anomalously warm SSTs in the tropical and subtropical North Pacific likely played a crucial role in driving anomalous atmospheric circulation in East Asia and the Pacific and IO region in JA 2018.
As reviewed in the Introduction, SST anomalies in various basins have been suggested to force the observed anomalous circulation in the WNP. Results from a series of numerical experiments forced by the observed SST anomalies in various basins are presented in the following section to evaluate the relative effects of various SST forcings on the observed anomalous phenomena in the WNP.
3.2 Numerical experiments
a. Design of experiments
Bearing in mind that AGCMs were more skilful in simulating monsoon circulation than rainfall in the WNP (Wang et al. 2004), we conducted AMIP-type experiments by forcing the CAM5 model with the observed SSTs in various basins from January to August 2018 to assess the effects of the local and remote SST anomalies on the anomalous circulations. By using this one-way AMIP-type approach, we could not understand the complete physical process that caused the extremity in the WNP during JA 2018 or quantify the exact contribution of SST anomalies, but the approach provided valuable information on the effects of the anomalous SSTs and the relative contributions from various ocean basins. Each experiment listed in Table 1 comprises 11 members with initial conditions in slightly different perturbations. The control experiment was forced with the observed climatological monthly mean SST and sea ice concentration (SIC) from 1982 to 2010. The global experiment (GL-exp) was forced with the global SST anomaly in 2018 to identify the ability of the model to reproduce the observed circulation characteristics. The sensitivity experiments were conducted by forcing the model with the observed monthly mean SST anomaly in January–August 2018. Eight sensitivity experiments were conducted with the observed SST anomalies in the following basins as lower-boundary forcing: the tropical WNP (TWP-exp), the whole WNP (WP-exp), the tropical WNP plus the NA (TWP+ATL-exp), the whole WNP plus the NA (WP+ATL-exp), the extratropical WNP to the east of Japan (EJP-exp), the NA (ATL-exp), the tropical eastern North Pacific (ENP-exp), and the eastern IO (IO-exp). The outlined regions 1, 2, 3, 4, 5, and 6 marked in Fig. 4c are the SST anomaly domains prescribed in ATL-exp, TWP-exp, WP-exp, EJP-exp, ENP-exp, and IO-exp. Notably, the climatological mean SIC was prescribed in all SST anomaly experiments. Therefore, the impacts of SIC in 2018 were not evaluated. Anomalies of each experiment subtracted from the control run were analyzed to identify the impacts of the SST anomalies in individual basins.

As shown in Fig. 5a, the observed circulation in JA 2018 was characterized by zonally distributed positive GHT500 anomalies from 30°N to 60°N, which were associated with a cyclonic anomaly over the WNP monsoon trough area from 100°E to 150°E and 10°N to 30°N (Fig. 3d). These features formed a wave-like perturbation arching over the extratropical North Pacific from the East Asian coast to the Gulf of Alaska. GHT500, rather than GHT200 and GHT1000, is shown here because GHT500 can represent both the positive anomaly over Northeast Asia, where heat waves occurred, and the negative anomaly over the monsoon trough region. The overall pattern was reasonably simulated in the global SST anomaly simulation (GL-exp, Fig. 5b); however, some phase shifts and weaker amplitudes (e.g., zonally elongated anomaly) were observed. The relative contributions of SST anomalies in various basins to this anomalous perturbation pattern was explored using eight other SST anomaly sensitivity experiments. As previously discussed, the SST anomaly in the tropical North Pacific likely played a crucial role in triggering the north–south circulation dipole in East Asia and the WNP. This hypothesis was partially supported by TWP-exp forced by the positive SST anomaly in the tropical western Pacific. As shown in Fig. 5c, a negative–positive GHT anomaly was simulated in the WNP, indicating an enhanced monsoon trough (although not statistically significant) and a northward-shifted anticyclonic ridge. In addition, the anomalies arching over the extratropical North Pacific simulated in the global SST anomaly experiment were reasonably reproduced in the TWP experiment, except with a weaker zonally elongated component in the eastern North Pacific. Evidently, some of the anomalies in the observations and GL-exp could be attributed to the positive SST anomaly in the TWP, which induced atmospheric perturbations that propagated downstream and spread over the North Pacific. This result is consistent with findings that the PJ pattern is often induced by anomalous convection activity over the Philippine Sea (Nitta 1987; Kosaka and Nakamura 2006, 2010; Hsu and Lin 2007; Hirota and Takahashi 2012).
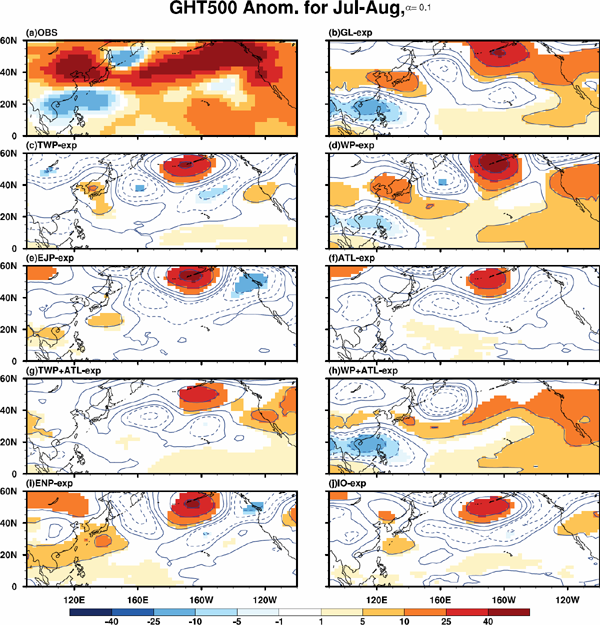
In addition to the SST anomaly in the tropical western Pacific, positive and negative SST anomalies were present in the extratropical WNP. To examine the possible contribution of extratropical SST anomalies that reflect the warmer SST in the Kuroshio extension and anomalous SST gradient in the region, WP-exp including all SST anomalies west of the date line in the North Pacific was conducted. The result shown in Fig. 5d indicates that including the additional SST anomaly forcing in the extratropical WNP enhanced both the south–north pair of the negative–positive anomaly in the WNP and the wave-like perturbation arching over the extratropical North Pacific. The most significant improvement was the more realistically simulated south-north dipole in the WNP, reflecting an enhanced monsoon trough and a northward-shifted anticyclonic ridge. The amplitudes of simulated perturbations in WP-exp were nearly as large as those in GL-exp, suggesting the dominant forcing effect of local SST anomalies in the WNP. By contrast, if only the positive SST anomaly in the extratropical WNP was considered as it was in EJP-exp (Fig. 5e), only the wave-like perturbation over the extratropical North Pacific could be induced and the negative anomaly in the monsoon trough was not simulated. Notably, including the negative SST anomaly in the extratropical WNP yielded a similar result (not shown).
Both anomalous SST anomalies in the tropical and extratropical WNP were needed to properly induce the observed enhanced monsoon trough and northward-shifted anticyclonic ridge. We further explored this enhancement; Fig. 6 presents the cross sections of vertical motion in the pressure coordinate and wave activity flux (WAF; Takaya and Nakamura 2001) averaged over 110–140°E in the observations, GL-exp, TWP-exp, WP-exp, TWP+ATL-exp, and WP+ATL-exp. GL-exp simulated the major features of observed perturbations (Figs. 6a, b), such as the lower-level (upper-level) northward (southward) WAF south of 35°N, the anomalous upward (downward) motion in the tropics (subtropics), and the perturbations north of 35°N. Although the amplitudes of the observed and simulated vertical motion were equivalent, the amplitudes of the simulated WAF were generally weaker than those of the observed WAF and are represented by different unit vectors. A weaker WAF was particularly evident in the upper troposphere, but it was qualitatively similar. This deficiency might have been be an inherent problem in the model, but it could not be exactly understood. The basic features with weaker amplitudes were reproduced in TWP-exp (Fig. 6c) and further enhanced in WP-exp after the inclusion of SST anomalies in the extratropical WNP (Fig. 6d). By contrast, these anomalous features were poorly simulated in EJP-exp (not shown). The much-enhanced positive anticyclonic anomalies over the extratropical WNP in WP-exp may have indirectly affected the enhanced monsoon trough, which was relatively weak when forced with the TWP SST anomaly only. The enhanced monsoon trough further triggered convection in the tropical WNP and contributed to a PJ pattern-like response. In other words, the mutual enhancement of the atmospheric responses induced by the SST anomaly in both the tropical and extratropical WNP was likely the key to the improved simulation of the observed anomalous circulations in the WNP. The phenomenon can also be interpreted as follows: The PJ pattern has been identified as an intrinsic mode, which is embedded in the summertime mean flow over the East Asian and WNP region (Kosaka and Nakamura 2006, 2010; Hsu and Lin 2007; Hirota and Takahashi 2012) and can be induced by various forcings or perturbations. The joint effect of SST forcing in the tropical and extratropical WNP likely provided a stronger forcing and induced a larger PJ-pattern-like response in WP-exp than in TWP-exp and EJP-exp, which considered only SST anomalies in one region.

Liu et al. (2019) reported the contribution of the NA SST tripole to the observed anomalous ridge in the extratropical WNP. The influence of the NA SST anomaly was evaluated in ATL-exp (Fig. 5f) and the combined SST anomaly experiments, namely TWP+ATL-exp (Fig, 5g) and WP+ATL-exp (Fig. 5h). The NA SST tripole-like anomaly appeared to induce a wave-like perturbation in the North Pacific (Fig. 5f) similar to that in the aforementioned experiments but with weaker amplitudes that were statistically significant only over the Aleutian Islands. The impact of the anomaly on the wave-like perturbation was relatively minimal in combination with the SST anomaly in the WNP (i.e., TWP+ATL-exp in Fig. 5g and WP+ATL-exp in Fig. 5h). The major positive impact, however, was the enhancement of the monsoon trough in WP+ ATL-exp. Notably, a similar impact was not observed in TWP+ATL-exp (Fig. 5g), suggesting the crucial contribution of the SST anomaly in the extratropical WNP in enhancing the monsoon trough. A comparison of the cross sections shown in Figs. 6c–f revealed a similar contrast; enhancement was only observed when the SST anomaly in the whole WNP was included (i.e., WP+ATL-exp). The enhanced anticyclonic anomaly over extratropical East Asia in WP-exp served as a path for the WAF induced by the NA SST anomaly to further propagate southeastward to the Philippine Sea and increased the mutual enhancement of the south-north dipole discussed previously.
The wide impact of the NA SST anomaly was further explored in the longitude–height cross section of geopotential height averaged over 30–60°N, where the extratropical perturbations over the Eurasian continent were the most evident. The observed perturbation was characterized by a northern circumpolar perturbation (mainly positive anomalies), with the maximum amplitude in the upper troposphere over specific regions (e.g., Europe and Northeast Asia; Fig. 7a). As reported by Liu et al. (2019), the pattern was the combination of a zonal mean increase and a wave-like perturbation that was realistically simulated in GL-exp except over East Asia (Fig. 7b). The observed wave-like perturbation over the Eurasian continent was not particularly evident in TWP-exp (Fig. 7c). Including the SST anomaly in the extratropical North Pacific in WP-exp enhanced the wave-like pattern and zonal component both upstream and downstream (Fig. 7d), making the anomalies more in phase with the anomalies in observation and in the GL-exp. When the NA SST anomaly was added in TWP-exp and WP-exp, the wave-like pattern was not evidently enhanced (Figs. 7e, f). This intercomparison of four experiments suggests that the SST anomaly in the extratropical WNP exerted larger effects on the extratropical circulation than did the NA SST anomaly. In summary, the remote influence of the NA SST anomaly reported by Liu et al. (2019) and Chen, L. et al. (2019) seemed limited in our series of simulations.

The SST anomalies in the subtropical eastern North Pacific and the tropical eastern IO have been suggested playing a crucial role in inducing the anomalous circulation in the WNP in 2018 (Tao et al. 2012; Chen, R. et al. 2019; Takaya 2019). The impact of the SST anomaly in the subtropical eastern North Pacific (region 5 in Fig. 4c) was examined in the ENP-exp. Evidently, prescribing the SST anomaly in the subtropical eastern North Pacific induced not only wave-like perturbations in the extratropical North Pacific, as in all other experiments, but also positive anomalies near the monsoon trough region that reflected a weakened monsoon trough. Thus, the eastern North Pacific SST anomaly contributed positively to the wave-like perturbations in the extratropical North Pacific but did not seem to enhance the monsoon trough. This result is inconsistent with those of Takaya (2019) and Qian et al. (2019) and will be further discussed in the discussion section. IO-exp considered the impacts of the negative SST anomaly over the eastern tropical IO (Fig. 5j). A comparison between Figs. 5b and 5j indicates that the negative SST anomaly in the tropical eastern IO enhanced the overall circulation pattern in the extratropical North Pacific but had little effect on the monsoon trough. The hypothesis suggested in an empirical diagnostic study (Chen, R. et al. 2019) that the negative SST anomaly in the eastern IO enhanced the monsoon trough could be not confirmed in our study.
d. Precipitation and TC genesis potential
The observed excessive rainfall over the WNP monsoon trough area associated with the low-level (850-hPa) cyclonic circulation anomaly (Fig. 8a) was reasonably simulated, although slightly weaker and shifted westward, in GL-exp and WP-exp, as shown in Figs. 8b and 8d. By contrast, the cyclonic anomaly and excessive rainfall were not properly simulated in TWP-exp (Fig. 8c). This contrast between WP-exp and TWP-exp is consistent with the previous discussion that SST anomaly forcing in the extratropical WNP was an important factor enhancing the anomalous rainfall and circulation in the western portion of the WNP (Fig. 8d), and it yielded a more realistic simulation. However, the circulation and precipitation in 150°E–180°, where the Bonin high prevailed, were less realistic likely because of the inability of the model to simulate the observed zonally elongated positive anomalies over the extratropical North Pacific. As expected, the addition of the NA SST anomaly further enhanced the excessive rainfall and monsoon trough in WP+ATL-exp (Fig. 8f) but not in TWP+ATL-exp (Fig. 8e).

As mentioned in the Introduction, TC activity in JA 2018 was among the highest since the beginning of the record (Tokyo Climate Center, Japan Meteorological Agency 2018a; Shimpo et al. 2019; Takaya 2019). Our experiments were conducted in coarse spatial resolutions that do not resolve TCs. We therefore evaluated the TC genesis potential index (GPI, Emanuel and Nolan 2004; Camargo et al. 2007) to infer the implications of the simulation results in terms of potential TC activity. The overall positive anomaly of the TC genesis potential index (Fig. 9a) revealed favorable environmental conditions (e.g., high SSTs, enhanced cyclonic circulation, and moisture content) for TC genesis in JA 2018. This enhanced GPI environment in the WNP was more realistically simulated in the regions west of 160°E in GL-exp (Fig. 9b) and to some extent in TWP-exp, WP-exp, TWP+ATL-exp, and WP+ATL-exp (Figs. 9c–f). Including the extratropical SST anomaly in the WNP and NA helped extend the region of positive GPI anomalies further northward and yielded a closer resemblance to the observations (Figs. 9e, f compared with Figs. 9c, d). Figure 9h presents the negative and positive influences of the NA SST anomaly on the GPI anomalies in the tropical and subtropical WNP, respectively, that were reversed to the GPI anomaly in the observations and GL-exp. The SST anomaly in the tropical eastern North Pacific tended to produce a negative GPI anomaly (Fig. 9i) consistent with the simulated anticyclonic anomaly in the monsoon trough region (Fig. 5i). Including the SST anomaly in the tropical eastern IO (IO-exp) also did not seem to contribute positively to the observed GPI anomalies (Fig. 9j).

4. Summary and discussion
In the WNP during JA 2018, the anomalously northward-shifted Pacific subtropical high and the enhanced monsoon trough resulted in rainfall deficit and record-breaking heat in Northeast Asia and an anomalously active WNP summer monsoon and excessive rainfall in the South China Sea and Philippine Sea. Northward-shifted steering flow and TC tracks resulted in the highest TC activity north of 30°N since 1981. Consistent with these abnormal phenomena, the PJ index and the tripolar rainfall pattern also had record-high amplitudes. In addition, the SST in the tropical WNP and the subtropical eastern North Pacific were above the 95th percentile, and the NA SST tripole was the highest since 1981.
This study used the CAM5 AGCM to conduct a series of experiments by forcing the model with the SST anomaly in the global domain, the tropical and extratropical WNP, the subtropical eastern North Pacific, the tropical eastern IO, and NA to determine the relative influences of SST anomalies on these basins. The experiment forced by the global SST anomaly reasonably reproduced the observed wave-like pattern emanating from the tropical WNP to the extratropical WNP and arching over the extratropical North Pacific to the Gulf of Alaska. This result confirmed the key role of anomalous SSTs in causing the observed anomalies during JA 2018. The joint influences of the SST anomalies in both the tropical and extratropical WNP was the major factor that strengthened the WNP summer monsoon and the northward shift of the Pacific subtropical high. Regarding the influences of individual SST anomaly, the tropical WNP SST anomaly induced a wave-like pattern resembling the observations but with relatively weak amplitude in the monsoon trough region. The extratropical WNP SST anomaly alone had little effect on the monsoon trough while inducing the wave-like perturbation in the extratropical North Pacific.
The anomalous SST anomalies in both the tropical and extratropical WNP were required to properly induce the observed enhanced monsoon trough and northward-shifted anticyclonic ridge. The mutual enhancement of the atmospheric responses induced by the SST anomalies in both the tropical and extratropical WNP was suggested to be the key for the reasonable simulation of the observed anomalous circulations in the WNP. The mutual enhancement can also be interpreted as the amplification of an intrinsic mode (i.e., the PJ pattern) embedded in the summer-time mean flow over East Asia and the WNP, which can be induced by various forcings or perturbations (Hsu and Lin 2007; Kosaka and Nakamura 2006, 2010; Hirota and Takahashi 2012). The joint effect of the SST anomalies in the tropical and extratropical WNP likely provided a stronger forcing that induced a larger PJ-pattern-like response than when the effects of individual SST anomalies were separately considered.
In addition to the local effect of the WNP SST anomaly, remote effects of the NA SST tripole, the PMM-like SST anomaly in the subtropical eastern North Pacific (Qian et al. 2019; Takaya 2019), and the negative SST anomaly in the tropical eastern IO have been proposed to induce anomalous circulations in the WNP (Du et al. 2011; Tao et al. 2012). The relative influences of these SST anomaly were evaluated in a series of SST anomaly sensitivity experiments. All these SST anomalies induced the wave-like perturbation arching over the extratropical North Pacific, but mostly either weakened the monsoon trough or had little effect. The only difference was the NA SST anomaly that contributed to the enhancement of the monsoon trough when the SST anomaly in the WNP was also included in the simulation. The enhanced anticyclonic anomaly over extratropical East Asia in the experiment forced by the WNP SST anomaly served as a path for the wave activity induced by the NA SST anomaly to propagate further southeastward to the Philippine Sea and enhance the monsoon trough.
The elongated positive SST anomaly spreading from the tropical WNP to the subtropical eastern North Pacific, referred to as the PMM-like SST anomaly, was reported to enhance the monsoon trough and TC activity in the WNP (Takaya 2019; Qian et al. 2019). Our simulation, however, suggested that the western part of this elongated positive SST anomaly contributed to enhancing the monsoon trough, whereas the eastern part weakened the observed circulation in the whole North Pacific. The effect of the SST anomaly in the eastern North Pacific was consistent with Hong et al. (2018), who identified the distinct influences of ENSO-like and PMM-like SST anomalies on mean TC genesis location in the WNP. The cause of the discrepancy between our simulations and Qian et al. (2019) in not understood. Here, we summarize different simulation approaches between the present study and that of Qian et al. (2019). First, different models were used, and our simulations were conducted in a coarse spatial resolution to simulate the large-scale circulation instead of TCs. Second, Qian et al. (2019) did not separately consider the effects of SST anomalies in the western and eastern North Pacific or investigate their relative contributions. Third, Hsu et al. (2008) and Arakane and Hsu (2020) found that the existence of TCs enhanced the seasonal mean and variability of the monsoon trough. The same effect may exist in the TC-resolving model. In that case, a TC-resolving model might better simulate a strong monsoon trough than a coarse-resolution model would. Further studies are required to confirm this conjecture.
Based on the simulation results, we propose the local effect of the SST anomaly in the WNP to be the major driver and the remote effect of the SST anomaly in the NA to be a minor contributor of the anomalous Pacific subtropical high and monsoon trough and the climate extremes in the WNP during JA 2018. The anomalous circulation in the WNP exhibited the characteristics of the PJ pattern, which is an intrinsic mode embedded in the mean flow (Kosaka and Nakamura 2010) and can be induced by forcing in different regions (Hirota and Takahashi 2012). The phenomenon that occurred in JA 2018 was likely a manifestation of such a dynamic process, and because of this nature, the compound effect of SST anomalies in different basins led to the extremely anomalous circulation. The same view can be applied to the wave-like pattern, simulated in every SST anomaly sensitivity experiment, that arched over the extratropical North Pacific. Whether this wave-like pattern is an intrinsic mode in which the PJ pattern is embedded warrants further research.
Considering that the use of AGCMs was more effective in simulating monsoon circulation than rainfall was in the WNP (Wang et al. 2004), our study focused on the impact of anomalous SST anomalies on the WNP circulation and did not aim to obtain a complete understanding of how the observed anomalous atmosphere-ocean conditions occurred. Although this one-way AMIP-type approach could not elucidate the complete physical process leading to the extremity in the WNP during JA 2018 or help quantify the exact contribution of SST anomaly, it provided valuable information regarding the effects of the anomalous SST on the anomalous circulations and relative contributions of various ocean basins.
Finally, regarding model dependency, the results were based on only one AGCM; therefore, the possibility of model dependency, as indicated by Qian et al. (2019), could not be ruled out. Different models may have different degrees of sensitivity and responses to the same forcing. This phenomenon was demonstrated in the intercomparison study with numerous models conducted for the Coupled Model Intercomparison Project. A similar sensitivity and spread are likely present in the AMIP-type simulations of seasonal anomalies. Nevertheless, it is worthwhile to present our findings and new interpretation of the extreme events of 2018 by using the CAM5, which has been used in numerous studies and proven to be reliable.
Acknowledgments
This study was supported by the Ministry of Science and Technology, Taiwan (MOST 109-2123-M-001-004, 107-2119-M-001-010, and 107-2111-M-845-001). We are grateful to the National Center for High-Performance Computing for providing computer facilities. This manuscript was edited by Wallace Academic Editing.
References
- Arakane, S., and H.-H. Hsu, 2020: A tropical cyclone removal technique based on potential vorticity inversion to better quantify tropical cyclone contribution to the background circulation. Climate Dyn., 54, 3201-3226.
- Camargo, S. J., K. A. Emanuel, and A. H. Sobel, 2007: Use of a genesis potential index to diagnose ENSO effects on tropical cyclone genesis. J. Climate, 20, 4819-4834.
- Chen, L., W. Gu, and W. Li, 2019: Why is the East Asian summer monsoon extremely strong in 2018?—Collaborative effects of SST and snow anomalies. J. Meteor. Res., 33, 593-608.
- Chen, M., P. Xie, J. E. Janowiak, and P. A. Arkin, 2002: Global land precipitation: A 50-yr monthly analysis based on gauge observations. J. Hydrometeor., 3, 249-266.
- Chen, R., Z. Wen, and R. Lu, 2019: Influences of tropical circulation and sea surface temperature anomalies on extreme heat over Northeast Asia in the midsummer of 2018. Atmos. Oceanic Sci. Lett., 12, 238-245.
- Deng, K., S. Yang, A. Lin, C. Li, and C. Hu, 2019: Unprecedented East Asian warming in spring 2018 linked to the North Atlantic tripole SST mode. Atmos. Oceanic Sci. Lett., 12, 246-253.
- Du, Y., L. Yang, and S.-P. Xie, 2011: Tropical Indian Ocean influence on northwest Pacific tropical cyclones in summer following strong El Niño. J. Climate, 24, 315-322.
- Emanuel, K. A., and D. S. Nolan, 2004: Tropical cyclone activity and the global climate system. Proceeding of the 26th Conference on Hurricanes and Tropical Meteorolgy, Amer. Meteor. Soc., 240-241.
- Gao, S., L. Zhu, W. Zhang, and Z. Chen, 2018: Strong modulation of the Pacific meridional mode on the occurrence of intense tropical cyclones over the western North Pacific. J. Climate, 31, 7739-7749.
- Ha, K.-J., J.-H. Yeo, Y.-W. Seo, E.-S. Chung, J.-Y. Moon, X. Feng, Y.-W. Lee, and C.-H. Ho, 2020: What caused the extraordinarily hot 2018 summer in Korea? J. Meteor. Soc. Japan, 98, 153-167.
- Hirota, N., and M. Takahashi, 2012: A tripolar pattern as an internal mode of the East Asian summer monsoon. Climate Dyn., 39, 2219-2238.
- Hong, C.-C., M.-Y. Lee, H.-H. Hsu, and W.-L. Tseng, 2018: Distinct influences of the ENSO-like and PMM-like SST anomalies on the mean TC genesis location in the western North Pacific: The 2015 summer as an extreme example. J. Climate, 31, 3049-3059.
- Hsu, H. H., and X. Liu, 2003: Relationship between the Tibetan Plateau heating and East Asian summer monsoon rainfall. Geophys. Res. Lett., 30, 302066, doi: 10.1029/2003GL017909.
- Hsu, H.-H., and S.-M. Lin, 2007: Asymmetry of the tripole rainfall pattern during the East Asian summer. J. Climate, 20, 4443-4458.
- Hsu, H.-H., C.-H. Hung, A.-K. Lo, C.-C. Wu, and C.-W. Hung, 2008: Influence of tropical cyclones on the estimation of climate variability in the tropical western North Pacific. J. Climate, 21, 2960-2975.
- Huang, B., V. F. Banzon, E. Freeman, J. Lawrimore, W. Liu, T. C. Peterson, T. M. Smith, P. W. Thorne, S. D. Woodruff, and H.-M. Zhang, 2015: Extended reconstructed sea surface temperature version 4 (ERSST. v4). Part I: Upgrades and intercomparisons. J. Climate, 28, 911-930.
- Imada, Y., M. Watanabe, H. Kawase, H. Shiogama, and M. Arai, 2019: The July 2018 high temperature event in Japan could not have happened without human-induced global warming. SOLA, 15A, 8-12
- Kalnay, E., M. Kanamitsu, R. Kistler, W. Collins, D. Deaven, L. Gandin, M. Iredell, S. Saha, G. White, J. Woollen, Y. Zhu, M. Chelliah, W. Ebisuzaki, W. Higgins, J. Janowiak, K. C. Mo, C. Ropelewski, J. Wang, A. Leetmaa, R. Reynolds, R. Jenne, and D, Joseph, 1996: The NCEP/NCAR 40-year reanalysis project. Bull. Amer. Meteor. Soc., 77, 437-472.
- Kobayashi, C., and I. Ishikawa, 2019: Prolonged northern-mid-latitude tropospheric warming in 2018 well predicted by the JMA operational seasonal prediction system. SOLA, 15A, 31-36.
- Kornhuber, K., S. Osprey, D. Coumou, S. Petri, V. Petoukhov, S. Rahmstorf, and L. Gray, 2019: Extreme weather events in early summer 2018 connected by a recurrent hemispheric wave-7 pattern. Environ. Res. Lett., 14, 054002, doi:10.1088/1748-9326/ab13bf
- Kosaka, Y., and H. Nakamura, 2006: Structure and dynamics of the summertime Pacific–Japan teleconnection pattern. Quart. J. Roy. Meteor. Soc., 132, 2009-2030.
- Kosaka, Y., and H. Nakamura, 2010: Mechanisms of meridional teleconnection observed between a summer monsoon system and a subtropical anticyclone. Part I: The Pacific–Japan pattern. J. Climate, 23, 5085-5108.
- Liebmann, B., and C. A. Smith, 1996: Description of a complete (interpolated) outgoing longwave radiation dataset. Bull. Amer. Meteor. Soc., 77, 1275-1277.
- Liu, B., C. Zhu, J. Su, S. Ma, and K. Xu, 2019: Record-breaking northward shift of the western North Pacific subtropical high in July 2018. J. Meteor. Soc. Japan, 97, 913-925.
- Moteki, Q., 2019: Role of Typhoon Prapiroon (Typhoon No. 7) on the formation process of the Baiu front inducing heavy rain in July 2018 in western Japan. SOLA, 15A, 37-42.
- Neale, R. B., C.-C. Chen, A. Gettelman, P. H. Lauritzen, S. Park, D. L. Williamson, A. J. Conley, R. Garcia, D. Kinnison, J.-F. Lamarque, D. Marsh, M. Mills, A. K. Smith, S. Tilmes, F. Vitt, H. Morrison, P. Cameron-Smith, W. D. Collins, M. J. Iacono, R. C. Easter, S. J. Ghan, X. Liu, P. J. Rash, and M. A. Taylor, 2012: Description of the NCAR community atmosphere model (CAM 5.0). NCAR Tech. Note, NCAR/TN-486+ STR, 289 pp.
- Nitta, T., 1987: Convective activities in the tropical western Pacific and their impact on the Northern Hemisphere summer circulation. J. Meteor. Soc. Japan, 65, 373-390.
- Qian, Y., H. Murakami, M. Nakano, P.-C. Hsu, T. L. Delworth, S. B. Kapnick, V. Ramaswamy, T. Mochizuki, Y. Morioka, T. Doi, T. Kataoka, T. Nasuno, and K. Yoshida, 2019: On the mechanisms of the active 2018 tropical cyclone season in the North Pacific. Geophys. Res. Lett., 46, 12293-12302.
- Sekizawa, S., T. Miyasaka, H. Nakamura, A. Shimpo, K. Takemura, and S. Maeda, 2019: Anomalous moisture transport and oceanic evaporation during a torrential rainfall event over western Japan in early July 2018. SOLA, 15A, 25-30.
- Shimpo, A., K. Takemura, S. Wakamatsu, H. Togawa, Y. Mochizuki, M. Takekawa, S. Tanaka, K. Yamashita, S. Maeda, R. Kurora, H. Murai, N. Kitabatake, H. Tsuguti, H. Mukougawa, T. Iwasaki, R. Kawamura, M. Kimoto, I. Takayabu, Y. N. Takayabu, Y. Tanimoto, T. Hirooka, Y. Masumoto, M. Watanabe, K. Tsuboki, and H. Nakamura, 2019: Primary factors behind the heavy rain event of July 2018 and the subsequent heat wave in Japan. SOLA, 15A, 13-18.
- Stuecker, M. F., 2018: Revisiting the Pacific meridional mode. Sci. Rep., 8, 3216, doi:10.1038/s41598-018-21537-0.
- Sueki, K., and Y. Kajikawa, 2019: Different precipitation systems between Hiroshima and Keihanshin during extreme rainfall event in western Japan in July 2018. J. Meteor. Soc. Japan, 97, 1221-1232.
- Takaya, K., and H. Nakamura, 2001: A formulation of a phase-independent wave-activity flux for stationary and migratory quasigeostrophic eddies on a zonally varying basic flow. J. Atmos. Sci., 58, 608-627.
- Takaya, Y., 2019: Positive phase of Pacific meridional mode enhanced western North Pacific tropical cyclone activity in summer 2018. SOLA, 15A, 55-59.
- Takemi, T., and T. Unuma, 2019: Diagnosing environmental properties of the July 2018 heavy rainfall event in Japan. SOLA, 15A, 60-65.
- Takemura, K., S. Wakamatsu, H. Togawa, A. Shimpo, C. Kobayashi, S. Maeda, and H. Nakamura, 2019: Extreme moisture flux convergence over western Japan during the heavy rain event of July 2018. SOLA, 15A, 49-54.
- Tao, L., L. Wu, Y. Wang, and J. Yang, 2012: Influence of tropical Indian Ocean warming and ENSO on tropical cyclone activity over the western North Pacific. J. Meteor. Soc. Japan, 90, 127-144.
- Tokyo Climate Center, Japan Meteorological Agency, 2018a: Primary factors behind the heavy rain event of July 2018 and the subsequent heatwave in Japan from mid-July onward. Reports on specific events, Climate System Monitoring, 24 pp.
- Tokyo Climate Center, Japan Meteorological Agency, 2018b: Summary of the 2018 Asian summer monsoon. TCC News, 54, 6-9.
- Vogel, M. M., J. Zscheischler, R. Wartenburger, D. Dee, and S. I. Seneviratne, 2019: Concurrent 2018 hot extremes across Northern Hemisphere due to human-induced climate change. Earth's Future, 7, 692-703.
- Wang, B., R. Wu, and K.-M. Lau, 2001: Interannual variability of the Asian summer monsoon: Contrasts between the Indian and the western North Pacific–East Asian monsoons. J. Climate, 14, 4073-4090.
- Wang, B., I.-S. Kang, and J.-Y. Lee, 2004: Ensemble simulations of Asian–Australian monsoon variability by 11 AGCMs. J. Climate, 17, 803-818.
- Wang, S. S. Y., H. Kim, D. Coumou, J.-H. Yoon, L. Zhao, and R. R. Gillies, 2019: Consecutive extreme flooding and heat wave in Japan: Are they becoming a norm? Atmos. Sci. Lett., 20, e933, doi:10.1002/asl.933.
- Yokoyama, C., H. Tsuji, and Y. N. Takayabu, 2020: The effects of an upper-tropospheric trough on the heavy rainfall event in July 2018 over Japan. J. Meteor. Soc. Japan, 98, 235-255.
