Article
東アジアの大寒波発生に至った長周期・下流発達プロセス
2021 年 99 巻 5 号 p. 1185-1200

詳細
2021 年 99 巻 5 号 p. 1185-1200
An unprecedented cold wave swept through most parts of East Asia in January 2016, leading to record-breaking low temperatures and widespread snowstorms in several regions. Our analysis indicated that this East Asian cold wave was triggered by a series of consecutive extreme events in the Northern Hemisphere from late 2015 to early 2016. (1) On 28 December 2015, a severe cyclonic storm emerged in the North Atlantic, and a downstream blocking high formed in Europe through the downstream development process. The strong southerly jet stream between the storm and its downstream blocking high steered the storm into the Arctic Circle, transported enormous warm and moist air masses, establishing warm conveyor belts, which led to an extraordinary Arctic warming event in late 2015. (2) This Arctic warming event in late 2015 resulted in a distinct Arctic dipole pattern resembling the negative phase of the Arctic Oscillation in early–mid-January 2016. (3) The dipole pattern induced eastward propagation of the Rossby wave and led to the occupation of two downstream blocking highs in the Urals and western North America. These two blocking highs, together with the low pressure between them, resulted in an inverted omega-shaped circulation pattern (IOCP) over the Siberia–North Pacific region. Additionally, the IOCP distinctly modulated the meridional circulation cell along the East Asia–Siberia regions, which generated negative vorticity and anticyclonic advection to the Siberian region, ultimately intensifying the Siberian high. The IOCP and the associated enhanced Siberian high eventually induced the outbreak of a mega-cold wave in East Asia on 21–25 January 2016.
Much interest surrounds the influence of the recent and rapid warming Arctic region on the climate, cryosphere, and ecosystems of the Northern Hemisphere, particularly the impact on extreme cold events in Eurasia and North America. Emerging evidence has shown that Arctic warming is reducing poleward thickness (temperature) gradient of the northern midlatitude regions, thus weakening the zonal jet stream, increasing wave amplitude, and causing a slower progression of Rossby waves in the Northern Hemisphere (Francis et al. 2009; Overland and Wang 2010; Francis and Vavrus 2012). This effect on the Rossby waves not only causes associated atmospheric patterns to be more persistent in the northern mid-latitudes but also favors blocking development at northern mid-tohigh latitudes, leading to more frequent and intense cold waves (Francis and Vavrus 2012; Overland et al. 2015; Chen and Luo 2017). Other researches have suggested that the decrease in sea ice in the Barents– Kara Seas may prevent Arctic cyclones from traveling eastward, thus enhancing the Siberian High, the East Asian winter monsoon, and the cold waves that induce cold events in East Asia (Inoue et al. 2012; Liang et al. 2014).
Previous studies have suggested that Arctic warming affects Eurasian and North American winter weather and climate by modulating the dominant mode of atmospheric variability over the Arctic region, the Arctic Oscillation (Nakamura et al. 2016). Diagnostic and theoretical studies have shown that Arctic warming plays an important role in the transition of the polar circulation pattern to the negative phase of the Arctic Oscillation during winter, subsequently increasing the probability of extreme cold events across the northern mid-latitudes (Francis et al. 2009; Honda et al. 2009; Francis and Vavrus 2012; Ding et al. 2014). Modeling studies have further confirmed these observational results and provided a mechanism for the influence of Arctic warming on the negative phase of the Arctic Oscillation in winter (Peings and Magnusdottir 2014). The mode of the Arctic Oscillation has changed since the 1990s. Specifically, the wave number three pattern in the northern mid-to-high latitudes (characterized positive phase Arctic Oscillation) often changes to wave number two pattern (characterized negative phase Arctic Oscillation) in winter, leading to the outbreak of cold waves over northern Eurasia and eastern North America (Cohen et al. 2014; Screen 2017) but relatively mild conditions in the Arctic region. This distinct temperature pattern is referred to as the “warm Arctic and cold continents” (Overland et al. 2011).
These studies showed that the Arctic Oscillation is not only an atmospheric bridge connecting to the northern mid-latitudes but also serves as a dynamic pathway linking Arctic warming to weather and climate there as well. Cohen et al. (2014) reviewed the response of the Arctic Oscillation to Arctic warming and argued that the loss of sea ice in Chukchi and East Siberian Seas causes an increase in the atmospheric temperature and geopotential height in the midtroposphere, enhancing snow cover in Eurasia while decreasing the amount of sea ice in the Barents–Kara Seas (Ghatak et al. 2010; Orsolini et al. 2012). These shifts favor the vertical propagation of Rossby waves from the troposphere into the stratosphere, weakening the stratospheric polar vortex and leading to stratospheric warming (Nishii et al. 2009; Garfinkel et al. 2010; Cohen and Jones 2011; Jaiser et al. 2013; Wang et al. 2017). This warming event subsequently reaches the troposphere in winter, resulting in a negative phase of the Arctic Oscillation.
Winter temperatures over Eurasia have been decreasing since the early 2000s, which are inconsistent with the observed global mean temperatures (Cohen et al. 2014; Ding et al. 2014; Wang and Chen 2014). Extreme cold events over the Eurasian continent have become more frequent and intense since the end of the previous century. A series of unusually cold winters occurred in Eurasia in 2007/2008, 2009/2010, 2010/2011, 2011/2012, 2012/2013, and 2013/2014, and several studies have shown that they were due to the rapid warming of the Arctic (Cohen et al. 2012, 2014; Liu et al. 2012; Tang et al. 2013).
Eight severe low–temperature disasters have occurred in South China since 1950, and five of them were observed after the late 1990s. In January 2008, an unprecedented low temperature, rain, snow, and ice storm affected southern China and the Yangtze River Basin, the most populated and economically developed region of the country. This event resulted in large losses to the transportation, agriculture, power infrastructure, and energy sectors, besides its direct toll on human life (Ding et al. 2008; Zhou et al. 2011; Gong et al. 2014).
Another extreme cold wave impacted most parts of eastern and southeastern Asia in late January 2016, bringing the lowest observed temperatures in past decades, widespread snowstorms, and causing human casualties (Ma and Zhu 2019). Amidst this event, Amami Ōshima of Japan received snowfall for the first time in the past 115 years, and sleet was recorded in Okinawa for the first time since 1977 (Yamaguchi et al. 2019). At least 69 cities in China underwent the coldest temperatures in recorded history, with the low temperature in Erguna of Inner Mongolia (50–53°N, 119–121°E) reaching −46.8°C. Snow and sleet were observed in Guangzhou, southern China for the first time since 1949, and Hong Kong recorded the lowest temperature since 1957 (3.1°C; National Climate Center 2017). Both human-induced climate change and internal atmospheric variability were suggested to play essential roles in this particular extreme East Asian cold wave (Ma and Zhu 2019). The southward propagation of cold air mass from northern Siberia is the predominant cause of this extreme cold wave (Yamaguchi et al. 2019).
Before the cold wave development, strong warming in the Arctic region was recorded in late December 2015. The sixth severe Atlantic windstorm of the season, officially named Frank by the UK Met Office, was observed to enter the Arctic Circle on 28 December (Kim et al. 2017). Its central pressure deepened from 966 hPa on 29 December to 928 hPa on 30 December, in a process conventionally referred to as a “meteorological bomb” cyclone. Frank hit Iceland and western parts of the United Kingdom, bringing gales and severe flooding.
This chain of three extreme events across the North Atlantic, the Arctic region, and East Asia from late December 2015 to late January 2016 raised questions regarding any physical or intrinsic links between them specifically: What are the underlying mechanisms, if any, connecting severe Atlantic storms, subsequent explosive Arctic warming, and the intense cold waves in East Asia? Does the downstream development mechanism hold for this low-frequency event? The present study aimed to understand why these extreme events occurred in succession and what mechanisms linked their interaction.
This paper is organized as follows: In Section 2, the datasets and methods used in this study are introduced. A physical mechanism for Storm Frank over the North Atlantic is proposed in Section 3. In Section 4, the explosive Arctic warming event observed in late December 2015 and its influence on atmospheric circulation in the Arctic region are discussed. The East Asian cold wave in January 2016 is analyzed in Section 5, and a summary is presented in Section 6.
Data were acquired from the European Centre for Medium–Range Weather Forecasts ERA–Interim reanalysis dataset, with a horizontal resolution of 2.5° × 2.5° (Dee et al. 2011). Variables include the zonal and meridional wind, geopotential, vertical p-velocity, specific humidity, and temperature. The Arctic Oscillation index was obtained from the National Oceanic and Atmospheric Administration Climate Prediction Center (CPC) (https://www.cpc.ncep.noaa.gov/products/precip/CWlink/daily_ao_index/ao.shtml). Daily mean precipitation and surface air temperature (SAT) data were obtained from the CPC global unified gaugebased temperature and precipitation datasets, with a horizontal resolution of 0.5° × 0.5°.
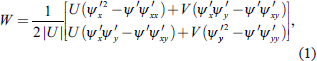
2.2 Wave-activity fluxStationary Rossby wave propagation was diagnosed using the wave-activity flux (W) defined by Takaya and Nakamura (1997, 2001). The horizontal components of the wave flux are expressed by Eq. (1):
 |
Moist static energy (S) is a thermodynamic variable that represents the state of an air parcel and is approximately conserved during adiabatic and hydrostatic descent or ascent processes (Yano and Ambaum 2017). Total S of the atmosphere is composed of two components of dry static energy (DSE) and latent energy (LE), as defined in the following Eqs. (2)–(4):
 |
 |
 |
Tropospheric circulation changes throughout the life cycle of Atlantic Storm Frank were examined initially. On 26 December 2015, the geopotential isolines in the mid-troposphere were densely distributed over the central United States and North Atlantic between 40°N and 60°N, where the front was flanked by a northern trough and a southern ridge (Fig. 1a). Over northeast North America, the mid-tropospheric trough was dynamically consistent with a cyclone in the lower troposphere on 26 December 2015 (Fig. 1e). The cyclone moved southeastward to the North Atlantic Ocean and was named Storm Frank on 28 December (Fig. 1g). As the trough moved further southeastward, a downstream blocking high emerged over western Europe, and a west low–east high pattern established over the Atlantic–Europe sector (Figs. 1b–d). A meridional jet stream with wind speeds of > 15 m s−1 formed between the areas of low and high pressure on 27 December (Fig. 1f), and steered the storm poleward, eventually entered the Arctic on 29 December (Fig. 1h). The warm conveyor belt (WCB) associated with the storm was established and transported enormous warm and moist air masses from the mid-latitude North Atlantic to the Arctic region. This northward atmospheric energy transport affects the temperature in the Arctic and, akin to S, can be split into DSE and LE components (Graversen and Burtu 2016). Figure 2 shows the poleward atmospheric energy transported by the WCB. The positive energy transport into the Arctic began on 27 December and became most pronounced on 29 December when the storm entered the Arctic Circle. Partitioning the energy transport into its components revealed that the DSE was larger than LE on 29 December. Moreover, the LE transport brought water vapor into the Arctic, which released heat and thus enhanced the associated greenhouse effect and downward longwave radiation to the surface in the Arctic.
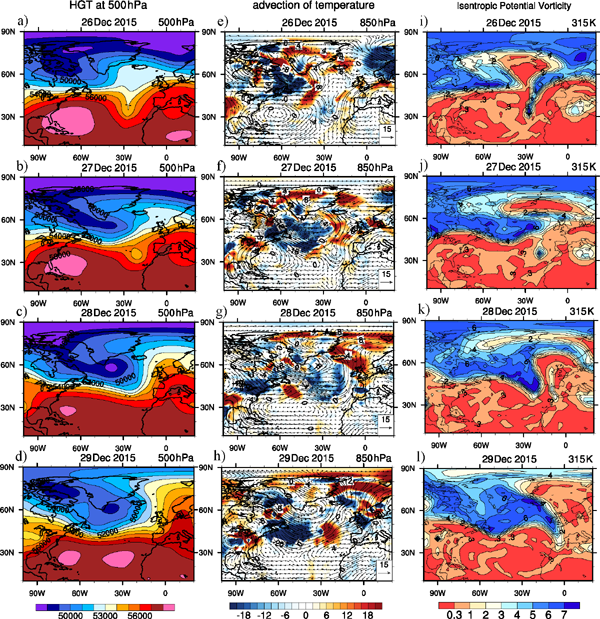
(a–d) Distribution of geopotential (unit: m2 s−2) at 500 hPa from 26 to 29 December 2015. (e–h) Same as (a–d) but for wind (vectors, unit: m s−1) and advection of temperature (shading, unit: K s−1) at 850 hPa. (i–l) Same as (a–d) but for potential vorticity (unit: PVU) on the 315 K isentropic surface.
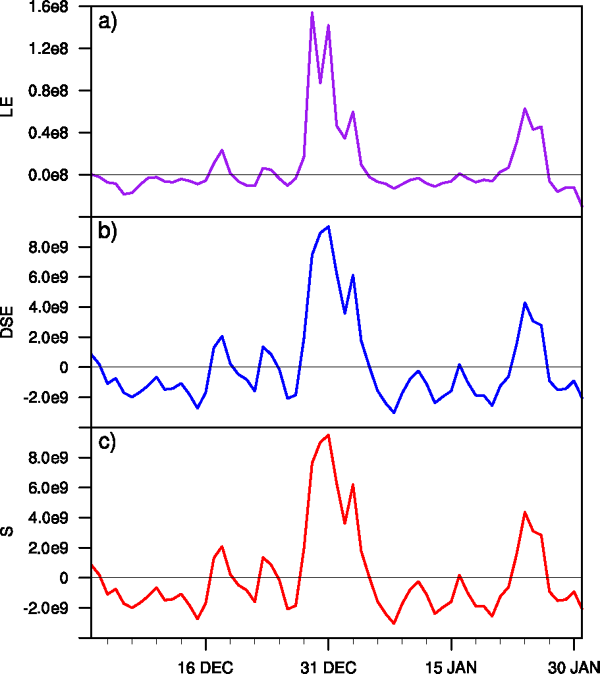
Northward atmospheric energy (integrated from surface to 300 hPa) flux (unit: W m−1) over North Atlantic (70–80°N, 20°W–25°E). The latent (a) and dry static (b) components are shown along with the total energy (c).
In late December 2015, the northern extratropical stratosphere did not feature the usual concentric ring pattern, but instead, the polar vortex stretched along the 90°W–90°E line (Figs. 3a–c), particularly evident in the geopotential tendency field. Two centers of negative geopotential trend emerged along the 90°W–90°E line on 23 December (Fig. 3d). One was located over northeast Canada, and the other over Siberia; both were attributed to the stretching event. The two negative centers enhanced and rotated slightly counterclockwise after 24 December (Figs. 3e, f). The potential vorticity (PV) field in the stratosphere showed a mass of high potential air stretching across the 90°W – 90°E line moving from the Arctic region toward the eastern side of North America and the North Atlantic Ocean (Figs. 3g–i).
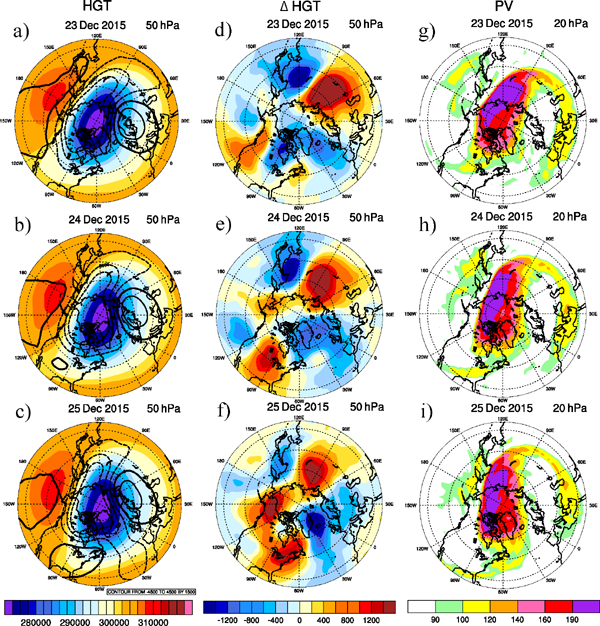
Distribution of geopotential (shading) and its anomalies (contours) (a–c, unit: m2 s−2), the changes in geopotential (d–f, unit: m2 s−2) (current day minus preceding day) at 50 hPa and potential vorticity (g–i, unit: PVU) at 20 hPa from 23 to 25 December 2015.
The isentropic surface at 315 K is above 250 hPa near the lower stratosphere in the Arctic region, at 300–400 hPa in the upper troposphere over midlatitudes, and near 700 hPa in the lower troposphere over the tropics. The source of high PV at high latitudes is located in the lower stratosphere and upper troposphere. The isentropic potential vorticity (IPV) in the lower stratosphere is usually > 4 PVU (PV units, 10−6 m2 K kg−1 s−1) but < 1.5 PVU in the troposphere; hence, the tropopause is generally represented by a set of dense contours at 1.5–3 PVU (Davis and Emanuel 1991).
Figures 1i–l show the evolution of the IPV on the 315 K isentrope over the lifetime of Storm Frank. During 26–27 December, the tropopause at ∼ 3 PVU was located along North America and the North Atlantic between 40°N and 50°N, with high IPV air in the lower stratosphere to the north and low IPV air in the troposphere to the south. Values of IPV > 4 PVU in the lower stratosphere primarily occurred in the Arctic region. The long tongue of high IPV air from the Arctic reservoir penetrated northeast North America, and the tongue of low IPV air grew rapidly over western Europe via the downstream effect (Figs. 1k, l), slowing the propagation eastward (Hoskins et al. 1985). The downstream development of low IPV led to a strong blocking high in western Europe, a signature feature of the cyclonic Rossby wave breaking event. The event advected high IPV from the Arctic to the North Atlantic and favored the formation and northeastward motion of Storm Frank on 28 December (Fig. 1k). This is consistent with the results from Gómara et al. (2014), who found that the explosive development of cyclones over western North America is typically linked to an enhanced cyclonic Rossby wave breaking over western Greenland.
According to the IPV equation (Hoskins et al. 1985), IPV can be treated as a combined variable of static stability and absolute vorticity on an isentropic surface. The static stability is higher in the stratosphere than in the troposphere; hence, the vorticity of the air mass increases when moving downward to the troposphere. Thus, when the long tongue of high IPV air moved southward from the Arctic region in the lower stratosphere to the North Atlantic Ocean in the troposphere on 27 December, the vorticity increased rapidly, and reached a maximum on 28 December (Figs. 1j, k), eventually leading to the creation and intensification of Storm Frank. The tongue of the high IPV then shifted poleward on 29 December and weakened slightly (Fig. 1l).
To further explore the origin of the high IPV, we examined the height–latitude cross-sections of IPV along eastern North America and the North Atlantic during 24–28 December (Fig. 4). On 24 December, a set of dense contours at 0.8–4.0 PVU, usually identified as the tropopause, were smooth and straight and sloped downward with latitude (Fig. 4a). At this time, the high IPV air was primarily confined to the stratosphere over the Arctic region. Notably, after 25 December, a tropopause folding extended from 100 hPa to 600 hPa in the North Atlantic Ocean (40–65°N; Figs. 4b–e). The folding of the tropopause strengthened after 25 December, becoming most apparent on 28 December (Fig. 4e), and it was accompanied by the intrusion of high IPV dry air in the stratosphere into the folding area (Chagnon et al. 2013; Fu et al. 2018), which originated from the Arctic region. On 28 December, the maximum IPV assembled in the folding area instead of the Arctic region as a result of the stretching polar vortex event. The high IPV moved downward from the folding area into the troposphere over the North Atlantic, enhancing the positive cyclonic vorticity and negative height perturbations, and further reinforcing Storm Frank. Previous studies found that the tropopause folding-related downward transport of large-value PV in the stratosphere governs the rapid development of oceanic cyclones, especially during the explosive development stage (Davis et al. 1996; Fu et al. 2018).
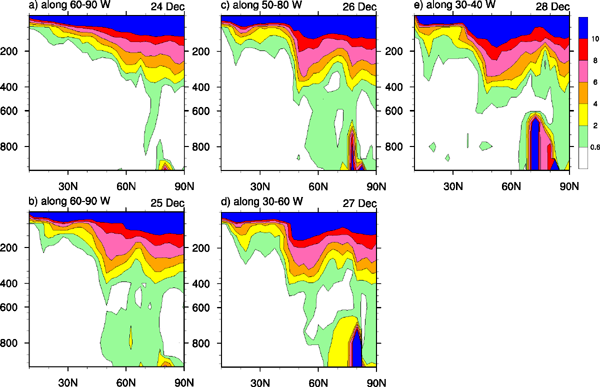
Height–latitude cross-section of potential vorticity (unit: PVU) along the central longitudes of the Atlantic storm from 24 to 28 December 2015.
Storm Frank recorded a minimum pressure of 928 hPa on 30 December 2015. The storm then moved northward through the Greenland Sea into the central Arctic on 31 December. During this time, a large warm and humid air mass was brought into the Arctic region by the WCB between the storm and the European blocking high. A significant increase in SAT was observed in the Arctic. Two low SAT centers in the Arctic region can be seen in Fig. 5a: one was located in the Queen Elizabeth Islands, and the other in East Siberia. The poleward extent of the 0°C isotherm of the SAT was close to the North Pole. Previously, the SAT was lower than average throughout the Arctic region in mid-December and then increased suddenly by 8°C over 4 days when the storm entered the Arctic Circle, and by 30 December, it was almost 7°C warmer than average (Fig. 5b). Although the SAT decreased slightly throughout the Arctic region after 1 January 2016, temperatures remained above average for 1 month. Kim et al. (2017) found that the strong Atlantic storm brought enormous warm and moist air to the Arctic region, not only triggering an abrupt Arctic warming but also decreasing the sea ice in the Barents–Kara Seas.
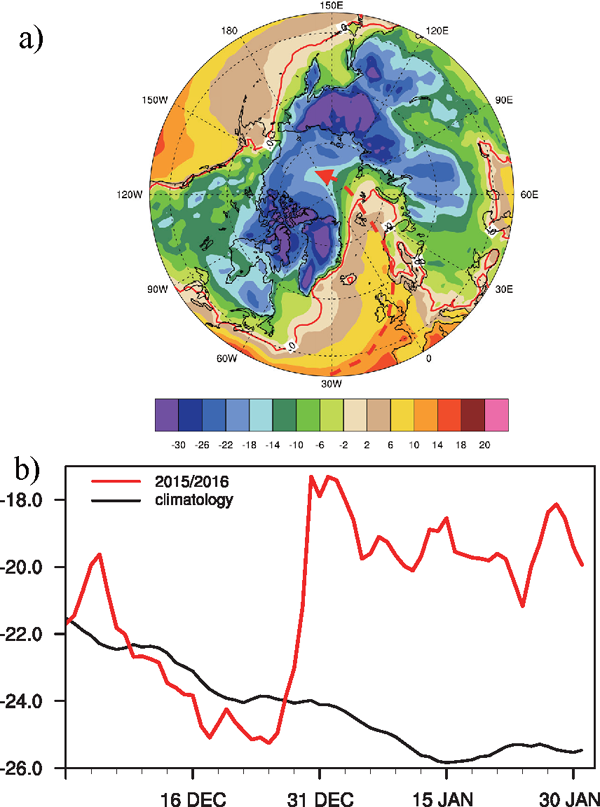
(a) Distribution of surface air temperature (unit: °C) over 30–31 December 2015. The 0°C isotherm is indicated as red contours. The dashed curve with an arrow denotes the direction of transport of warm and moist air masses to the Arctic. (b) Polar cap (north of 65°N) surface air temperature (unit: °C) from 1 December 2015 to 1 February 2016 (red curve) and its climatology for the period 1981–2010 (black curve).
A distinct change in the large-scale circulation regime occurred in the region after the explosive Arctic warming. We examined the height–time cross-section of geopotential anomalies in the polar cap (Fig. 6a). The geopotential height anomalies were negative in mid-to-late December 2015 and corresponded to a positive phase of the Arctic Oscillation (Fig. 6b) and an enhanced polar vortex, both of which led to less cold air outbreaks in the Northern Hemisphere (Thompson and Wallace 1998). The large-scale circulation regime in the Arctic region shifted on 30 December, when a sudden Arctic warming occurred, and the geopotential height rapidly changed to positive anomalies over the Arctic region (Fig. 6a). The Arctic Oscillation index shifted to a negative phase on 30 December (Fig. 6b). This is also consistent with a previous study (Wang et al. 2017) and supports the interpretation that the abrupt shift to the negative phase of the Arctic Oscillation is closely linked to the Arctic warming.
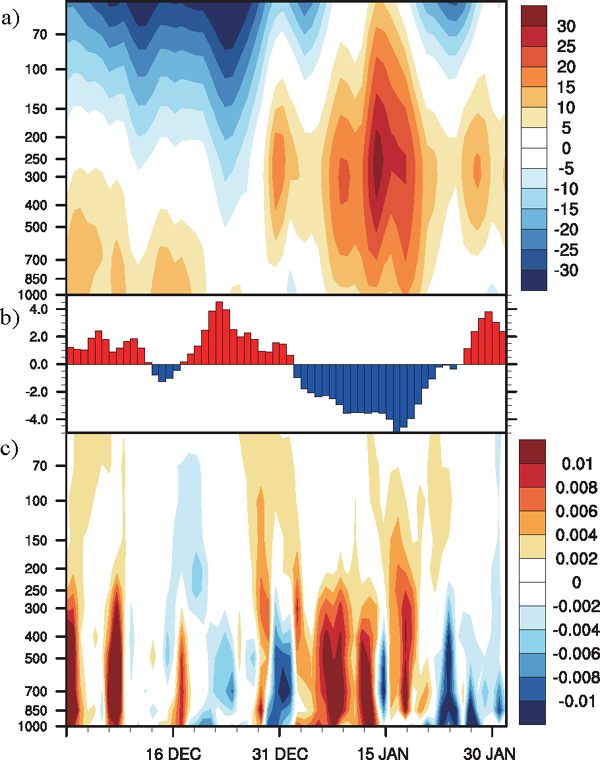
(a) Time–height cross-section of the polar cap (north of 65°N) geopotential anomalies (unit: 102 m2 s−2) from 1 December 2015 to 1 February 2016. (b) Arctic Oscillation index from 1 December 2015 to 1 February 2016 (from the NOAA Climate Prediction Center). (c) Same as (a) but for the vertical velocity (unit: Pa s−1) anomalies. The climatological mean period is defi ned as 1981–2010.
Figure 6c shows the anomalous upward motion in the polar cap region in mid-and-late December 2015, confirming the presence of an enhanced polar vortex. When the storm entered the Arctic Circle, the anomalous motion in the mid-and-lower troposphere was still shifting upward as a result of the strong advection of the storm's updraft. A warm low pressure, thus, dominated the mid-and-lower troposphere in the Arctic region at this stage, driving the extensive Arctic warming. The positive geopotential height anomalies increased rapidly over the polar cap, and the anomalous downward motion prevailed over the Arctic. At this time, a warm high pressure developed and controlled the Arctic region.
We examined the change in large-scale atmospheric circulation in the northern mid-and-high latitudes before and after the Arctic warming (Fig. 7). In December 2015, the large-scale circulation regime in the Northern Hemisphere resembled the positive phase of the Arctic Oscillation; moreover, ridging and troughing over mid-latitudes were generally suppressed (Fig. 7a). These features did not favor the outbreaks of cold surges over the northern mid-latitudes. Atmospheric warming due to increased heat transport from the North Atlantic elevated the geopotential height in the mid-troposphere in January 2016 (Fig. 7b) favored the splitting of the tropospheric polar vortex into two major centers. One center shifted to the East Asian– North Pacific sector (43–70°N, 115°E–150°W), whereas the other was located over the Baffin Island–Greenland sector (45–77°N, 40–95°W) and decayed rapidly because of the transport of warm air masses from the North Atlantic. Hence, the concentric ring pattern in the high-latitude Arctic stretched into a dipole shape in January 2016, resembling the pattern related to the negative phase of the Arctic Oscillation. Consequently, warming occurred in the Arctic region, whereas cooling was seen in East Asia.
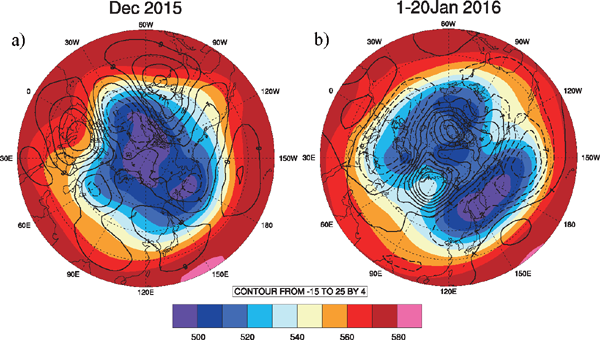
Distribution of the geopotential (shading) and its anomalies (contours) (unit: 102 m2 s−2) at 500 hPa in (a) December 2015 and (b) 1–20 January 2016.
As one of the split polar vortexes moved southward to East Asia, an inverted omega-shaped circulation pattern (IOCP) dominated the Siberia–North Pacific sector, with cold polar air dipping deep southward, and flanked by the invading warm air into the polar region on either side (Fig. 8), hence, inducing the outbreak of cold Arctic air in East Asia (Ding 1994). Notably, the other split polar vortex moved southward to the Europe–North Atlantic sector, and a distinct low pressure was situated in West Europe (Fig. 8a) before the outbreak of the East Asian cold wave. The Rossby wave flux was emitted from the front of the low-pressure over West Europe and absorbed into the Urals region on 20 January, thus contributing to the formation of the Ural blocking high (Figs. 8b–e). Previous studies also suggested that the blocking high in the troposphere of the Eurasian continent is mainly related to an incoming Rossby wave train from Europe (Enomoto et al. 2003; Nakamura and Fukamachi 2004). Similarly, the low pressure in the Siberia–North Pacific sector contributed to another downstream blocking over western North America due to the injection of Rossby wave energy from the upstream region (Figs. 8a–d). Therefore, the two blocking highs over the Urals region and western North America, together with the low pressure between them, eventually resulted in the occurrence of the observed IOCP over the Siberia–North Pacific region, extending from high to middle latitudes.
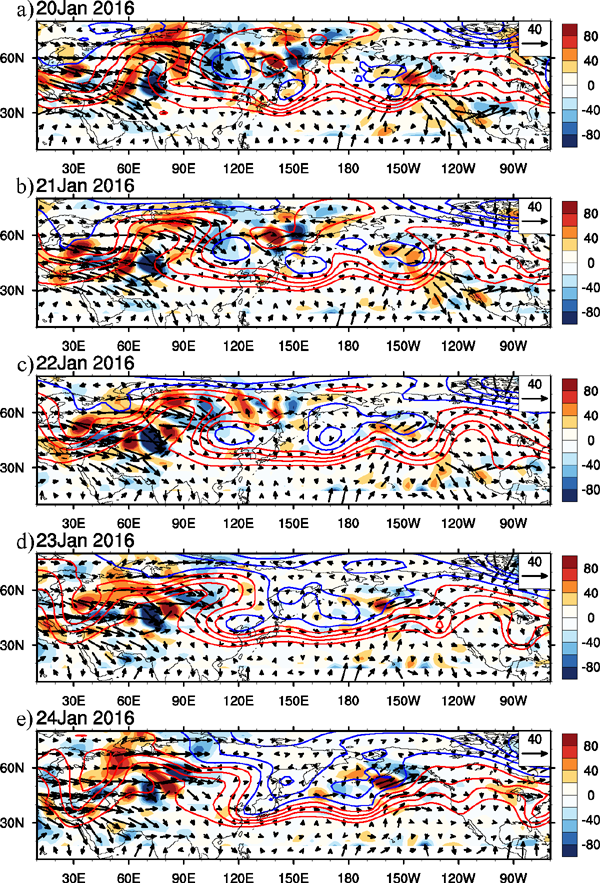
Distribution of geopotential (contour; unit: m2 s−2), wave-activity flux (vector; unit: m2 s−2) and its divergence (shading; unit: 10−6 m s−2) at 500 hPa from 20 to 24 January 2016. The contours for the geopotential are in intervals of 1,000 m2 s−2 between 48,000 m2 s−2 and 55,000 m2 s−2.
Several closed lows formed in the IOCP, the furthest west of which was over Lake Baikal (45–77°N, 95–105°E). The East Asian trough, with the east–west oriented trough line, developed at the back of Lake Baikal and extended to Lake Balkhash on 20 January (Fig. 8a). As the IOCP moved southeastward, the East Asian trough meridionally extended, and the cold wave occurred (Figs. 8b–e). The IOCP broke up on 25 January, and the East Asian trough moved out of East Asia.
The high IPV cold air mass was concentrated in the IOCP, whereas a low IPV air mass prevailed outside the IOCP (Fig. 9a) where an anticyclonic or blocking circulation dominated (Hoskins et al. 1985). The air of IPVs with values of > 5 PVU was mainly concentrated in Siberia, in particular, the region of the East Asian trough, a key region affecting the East Asian climate in winter (Ding and Krishnamurti 1987; Ding 1990). As the East Asian trough moved southeastward and meridionally extended over Lake Baikal, there was an outburst of high IPV cold air, and the cold wave swept through East Asia from 21 to 24 January (Figs. 9b–f).
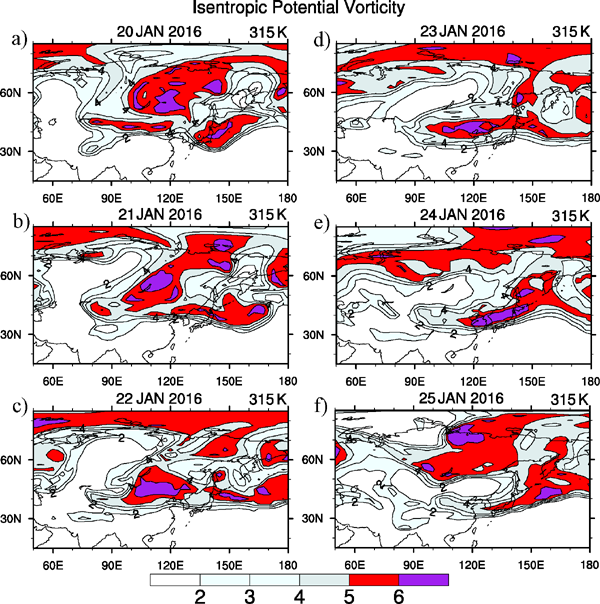
Distribution of potential vorticity (unit: PVU) at the 315 K isentropic surface during 20–25 January 2016.
We also examined the vertical structure evolution of the IOCP (Fig. 10). Figure 10a shows that the high–PV airflow moved southward and down along the isentropic surface from the Arctic region toward East Asia and assembled in the folding area along 30–40°N on 21 January. To the north of the folding region (45–65°N, 800–300 hPa), the low–PV enhanced, and eventually an IOCP formed in East Asia with a high PV centered in mid-and-high latitudes, and low PV centered on either side in the Siberia–Ural regions. A westerly jet stream emerged to the south, with its core wind speed reaching 70 m s−1. Accompanying the southward movement of the IOCP, the high–PV airflow moved downward along the isentropic surface, causing the horizontal contraction of the high-PV column, and increasing its cyclonic vorticity. The jet stream to the south of the folding area stretched vertically accordingly (Fig. 10b). The IOCP achieved maximum strength on 23–24 January 2016 (Figs. 10c, d). It was also noteworthy that the IOCP modulated the meridional circulation cell along the East Asia–Siberia regions. When the IOCP moved southward, the geopotential height decreased above East Asia but increased above Siberia, and in 21–22 January induced a clockwise cell along East Asia, with an ascending branch over low latitudes and descending branch over Siberia (Figs. 10e, f). The descending motion brought negative vorticity and anticyclonic advection to the Siberian region and thus intensified the Siberian high, which contributed to the southward outbreak of cold waves. Additionally, the meridional cell-induced northerly wind over East Asia in the lower troposphere favored the southward incursion of the cold wave. The cell moved southward and weakened after 23 January (Figs. 10g, h).
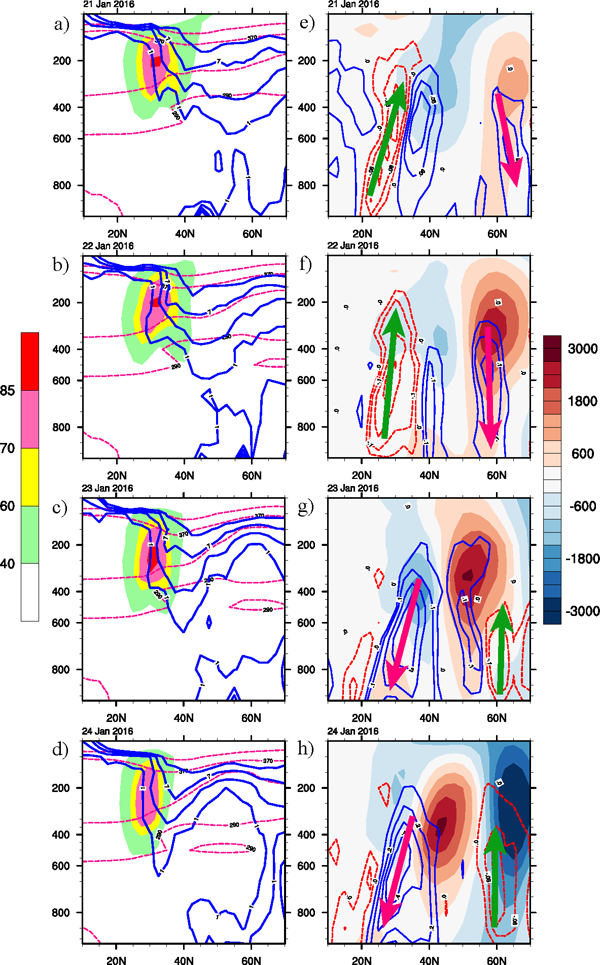
(a–d) Height–latitude cross-section of potential temperature (dashed pink lines; unit: K), potential vorticity (solid blue lines; unit: PVU) and jet (shading, unit: m s−1) averaged along 110–120°E from 21 to 24 January 2016. (e–h) Same as (a–e) but for the geopotential change (shading, unit: m2 s−2) (current day minus preceding day) and vertical velocity (lines; Pa s−1). The solid green (pink) arrow stands for locations of the ascending (descending) motion centers.
Figure 11a shows the daily variations in the SAT anomaly averaged over East Asia for January 2016, and a dramatic phase reversal from high to low SAT was evident around 17 January. When the cold wave occurred, the SAT in East Asia suddenly decreased on 20 January and reached a minimum of 7.5°C lower than average on 24 January. The distribution of SAT anomalies (Fig. 11b) showed that the severe cold wave affected almost all of East Asia, and an SAT 4°C lower than average covered most regions. The severe cold wave brought not only strong cooling but also snowfall to East Asia (Fig. 11c), particularly in eastern and northern China, most parts of Japan, and the southern Korean Peninsula.
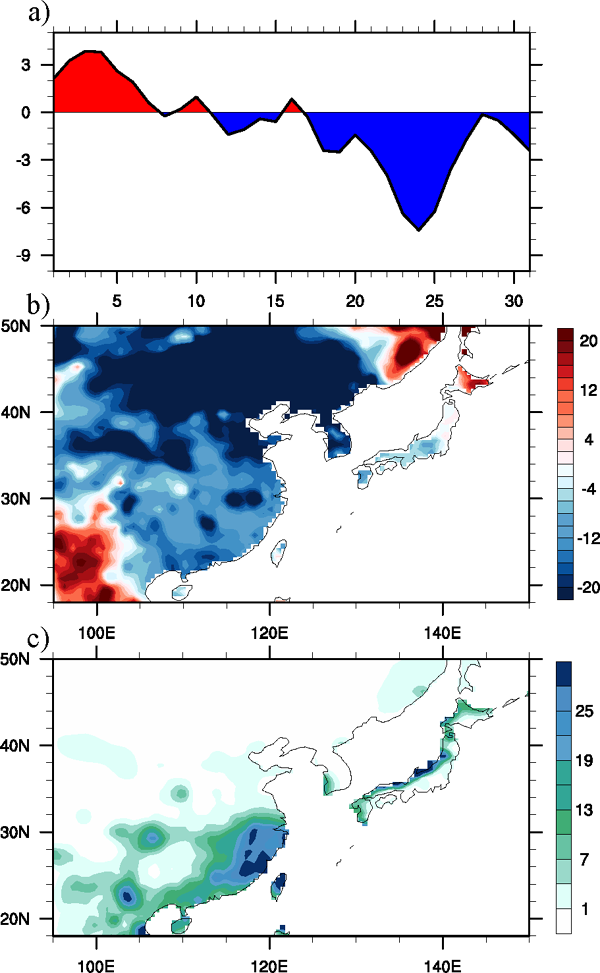
(a) Daily variation of the observed surface air temperature anomaly (unit: °C) in East Asia (22–45°N, 105–145°E) in January 2016. (b) Observed surface air temperature anomaly (unit: °C) in East Asia over 21–24 January 2016. (c) Sum of the observed precipitation in East Asia over 21–24 January 2016 (unit: mm).
This research characterized a low-frequency, developing process consisting of three distinct extreme events occurring in succession from late 2015 to early 2016: The first event was a severe windstorm in the North Atlantic, the second was an explosive warming in the Arctic region along with a deep northward intrusion of warm air advection, and the third was a record-breaking cold wave over East Asia.
Two characteristics of this downstream development chain of the extreme events were extraordinary. First, the successive occurrences of the three events were unprecedented. Storm Frank was one of the top five strongest storms on record in the North Atlantic, with a minimum pressure of 928 hPa. Explosive Arctic warming led to a sudden rise in SAT close to the freezing point at the North Pole, and subsequently, the extreme cold wave that swept through most parts of East Asia, leading to record-breaking low temperatures and widespread snowstorms in several regions. Second, the results showed that these three distinct extreme events did not occur independently but were physically linked. Figure 12 shows the proposed mechanisms for the influence of the severe Atlantic storm on the unusual Arctic heatwave and the unprecedented East Asian cold wave. Storm Frank emerged near the east coast of North America, crossed the North Atlantic before recurving northward, was steered by a strong meridional southerly jet west of a strongly developed blocking high in Europe, and finally entered the Arctic Circle. The extended jet stream transported a large amount of warm and moist air masses to the Arctic, as a strong WCB, and led to a distinct Arctic warming event. This resulted in a rapid transition toward the negative phase of the Arctic Oscillation mode, characterized by a dipole pattern that induced the downstream dispersion of Rossby wave energy along the mid-latitudes of the Northern Hemisphere. Two blocking highs over the Urals region and western North America were thus created and eventually resulted in the establishment of an IOCP over the East Asia–North Pacific regions. The IOCP in the Asian region led to the outbreak of cold waves originating from the Arctic over East Asia. This successive development chain of downstream events clearly showed a hemispheric-scale, teleconnection linkage for the occurrence of cold waves in East Asia.
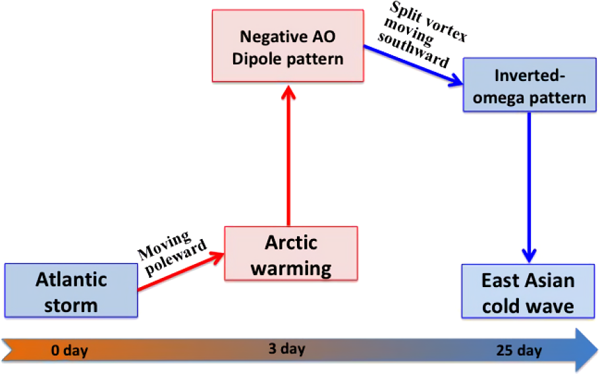
Schematic diagram of the influence of the severe Atlantic storm on explosive Arctic warming and the unprecedented East Asian cold wave. AO, Arctic Oscillation.
Our analysis indicate that the formation of Storm Frank was caused by tropopause folding, which transported a high IPV air mass from the stratosphere in the Arctic region to the troposphere in the mid-latitude North Atlantic. The tropopause folding was attributed to the stretching of the polar vortex in the stratosphere in late December 2015. As the high PV air moved southward, the stratospheric air with a high PV moved down along the isentropes from the lower stratosphere to the troposphere before forming and enhancing the North Atlantic storm and downstream development of a blocking high in Europe.
Warm advection was the primary mechanism behind the explosive Arctic warming, and it can be partitioned into DSE and LE components. The warm advection was caused by the strong southerly jet formed between the North Atlantic storm and its downstream blocking high in Europe. The southerly jet stream, as a WCB, transported enormous warm and moist air masses from mid-latitudes to the Arctic and led to an extraordinary Arctic warming event.
We suggest that the following underlying mechanisms drive the transition of the negative phase of the Arctic Oscillation. Atmospheric warming from the transport of heat from the North Atlantic favored the splitting of the tropospheric polar vortex into two major centers (i.e., dipole pattern), as was observed early in January 2016, eventually, driving a negative phase transition of the Arctic Oscillation. As the dipole pattern formed in the Arctic region, an IOCP controlled East Asia and a transversely oriented trough developed at the back of the IOCP. This induced the outbreak of the Arctic high PV cold air toward East Asia as soon as the IOCP moved southeastward.
This study emphasizes the importance of lowfrequency processes and their associated synoptic events in subseasonal prediction. Our case analysis illustrated that these low-frequency processes can also alter the downstream large-scale atmospheric circulations by regulating the Arctic circulation patterns such as the Arctic Oscillation. Previous studies have suggested that the warming trend in the Arctic region was higher than the global average during recent decades, which is known as Arctic amplification. The Arctic amplification plays an important role in the change of the Arctic circulation pattern to the negative phase of the Arctic Oscillation in winter (Nakamura et al. 2015). The negative phase of the Arctic Oscillation favors the tropopause folding over the mid-andhigh latitudes in the Northern Hemisphere. Hence, the Arctic amplification will increase the frequency of the tropopause folding and IOCP over East Asia under global warming, which favors the outbreak of cold waves over East Asia.
The authors would like to thank the editor and two anonymous reviewers, whose critical and constructive comments significantly improved this paper. The ERA–Interim reanalysis dataset was obtained from the European Centre for Medium–Range Weather Forecasts (ECMWF) (https://apps.ecmwf.int/datasets/data/interim-full-daily/levtype=sfc/). The precipitation and surface air temperature dataset and AO index were obtained from the National Oceanic and Atmospheric Administration (NOAA) Climate Prediction Center (CPC) (https://www.cpc.ncep.noaa.gov/products/MD_index.php). The NCL script for calculating the waveactivity flux was provided by Prof. Kazuaki Nishii from his website at https://www.atmos.rcast.u-tokyo.ac.jp/nishii/programs/index.html. This research is jointly supported by the National Natural Science Foundation of China (Grant 41790471, 41991284, and 41875104) and the Strategic Priority Research Program of the Chinese Academy of Sciences (Grant XDA20100304).