Originals
Effort-reward Imbalance and Low Back Pain among Eldercare Workers in Nursing Homes: A Cross-sectional Study in Kagawa Prefecture, Japan
2014 年 56 巻 3 号 p. 197-204

詳細
2014 年 56 巻 3 号 p. 197-204
Objectives: To clarify effort-reward imbalance among eldercare workers in nursing homes and to examine the association between the effort-reward imbalance (ERI) and low back pain (LBP) among them. Methods: A total of 549 questionnaires were distributed to a random sample comprising 23% of the 79 special elderly nursing homes in Kagawa in 2013. A total of 467 eldercare workers (response rate 85%) participated in this study. Of the 467 eligible respondents, 372 (80%) completed all items of the ERI questionnaire. Complete data were available for 342 (73%) eldercare workers. Results: Of the 342 respondents, 215 (63%) had LBP at the time of the study, and 291 (85%) showed a critical “high cost/low gain” condition as determined by an effort-reward ratio >1. Multiple logistic regression analyses adjusted for age, gender, previous LBP experience, high-risk work and K6 score showed that eldercare workers with a high ERI had a higher risk for LBP than workers with a low ERI (OR, 1.96; 95% CI, 1.02–3.77). Conclusions: Most eldercare workers have a high ERI, and their LBP is associated with their ERI. Balancing effort and reward may be an important factor for improving LBP among eldercare workers in nursing homes.
(J Occup Health 2014; 56: 197-204)
Low back pain (LBP) represents a major global burden and the top cause in the years lived with disability1). In Japan, workers' compensation claims for LBP among eldercare workers in nursing homes has increased more than twofold over the past decade, while LBP among many other occupational groups has decreased2). Given that the population is rapidly aging in Japan as well as in other highly developed countries, a detailed and comprehensive understanding of LBP among eldercare workers is important. Existing literature indicates that the risk factors of LBP among hospital workers include not only physical work load, including person transfer, but also work stress3–6). The study subjects, however, were not eldercare workers in nursing homes, and the work stress experienced by eldercare workers is poorly understood.
There are two models to explain work stress that have been validated in many empirical studies, translated in various languages and widely used in the world. One of them is the job demand-control model7), and the other is the effort-reward imbalance model8). In contrast to the job demand-control model, which emphasizes task-level control, the effort-reward imbalance model emphasizes the rewards given to employees. Human service work can be quite rewarding, for instance, when patients recover or cheer up because of the professional's efforts. However, the relationship between caregivers and care recipients may also be stressful, for instance, when difficult and demanding recipients are not appreciative of a caregiver's efforts. Considering that human service work involves such broad contexts beyond the scope of task-level control, the effort-reward imbalance (ERI) stress model is valid for demonstrating a stressful work environment among health-care populations. Previous studies showed that depression, sick leave and burnout were strongly related to effort-reward imbalance in workplaces9–11). As well as increasing workers' compensation claims because of LBP among eldercare workers in nursing homes, the high attrition rate in eldercare workers (about 20%) is a serious problem12). Thus, it is important to understand the ERI among eldercare workers for better policymaking to resolve these problems. To our knowledge, there are no studies available on the ERI among eldercare workers in nursing homes.
The primary aims of this study were to clarify the ERI among eldercare workers in nursing homes and to examine the association between the ERI and LBP among them. An additional aim was to understand exactly how eldercare workers think about their LBP and what they need. This is also poorly understood but important for a detailed and comprehensive understanding of LBP among eldercare workers.
Figure 1 presents the flow of nursing homes and participants through the study. There were 79 special elderly nursing homes in Kagawa Prefecture, listed in the official web-based national dataset in August 201313). We used cluster sampling and selected 20 facilities on the basis of a computer-generated random number sequence. We asked the 20 nursing home directors on the telephone to assign their eldercare staffs to respond to anonymous self-administered questionnaires. Of the 20 directors, 2 declined to participate in this study. We thereafter distributed 549 questionnaires to eldercare workers in 18 nursing homes during our first visit. We retrieved 471 questionnaires during our second visit after a month (response rate, 86%). In this study, certified care workers and care helpers were defined as eldercare workers. Of the 471 respondents, 4 registered nurses were excluded from further analyses. Of the 467 eligible respondents, 372 (80%) answered all 17 items of the ERI questionnaire. After taking item nonresponse into account with list-wise deletion of missing data, the total number of analyzed respondents was 342 (73%). The mean age and proportion of female gender were higher in the participants who were excluded from the analyses because of missing data than in the analyzed participants.
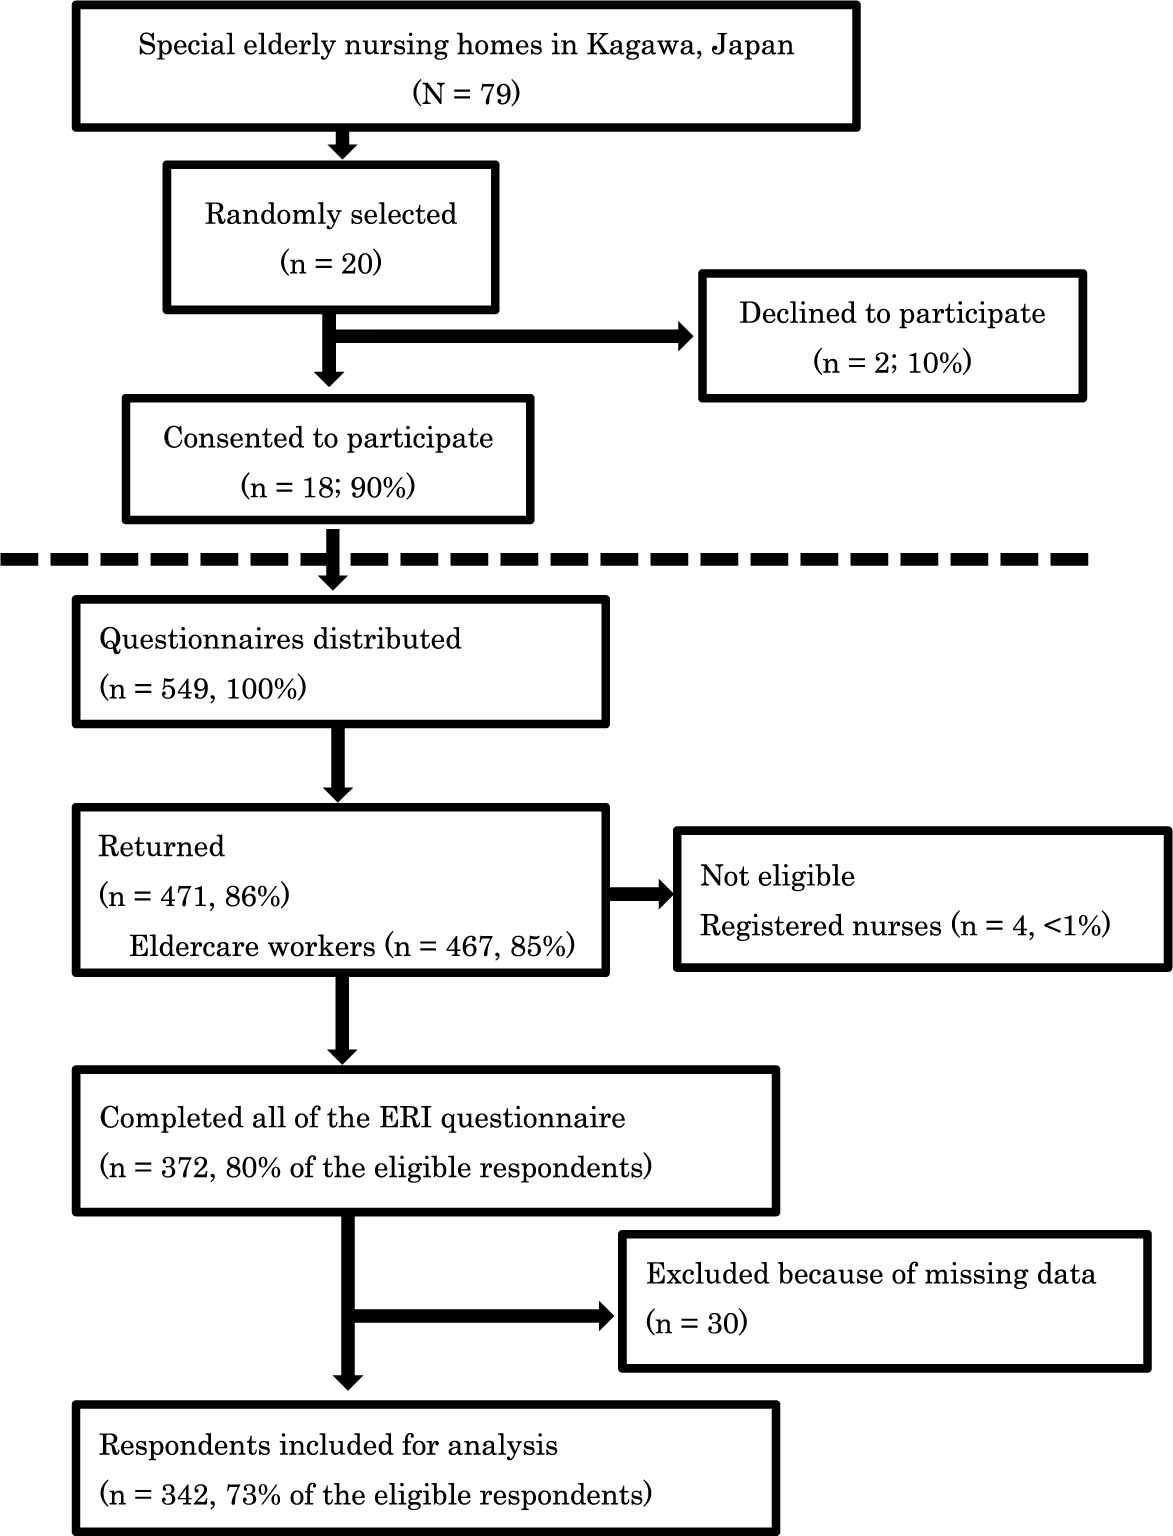
Study flow diagram detailing the selection of nursing homes and participants. ERI: effort-reward imbalance.
The Ethics Committees of the Kagawa University Faculty of Medicine and Kagawa Council of Senior Citizens Welfare Service approved this study protocol. We distributed written information explaining the aims of the study and inviting the workers to respond on a voluntary basis with each questionnaire. Respondents were informed that return of the questionnaire was considered to imply consent. If eldercare staff refused to complete the questionnaire, they were not obliged to complete the questionnaire. Respondent confidentiality was protected at all times.
Measurements 1) Demographic variablesWe collected the participant's age, gender, length of service, employment status (regular or non-regular), license (certified care worker or care helper), annual income, working hours per week, frequency of high-risk work (overnight shifts, transferring residents, changing diapers, assistance with bathing) and smoking status. Age, female gender and smoking are reported as risk factors for LBP among hospital staff3). Women are also reported to have higher ERI scores than men. These variables are likely associated with the outcome measures.
2) Low back painLBP was defined as back pain localized between the lower costal margins and the inferior gluteal folds, and a diagram of the LBP area was provided within the questionnaire. We measured the point prevalence of LBP by the following question in the questionnaire: “Do you have low back pain (which means pain on the illustrated area) now?” We chose the pain at present as the main variable for this study in order to avoid recall bias. The response categories were “Yes” and “No”. If participants responded “Yes”, we also measured the intensity of LBP (a numerical rating scale, with zero indicating no pain at all and 10 indicating the worst possible pain), history of disabling LBP and work absence and triggering factors. We also asked what participants thought important to reduce or prevent LBP among eldercare workers. Regardless of the response to the above question, we measured previous LBP experience. Previous LBP experience is reportedly a risk factor for LBP among Japanese workers4).
3) Effort-reward imbalanceThe effort-reward imbalance was assessed by the Japanese version of the effort-reward imbalance questionnaire. The ERI model is a theoretical concept proposed by Siegrist that assesses adverse health effects of stressful experience at work8). This model defines stressful experience at work as an imbalance between high effort expended and low reward received. The ERI questionnaire contains 17 items, which consist of two components, “effort” (6 items) and “reward” (11 items). Responses to the items for “effort” and “reward” are scored on a 5-point Likert scale (1=no stressful experience, 5=very high stressful experience). “Effort” is assessed by measuring the intensity of distress produced by time pressure, high levels of responsibility, overtime and increasing demands. “Reward” consists of three factors: esteem, occupational social status control and financial compensation assessed by measuring lack of esteem by colleagues and superiors, poor promotion prospects, job insecurity, occupational changes and insufficiencies of salary and career rewards. If all 17 items are answered, according to the theoretical formulation, a ratio between the two scales of effort and reward (weighted by item number) is calculated to assess the degree of imbalance between high cost and low gain. Siegrist recommended fixation of cutoff values on the basis of theoretical and mathematical considerations as follows: an effort-reward ratio >1.0 indicates the critical “high cost/low gain” condition (i.e., high-risk for work stress). The Japanese version of the ERI questionnaire was developed by using an independent back-translation procedure and has been evaluated for its reliability and validity in several Japanese surveys14, 15).
4) K6 scaleThe K6 scale is a short screening scale for psychological distress developed by Kessler et al.16), and it has been used in many studies. Psychological distress or depression was reported to be strongly related not only to ERI but also to LBP14, 17). Thus, we included the K6 scale in our questionnaires, considering that depression would be an important potential confounder for examining the association between the ERI and LBP. The K6 scale has six items that ask about frequently experienced symptoms of psychological distress (e.g., feeling so sad that nothing can cheer you up) during the past 30 days. Participants were asked to respond to statements on a five-point Likert scale (“all of the time”, “most of the time”, “some of the time”, “a little of the time” and “none of the time”). Scores range from 0 to 24, with higher scores indicating greater psychological distress. The Japanese version of the K6 scale was developed in accordance with the WHO translation guidelines by experts in psychiatric interviewing and/or psychiatric epidemiology. The K6 scale has been evaluated for its reliability and validity in community surveys in Japan18). A cutoff point of 9/10 has been used in the Japanese population to screen for mood or anxiety disorders19), which is what we used in this study.
Statistical analysisAll variables were collected from anonymous self-administered questionnaires. Demographic variables were analyzed descriptively and compared with the t-test or Pearson's chi-square test, as appropriate. The associations between the variables and LBP or ERI were also determined using the t-test and chi-square test. Multiple logistic regression analyses were performed to examine the independent association of ERI with LBP. We adjusted for possible confounders i.e., age, gender, previous LBP experience, high-risk work and K6 score. The results are shown as odds ratios (OR) with 95% confidence intervals (CI). All p values are two-sided. The threshold of 0.05 was used to determine statistical significance. The statistical analyses were performed with JMP, version 10.0 (SAS Institute Inc.).
Table 1 shows characteristics of the study population and a comparison of the characteristics between respondents with LBP and respondents without LBP. Workers with LBP were, on average, 3.1 years older (p=0.025) and were 1.6 years senior at work (p=0.01). Workers with LBP were also more likely to have previous LBP experiences before landing their eldercare jobs (p=0.005). Furthermore, workers with LBP answered that they had more frequent transferring residents and changing diapers (p=0.005, p=0.009, respectively). Considering that patients with chronic pain have a propensity for exaggeration, such differences were small in magnitude20).
| Characteristic | All | LBP | No LBP | p valuea |
|---|---|---|---|---|
| (n=342) | (n=215) | (n =127) | ||
| Age, mean (SD), yr | 38.2 (12.3) | 39.4 (12.2) | 36.3 (12.2) | 0.025 |
| Female, No. (%) | 297 (65) | 137 (64) | 72 (57) | 0.2 |
| Length of service, mean (SD), yr | 8.0 (5.4) | 8.6 (5.3) | 7.0 (5.3) | 0.01 |
| Employment status, No. (%) | ||||
| Regular | 273 (80) | 175 (81) | 98 (77) | 0.33 |
| Non-regular | 69 (20) | 40 (19) | 29 (23) | |
| License, No. (%) | ||||
| Certified care worker | 276 (81) | 175 (81) | 101 (80) | 0.94 |
| Care helper | 66 (19) | 40 (19) | 26 (20) | |
| Annual income, No. (%), Japanese Yen | ||||
| <2,000,000 | 90 (26) | 56 (26) | 34 (27) | |
| 2,000,000–3,000,000 | 118 (35) | 71 (33) | 47 (37) | 0.78 |
| 3,000,000–4,000,000 | 124 (36) | 82 (38) | 42 (33) | |
| >4,000,000 | 10 (3) | 6 (3) | 4 (3) | |
| Workweek, No. (%), hours | ||||
| <40 | 77 (23) | 48 (22) | 29 (23) | 0.92 |
| 40–60 | 250 (73) | 157 (73) | 93 (73) | |
| >60 | 15 (4) | 10 (5) | 5 (4) | |
| Smoking, No. (%) | 108 (32) | 70 (32) | 38 (30) | 0.7 |
| Previous LBP experience, No. (%) | 107 (31) | 79 (37) | 28 (22) | 0.005 |
| High-risk work, mean (SD) | ||||
| Transferring residents, per day | 15.0 (13.0) | 16.6 (13.9) | 12.4 (10.8) | 0.005 |
| Changing diapers, per day | 9.0 (7.5) | 9.8 (8.1) | 7.5 (6.2) | 0.009 |
| Assistance with bathing, per week | 3.9 (6.0) | 3.8 (5.2) | 4.0 (7.1) | 0.78 |
| Overnight shifts, per month | 4.0 (2.2) | 4.1 (2.3) | 3.8 (2.1) | 0.36 |
| K6 scale (0–24), mean (SD) | 15.2 (6.2) | 16.3 (6.3) | 13.4 (5.8) | <0.001 |
| High mental distress (K6=10), No. (%) | 153 (45) | 110 (51) | 43 (34) | 0.002 |
| ERI scores, mean (SD) | ||||
| Effort | 18.3 (5.6) | 19.7 (5.4) | 16.0 (5.2) | <0.001 |
| Reward | 25.8 (9.6) | 27.5 (9.8) | 22.9 (8.5) | <0.001 |
| Financial | 10.2 (3.8) | 10.7 (4.0) | 9.3 (3.5) | 0.001 |
| Esteem | 11.2 (4.7) | 12.0 (4.7) | 9.8 (4.4) | <0.001 |
| Social status control | 4.4 (2.1) | 4.8 (2.3) | 3.8 (1.7) | <0.001 |
| Effort-reward ratio, mean (SD) | 1.38 (0.41) | 1.40 (0.41) | 1.36 (0.42) | 0.45 |
| High work stress (ER ratio>1), No. (%) | 291 (85) | 190 (88) | 101 (80) | 0.027 |
SD: standard deviation. LBP: low back pain. ERI: effort-reward imbalance.
In addition, of the 342 respondents, 153 (43%) had great mental distress as determined by a K6 score of 10 or more. Workers with LBP were more likely to have great mental distress than those without LBP (p=0.002).
A total of 291 (85%) respondents showed the critical “high cost/low gain” condition as determined by an effort-reward ratio >1. The mean value of the effort-reward ratio was 1.38 (SD, 0.41). Workers with LBP had not only higher effort scores but also higher reward scores (p<0.001). Reward scores consist of three domains, i.e., financial reward, esteem reward and occupational social status control reward. Workers with LBP also reported higher reward scores in all three domains. In view of the prevalence of a high effort-reward ratio, workers with LBP were more likely to have a large amount of work stress than those without LBP (p=0.027). A significantly larger number of women had a large amount of work stress than men (p=0.045; not shown).
Table 2 shows the histories and perceptions of respondents with LBP. Of the 342 respondents, 215 (63%) had LBP at the time of the study, and their mean intensity was 4.7 (standard deviation [SD], 1.9) on the numerical rating scale. Of the 215 respondents with LBP, 140 (65%) had experienced disabling LBP, and 32 (15%) had taken sick leave due to disability. The majority of them referred to transferring residents, changing diapers and overnight shifts as the triggering factors of LBP. In addition, the majority of workers with LBP also referred to increasing the number of staff per resident and improving salaries and benefits as the important factors to lessen or prevent LBP among eldercare workers.
| Histories and perceptions of respondents with LBP (n=215) | |
|---|---|
| Intensity of LBP, mean (SD), NRS | 4.7 (1.9) |
| History of disabling LBP, No. (%) | |
| No disability | 75 (35) |
| Disability without absence | 108 (50) |
| Disability with absence for <4 days | 13 (6) |
| Disability with absence for ≥4 days | 19 (9) |
| Triggering factors at workplace, No. (%) | |
| Transferring residents | 131 (61) |
| Changing diapers | 139 (65) |
| Assistance with bathing | 72 (33) |
| Overnight shifts | 118 (55) |
| Increase of stress or fatigue | 102 (47) |
| Always, with no relation to work | 32 (15) |
| Important factors to reduce LBP, No. (%) | |
| Increasing the number of staff | 175 (81) |
| Increasing the number of devices | 99 (46) |
| Improving salaries and benefits | 131 (61) |
| Construction of a mental support system | 83 (39) |
NRS: numerical rating scale.
Table 3 shows the results of logistic regression analyses on the association of ERI with LBP after adjustment for age, gender, previous LBP experience, high-risk work and K6 score. There were significant associations of effort-reward ratio >1 (OR, 1.96; 95% CI, 1.02–3.77), previous LBP experience (OR 2.12; 95%CI 1.24–3.72), transferring residents ≥20 times per day (OR 2.15; 95%CI 1.02–4.56) and K6 score ≥10 (OR 2.27; 95% CI 1.40–3.75). Age, gender and other high-risk work (changing diapers, assistance with bathing, overnight shifts) were not significantly associated with LBP.
| Variables (n=342) | Odds ratio (95% CI) | p valuea |
|---|---|---|
| Age (year) | ||
| <30 | 1 | |
| 30–39 | 1.19 (0.64–2.23) | 0.58 |
| 40–49 | 1.15 (0.58–2.29) | 0.69 |
| ≥50 | 1.57 (0.76–3.29) | 0.22 |
| Gender | ||
| Male | 1 | |
| Female | 1.26 (0.76–2.09) | 0.38 |
| Previous LBP | ||
| No | 1 | |
| Yes | 2.12 (1.24–3.72) | 0.006 |
| High-risk workb | ||
| Transferring residents, per day | ||
| <6 | 1 | |
| 6–19 | 1.61 (0.83–3.12) | 0.16 |
| ≥20 | 2.15 (1.02–4.56) | 0.04 |
| Changing diapers, per day | ||
| <3 | 1 | |
| 3–11 | 1.44 (0.72–2.86) | 0.30 |
| ≥12 | 1.24 (0.53–2.88) | 0.62 |
| Assistance with bathing, per week | ||
| <2 | 1 | |
| 2–3 | 1.07 (0.57–2.02) | 0.83 |
| ≥4 | 0.85 (0.41–1.73) | 0.65 |
| Overnight shifts, per month | ||
| <3 | 1 | |
| 3–4 | 0.61 (0.2–1.24) | 0.17 |
| ≥5 | 0.89 (0.44–1.78) | 0.75 |
| K6 score<10 | 1 | |
| K6 score≥10 | 2.27 (1.40–3.75) | <0.001 |
| Effort-reward ratio≤1 | 1 | |
| Effort-reward ratio>1 | 1.96 (1.02–3.77) | 0.04 |
CI: confidence interval. Models adjusted for age, gender, previous LBP experience, high-risk work and K6 score. Age, length of service, previous LBP experience, high-risk work and K6 score were significantly different between workers with LBP and workers without LBP. We did not adjust for length of service because of a clear correlation with age. Gender was significantly different between workers with high ERI and workers with low ERI. a The p values were based on the Wald chi-squared test. p values in bold are statistically significant. b High-risk work was stratified into trichotomous variables using the lower quartile point and the upper quartile point of the sample.
To our knowledge, this is the first study to clarify effort-reward imbalance among eldercare workers in nursing homes. The effort-reward ratio (mean 1.38) was revealed to be much higher than the ratios of hospital nurses in previous studies (mean 0.7–1.0)21–23). Most respondents (85%) had a large amount of work stress, and the majority (63%) of respondents suffered from low back pain at the time of the study. Consistent with the previous findings, we also found that ERI, as well as psychological distress and previous LBP experience, was independently associated with low back pain even among eldercare workers4, 17, 24, 25). These findings indicate that most eldercare workers in nursing homes have many stressful experiences at work and that such experiences are important risks of low back pain. Improving the occupational environment in nursing homes could reduce the risk of low back pain and sick leaves among eldercare workers.
The average annual income among eldercare workers in nursing homes was 3,100,000 Japanese Yen, while the average annual income among registered nurses was 4,710,000 Japanese Yen in 201226). In this study, the majority of eldercare workers had annual incomes lower than 3 million Japanese Yen, which are generally classified as low incomes in Japan. Thus, it was not surprising that the majority referred to improving salaries and benefits as the important factors to lessen or prevent LBP among eldercare workers.
However, only 39% of respondents with LBP referred to a mental support system as an important factor to reduce LBP, while the majority of them had mental distress as determined by a K6 score of 10 or more. Only a small proportion of eldercare workers might know that LBP is associated with mental distress. In addition, our study revealed that more than one-third of the workers also had mental distress in spite of the absence of LBP. The results indicate that increasing awareness of mental distress and availability of adequate mental support for eldercare staff might be needed in nursing homes.
The government revised the guidelines for prevention of LBP in the workplace in June 201327). The guidelines recommend active use of mechanical patient lifts as a key way of preventing LBP among eldercare workers. Several recent studies have suggested that mechanical patient lifts can help reduce low-back injury rates28–30). These results are consistent with our own, which shows that frequent person transfer had the highest odds ratio for high-risk work and that person transfer ≥20 times per day was significantly associated with LBP. However, in our study, the current realistic perception among eldercare workers in nursing homes was that it was more important to expand the staffs than the devices.
There are some limitations of this study that need to be considered. First, the study used a cross-sectional design; therefore, we cannot derive any conclusions on the causality of the observed association between the effort-reward imbalance and low back pain. Second, we were unable to perform nonresponse analysis because of a lack of data about nonrespondents. Compared with the analyzed respondents, the respondents who were excluded because of missing data were older and included more females. For this reason, selection bias resulting from nonresponse and missing data cannot be excluded. Third, recall bias may have been present because respondents' experiences of previous low back pain were assessed in the questionnaire. Respondents with LBP may recall or perceive their exposure to risk factors more acutely than those without LBP, leading to an overestimation of their risk. Fourth, this study was designed with randomized cluster sampling in only Kagawa Prefecture, not throughout all of Japan. Therefore, the findings of this study cannot be generalized to other eldercare settings without caution.
Despite these limitations, this study provides useful information for better understanding of eldercare workers' work stress and low back pain. It also suggests that a comprehensive approach, including not only a reduction in workload but also an increase in salary, high esteem for eldercare and good job security, may be important for improving low back pain among eldercare workers in nursing homes. However, longitudinal studies and further nationwide investigations are warranted for more definitive results.
Acknowledgments: We thank all the participants and the nursing home staffs who participated in the study, research assistants, our colleagues, and Kagawa Council of Senior Citizens Welfare Service.