Abstract
Objectives: In the use of activated carbon beds as adsorbents for various types of organic vapor in respirator gas filters, water adsorption of the bed and test gas humidity are expected to alter the accuracy in the estimation of breakthrough data. There is increasing interest in the effects of moisture on estimation methods, and this study has investigated the effects with actual breakthrough data. Methods: We prepared several activated carbon beds preconditioned by equilibration with moisture at different relative humidities (RH=40%-70%) and a constant temperature of 20°C. Then, we measured breakthrough curves in the early region of breakthrough time for 10 types of organic vapor, and investigated the effects of moisture on estimation using the Wheeler-Jonas equation, the simulation software NIOSH MultiVapor™ 2.2.3, and RBT (Relative Breakthrough Time) proposed by Tanaka et al. Results: The Wheeler-Jonas equation showed good accordance with breakthrough curves at all RH in this study. However, the correlation coefficient decreased gradually with increasing RH regardless of type of organic vapor. Estimation of breakthrough time by MultiVapor showed good accordance with experimental data at RH=50%. In contrast, it showed discordance at high RH (>50%). RBTs reported previously were consistent with experimental data at RH=50%. On the other hand, the values of RBT changed markedly with increasing RH. Conclusions: The results of each estimation method showed good accordance with experimental data under comparatively dry conditions (RH≤50%). However, there were discrepancies under high humidified conditions, and further studies are warranted.
1. Introduction
Activated carbon plays an important role in occupational and industrial hygiene as an adsorbent of harmful substances, particularly various types of organic vapor. In the actual use of an activated carbon bed in respirator gas filters, the breakthrough characteristics of organic vapors are very important, and these characteristics are affected by water adsorption of the activated carbon bed and humidity in the test gas1-3). Previously2,3), we prepared several activated carbon beds using coconut shell activated carbon preconditioned by equilibration with moisture at different relative humidities (RH), and measured the breakthrough times for several types of organic vapor. We found that the relative percent weight increase due to moisture adsorption of the carbon specimen had a quantitative effect2,3) on reducing the breakthrough time. That is, the data plots of the breakthrough times versus water adsorption showed good agreement with quadratic functions approximating a wide range of water adsorption in the graphs2,3).
In the meantime, several prospective theoretical and experimental methods for estimation of organic vapor breakthrough in activated carbon bed used as respirator gas filters have been studied4-15). The above effects of moisture are also expected to change accuracy of estimation of organic vapor breakthrough data, and there is increasing interest. In this study, we used breakthrough curve data in the early region of breakthrough time for 10 types of organic vapor, and investigated the effects of usage environment humidity of the activated carbon beds on estimation using the Wheeler-Jonas equation4-6),8), the simulation software NIOSH MultiVapor™ 2.2.310-13), and RBT (Relative Breakthrough Time) proposed by Tanaka et al.14,15).
2. Materials and Methods
Characterization of the activated carbon specimen, the apparatus and the conditions used for preconditioning and measurement of breakthrough times or curves of the specimen for organic vapors were same as those described in our previous reports2,3,16). The apparatus consisted of two prominent parts, one for generating an airflow containing an organic solvent vapor at a constant concentration with constant relative humidity (RH), and the other for testing the breakthrough of the test column, filtering the airflow containing the organic vapor. They were set in a thermostatic air box, and the exit vapor concentration from the test column was monitored by a gas chromatograph system equipped with a hydrogen flame ionization detector (FID).
We prepared several activated carbon beds imitating respirator gas filters. After drying at 75°C, we packed the carbon specimens in an acrylic resin tube with an internal diameter of 70 mm. The packed carbon bed was sandwiched between 2 metal meshes in the test column, and preconditioned by equilibration with moisture at different relative humidities (RH=approximately 40%-70%) and a constant temperature of 20°C.
Then, we measured their breakthrough curves in the early region of breakthrough time for 10 types of humidified organic vapor (acetone, benzene, toluene, carbon tetrachloride, cyclohexane, n-hexane, n-heptane, methyl acetate, methanol, 2-propanol), and examined their changes according to the humidity of the usage environment. The principal experimental conditions used in this study are presented in Table 1 (a). We also measured breakthrough data similarly using dry activated carbon beds and humidified organic vapors. Each breakthrough curve measurement was cut off at approximately the point of breakthrough concentration below 30-60 ppm against a challenge concentration of 300-800 ppm as the high breakthrough concentration region is of little importance in the actual use of activated carbon beds as adsorbents of harmful substances in many cases.
Table 1.
| (a) Principal experimental conditions for breakthrough measurements in this study. |
| Experimental condition |
Value |
| Activated carbon bed diameter/cm |
7.0 |
| Bed depth/cm |
2.5, 1.25 |
| Carbon weight per bed/g |
35, 17.5 |
| Temperature/˚C |
20 |
| Relative humidity/% |
40-70 |
| Average flow of organic vapor/l min–1 |
30 |
| Vapor concentration/ppm |
300, 600, 800 |
| Preconditioned drying temperature/˚C |
75 |
| (b) Principal input conditions of cartridge or carbon bed data into MultiVapor, and the values used for estimation in Fig. 4 and Supplementary Table 2. |
| Input condition |
Value |
| Bed diameter/cm |
7.0 |
| Bed depth/cm |
2.5 |
| Carbon weight per cartridge or bed/g |
35 |
| Micropore volume/cm3 g–1 |
0.533 |
| Carbon granule average diameter/cm |
0.11 |
| Adsorption potential (for benzene)/kJ mol–1 |
18.666 |
| Affinity coefficient for water/dimensionless number |
0.06 |
| Temperature/˚C |
20 |
| Atmospheric pressure/atm |
1.00 |
| Number of cartridges on a respirator |
1 |
| Average breathing air flow/l min–1 |
30 |
| Vapor concentration/ppm |
300 |
| Breakthrough concentration/ppm |
5 |
The activated carbon specimens used in this study were of the granular type coconut shell activated carbon taken from a major organic vapor gas filter product available commercially in Japan. Among the carbon specimens examined in our previous studies, we used the specimen S12,3), which has the largest N2-BET (Brunauer-Emmett-Teller) specific surface area.
Further, we investigated the effects of humidity on several estimation methods, as described in detail below. In this study, we considered the effects on application of the Wheeler-Jonas equation for breakthrough curves, breakthrough time estimation by the simulation software NIOSH MultiVapor™ 2.2.3, and RBT proposed by Tanaka et al.14,15) using the organic vapor breakthrough data.
3. Results
3.1. Experimental reproducibility
Activated carbon is not a crystalline material with high homogeneity, and the experimental reproducibility in each adsorption measurement is also important for scientific discussion in this paper. Fig. 1 (a) shows the water adsorption isotherm based on relative percent weight increase due to moisture adsorption of the activated carbon beds measured at 20°C and several relative humidities (RH=40%-70%). The number of measurements for each data point was approximately 8, and the average standard deviation for relative percent weight increase due to moisture adsorption at each data point was <0.9%. The figure shows that the activated carbon specimen used in this study has good experimental reproducibility in water adsorption equilibrium against each relative humidity.

On the other hand, Fig. 1 (b) shows experimental reproducibility of breakthrough curves measured at 20°C and RH=50% for cyclohexane with a vapor concentration of 300 ppm in this study. The figure also shows the curve approximated by the Wheeler-Jonas equation, which is a theoretical breakthrough equation described later, applied to the breakthrough data and its correlation coefficient. In the figure, the number of measurements for each data point is approximately 3, and the average standard deviation of breakthrough concentration at each data point is approximately 3 ppm. The correlation coefficient for approximation of the Wheeler-Jonas equation in the figure, 0.9977, was comparatively good. The above results showed that the activated carbon specimen and the apparatus used for preconditioning and measurement of the organic vapor breakthrough curves in this study had sufficient experimental reproducibility.
3.2. Curve fittings with Wheeler-Jonas equation
In recent years, organic vapor breakthrough curves for respirator gas filters have been discussed using the Wheeler-Jonas equation4-6),8). The theoretical equation can also be used to estimate the service lives of activated carbon beds for organic vapors. The equation is presented in detail below (equation (1) ).

where:
tb = breakthrough time [min]
We = adsorption capacity of carbon [g/g-carbon]
W = carbon bed weight [g]
C0 = challenge vapor concentration [g/cm3 or ppm]
C = breakthrough concentration [g/cm3 or ppm]
Q = airflow rate [cm3/min]
ρB = bulk density of carbon [g/cm3]
kv = adsorption rate coefficient [min-1]
We used the following simplification of the above equation (1) for approximation calculation of experimental breakthrough curves.


where:
A, B = constant [min]
The above equations (1) - (3) have no term that directly indicates effect of humidity in the test gas.
3.2.1. Relative humidity (RH) dependence
Supplementary Fig. 1 and Fig. 2 (e) show the curve fitting results using cyclohexane vapor breakthrough data at different relative humidity (RH=40%-70%) equilibria with the Wheeler-Jonas equation. The breakthrough curves in the figure moved to a shorter breakthrough time region with increasing relative humidity. The reduction effect of relative humidity on breakthrough time was remarkable at RH>50%. In contrast, there was little change in the breakthrough curve under dry conditions at RH=40%-50%. On the other hand, the Wheeler-Jonas equation showed good accordance with cyclohexane breakthrough data at all relative humidities measured in this study. Fig. 1 (c) shows the effects of relative humidity in preconditioning of activated carbon bed and test gas. As shown in the figure, both relative humidities had definite effects on reduction of breakthrough curves.


The measurement results of humidity dependence of breakthrough curves of 10 types organic vapor are presented in Fig. 2 (a) - (j) and Supplementary Table 1. The degree of humidity dependence of breakthrough curves differs among types of organic vapor; however, in many cases, breakthrough curves moved to the shorter breakthrough time region with increasing relative humidity as expected. In contrast to this, only methanol showed the opposite result. We also measured breakthrough data similarly using dry activated carbon bed (dried at 75°C, 35 g and 17.5 g (Supplementary Fig. 2) and humidified organic vapors at RH=50% or 60%). In the figures, use of dry activated carbon bed moved the breakthrough curves of most organic vapors to the longer breakthrough time region compared with the curves of the humidified activated carbon bed. On the other hand, methanol showed the opposite result, and the difference in humidity dependence of methanol was distinct.

Supplementary Table 1.
Curve fitting data of the experimental breakthrough curve by equation (2) described in Fig. 2 (a)-(j).
A and
B are constants in equation (2).
| Organic vapor |
RH/% |
A |
B |
|R| |
| Acetone |
50 |
170.070 |
22.951 |
0.9995 |
|
59 |
145.550 |
18.425 |
0.9994 |
|
70 |
92.327 |
12.189 |
0.9887 |
| Benzene |
50 |
341.500 |
31.165 |
0.9999 |
|
59 |
208.680 |
22.395 |
0.9972 |
|
65 |
124.030 |
15.931 |
0.9941 |
| Toluene |
50 |
432.980 |
40.923 |
0.9988 |
|
55 |
412.190 |
39.945 |
1.0000 |
|
60 |
397.440 |
40.522 |
0.9984 |
|
69 |
357.070 |
52.556 |
0.9965 |
| Carbon tetrachloride |
50 |
312.950 |
31.495 |
0.9997 |
|
60 |
146.520 |
20.480 |
0.9928 |
|
65 |
60.097 |
10.354 |
0.9782 |
| Cyclohexane |
40 |
317.460 |
27.548 |
0.9999 |
|
44 |
317.660 |
32.012 |
1.0000 |
|
45 |
295.010 |
25.406 |
0.9999 |
|
50 |
291.810 |
30.101 |
0.9997 |
|
55 |
223.970 |
24.953 |
0.9995 |
|
56 |
197.970 |
22.340 |
0.9976 |
|
60 |
126.100 |
16.270 |
0.9982 |
|
65 |
46.639 |
8.4376 |
0.9981 |
| n-Hexane |
50 |
297.060 |
25.804 |
1.0000 |
|
60 |
158.400 |
16.662 |
0.9933 |
|
65 |
73.049 |
9.0208 |
0.9911 |
| n-Heptane |
50 |
317.330 |
27.878 |
0.9997 |
|
60 |
272.840 |
28.849 |
0.9909 |
|
70 |
161.390 |
24.326 |
0.9682 |
| Methyl acetate |
50 |
216.650 |
22.554 |
0.9995 |
|
60 |
165.350 |
20.855 |
0.9987 |
|
69 |
103.860 |
16.215 |
0.9910 |
| Methanol |
50 |
25.600 |
4.8073 |
0.9864 |
|
65 |
31.867 |
5.4317 |
0.9743 |
| 2-Propanol |
50 |
379.320 |
41.382 |
0.9987 |
|
59 |
301.880 |
32.427 |
0.9979 |
The Wheeler-Jonas equation showed approximately good accordance with breakthrough data at all relative humidities measured in this study. Particularly, the average correlation coefficient of curve fitting at RH=50% (both preconditioning of activated carbon bed and test gas) in Fig. 2 (a) - (j) was 0.9982. However, the correlation coefficient of approximation by the equation decreased gradually with increasing relative humidity regardless of the type of organic vapor (Fig. 2 (k)).
3.2.2. Dependence on carbon weight and challenge concentration
We next examined the dependence of breakthrough curves on activated carbon bed weight and challenge concentration of organic vapor mainly using cyclohexane vapor breakthrough data. Fig. 3 (a) (b) show cyclohexane and 2-propanol vapor breakthrough data and curve fitting results with the Wheeler-Jonas equation at different carbon bed weights (17.5 g and 35 g). The equation showed approximately good accordance with each breakthrough data in approximation. The breakthrough data were measured using twice the weight of activated carbon bed (35 g) as compared with the other 17.5 g bed. For simple forecasting, the 35 g bed was expected to have twice the breakthrough time against each breakthrough concentration compared with the 17.5 g bed. Fig. 3 (c) (d) show breakthrough time ratio (t35 g/t17.5 g) calculated from approximated curves by equation (2).
where:
t17.5 g, t35 g = breakthrough times of 17.5 g and 35 g activated carbon beds calculated by approximation using equation (2) in Fig. 3 [min]
Both breakthrough time ratios (t35 g/t17.5 g) by cyclohexane and 2-propanol were close to 2 in the higher breakthrough concentration region from approximately 150 to 300 ppm. In contrast, in the lower region of approximately 1 ppm<C<50 ppm, both relative breakthrough time ratios clearly exceeded 2. Moreover, in the region C <2 ppm, the breakthrough time ratios also showed marked elevation. In short, the breakthrough time ratio changes sensitively in the low breakthrough concentration region.
On the other hand, Fig. 3 (e) (f) show cyclohexane vapor breakthrough data and curve fitting results with the Wheeler-Jonas equation at different challenge concentrations (300 ppm and 600 ppm at RH=50%, 300 ppm and 800 ppm at RH=60%). In the same manner as carbon bed weight dependence, Fig. 3 (g) (h) show breakthrough time ratio ( (t300 ppm/t600 ppm), (t300 ppm/t800 ppm) ) and calculated from approximated curves by equation (2).
where:
t300ppm, t600ppm, t800ppm = breakthrough time of activated carbon bed with challenge concentration 300, 600, and 800 ppm calculated by approximation using equation (2) in Fig. 3 [min]
Both breakthrough time ratios ( (t300 ppm/t600 ppm) and (t300 ppm/t800 ppm) ) were close to the expected values, 2 or 8/3 over a wide region of breakthrough concentration.
3.3. Comparison with estimation of breakthrough time by NIOSH MultiVaporTM 2.2.3
The National Personal Protective Technology Laboratory, NIOSH (National Institute for Occupational Safety and Health, USA), Centers for Disease Control and Prevention has released software for estimation of breakthrough times and service lives of air-purifying respirator cartridges or activated carbon beds, NIOSH MultiVapor™ 2.2.3 (hereafter, simply "MultiVapor" ) on their website10,11). The software is based on Wheeler-Jonas equation and its extension, and provided as scientific information for laboratory studies at present; however, its future development for application to the work place is also expected. In this study, we considered the effect of humidity on breakthrough time estimation using MultiVapor. This software requires three categories of input information to estimate breakthrough time as follows.
(1) Information about the respirator cartridge and contained activated carbon for removing organic vapors.
(2) Information about the organic vapors of concern.
(3) Information about the data related to respirator use conditions.
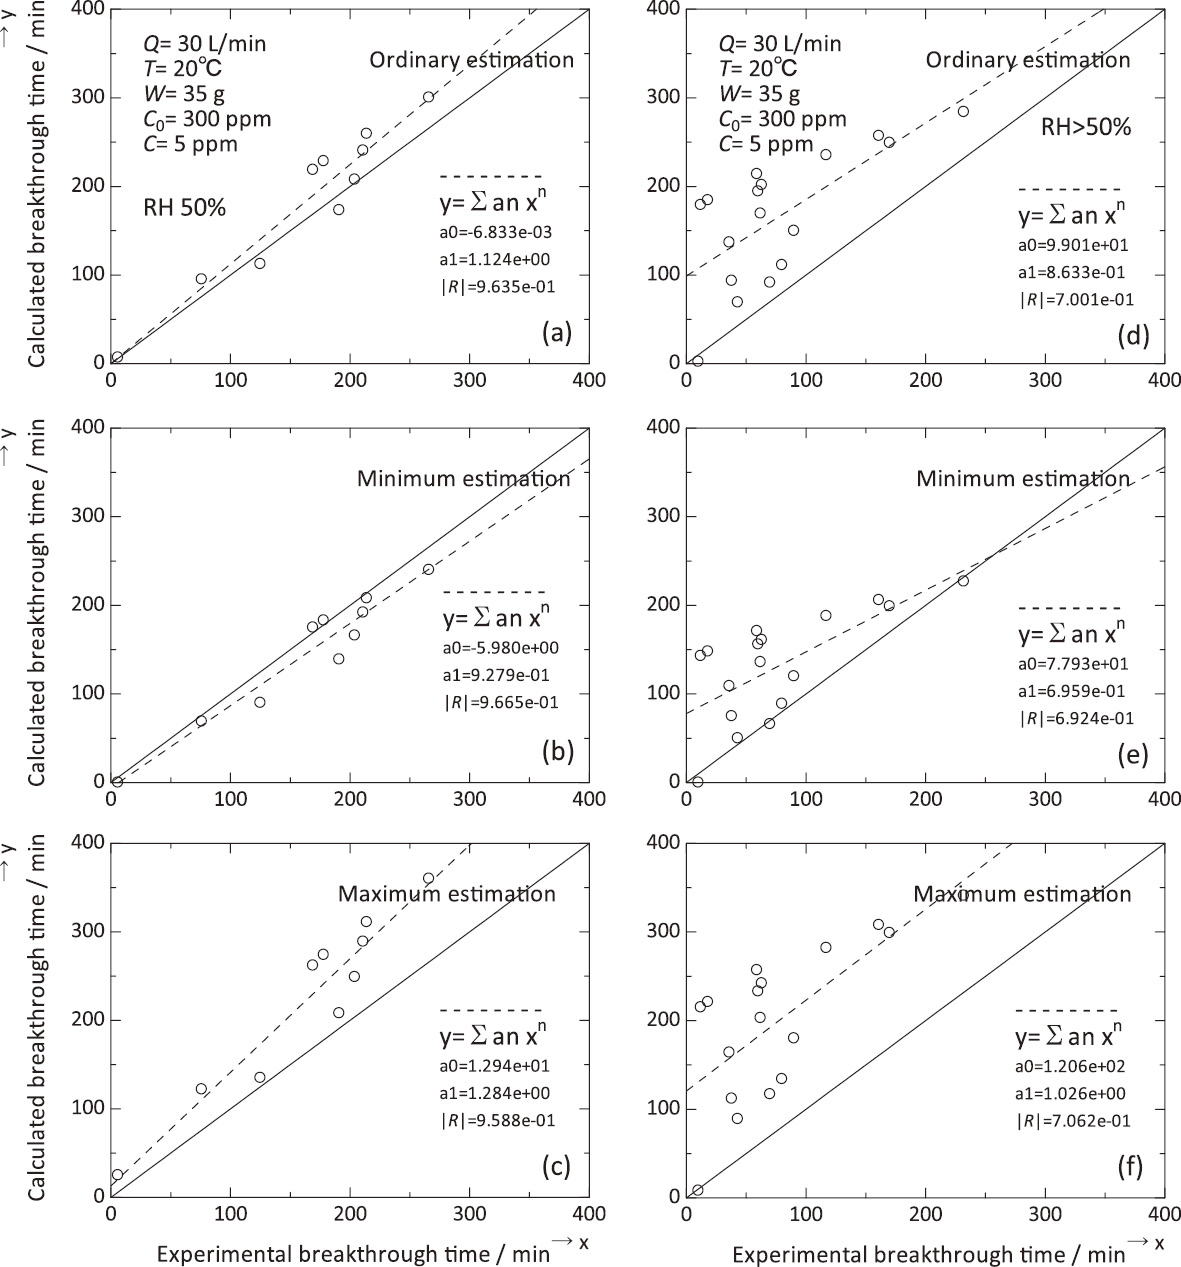
The principal input conditions used in this study are described in Table 1 (b). Typical values of micropore volume, carbon granule average diameter, adsorption potential (for benzene), and affinity coefficient for water were applied as recommended for MultiVapor12,13). We used 5 ppm as the value of breakthrough concentration in estimation calculation for standardization. The experimental breakthrough times at 5 ppm were calculated from approximation by equation (2). MultiVapor outputs a three-way estimation; ordinary estimation, minimum estimation and maximum estimation. Estimation of breakthrough time by MultiVapor showed good accordance with experimental data at RH=50% (Fig. 4 (a) - (c), Supplementary Table 2). In contrast, it showed definite discordance from experimental data in the high relative humidity region (RH>50%) (Fig. 4 (d) - (f), Supplementary Table 2).
Supplementary Table 2.
Experimental data of organic vapor breakthrough time of an activated carbon bed in this study, and the results of estimation by MultiVapor described in Fig. 4.
| Organic vapor |
RH/% |
Experimental breakthrough time at 5 ppm/min |
Ordinary estimation by MultiVapor/min |
Minimum estimation by MultiVapor/min |
Maximum estimation by MultiVapor/min |
| Acetone |
50 |
76 |
95.2 |
69 |
122 |
|
59 |
70 |
91.6 |
66 |
117 |
|
70 |
43 |
69.3 |
50 |
89 |
| Benzene |
50 |
214 |
259.5 |
208 |
311 |
|
59 |
117 |
235.3 |
188 |
282 |
|
65 |
59 |
214 |
171 |
257 |
| Toluene |
50 |
266 |
300.4 |
240 |
360 |
|
55 |
249 |
291.9 |
234 |
350 |
|
60 |
232 |
284.1 |
227 |
341 |
|
69 |
161 |
257.1 |
206 |
308 |
| Carbon tetrachloride |
50 |
185 |
228.6 |
183 |
274 |
|
60 |
63 |
201.7 |
161 |
242 |
|
65 |
18 |
184.5 |
148 |
221 |
| Cyclohexane |
50 |
169 |
218.7 |
175 |
262 |
|
55 |
122 |
205 |
164 |
246 |
|
56 |
107 |
203.2 |
163 |
244 |
|
60 |
60 |
194.5 |
156 |
233 |
|
65 |
12 |
179.1 |
143 |
215 |
| n-Hexane |
50 |
191 |
173.3 |
139 |
208 |
|
60 |
90 |
150 |
120 |
180 |
|
65 |
36 |
136.8 |
109 |
164 |
| n-Heptane |
50 |
204 |
207.8 |
166 |
249 |
|
60 |
155 |
193.2 |
155 |
232 |
|
70 |
62 |
169.4 |
136 |
203 |
| Methyl acetate |
50 |
125 |
112.5 |
90 |
135 |
|
60 |
80 |
111.3 |
89 |
134 |
|
69 |
38 |
93.5 |
75 |
112 |
| Methanol |
50 |
6 |
7 |
0 |
25 |
|
65 |
10 |
2.3 |
0 |
8 |
| 2-Propanol |
50 |
211 |
240.5 |
192 |
289 |
|
59 |
170 |
249.2 |
199 |
299 |
RBT (Relative Breakthrough Time) has been proposed as a time index available for practical use of activated carbon beds in gas filters of respirators in several previous reports. Tanaka et al.14,15) reported specific RBT data of approximately 46 types organic vapor using cyclohexane as a standard at 20°C and RH=50% for an activated carbon bed with a weight of 22 g and volume capacity of 63 cm3. The data of each organic vapor were obtained using the breakthrough concentration of 5 ppm and challenge concentration of 300 ppm. We used different activated carbon specimen and activated carbon beds with slightly different weight and size as compared to those used by Tanaka et al.14) in measurement of organic vapor breakthrough data. However, we attempted comparison between our breakthrough data and the RBTs of Tanaka et al. for 7 types organic vapor. Preconditioning conditions of activated carbon beds used by Tanaka et al. were not specified. Therefore, we used breakthrough data measured by both activated carbon beds with moisture equilibration at RH=50% and dry beds. Our RBT data of each organic vapor was determined by calculation of approximation with equation (2) in Supplementary Fig. 2 against a breakthrough concentration of 5 ppm. The RBT for organic vapor breakthrough in the activated carbon bed, experimental data at 20°C and RH=50% conformed well with the data of Tanaka et al.14), regardless of preconditioning of the activated carbon bed and type of organic vapor (Fig. 5 (a)).

In contrast, we also investigated RBTs in the high relative humidity region (RH>50%) using activated carbon beds with moisture equilibration. Our RBT values changed markedly and non-uniformly with increases in relative humidity regardless of the type of organic vapor (Fig. 5 (b)). The RBT values seem to have increasing tendency with increase of relative humidity.
4. Discussion
4.1. Curve fittings with Wheeler-Jonas equation
The Wheeler-Jonas equation was effective for application to even moisture-adsorbed activated carbon beds (RH>50%) in this study. The equation was effective for discussion of breakthrough curve data in the early region of breakthrough time. Furthermore, the equation is expected to be able to reproduce the entire breakthrough curve from partial data, particularly in the early region of breakthrough time. On the other hand, increases in relative humidity diminished the accuracy of estimation by the equation, as observed for changes in correlation coefficients. The theoretical equation was derived from the assumption that organic vapor adsorption has equable probability all over the activated carbon bed. However, water adsorption in the bed is assumed to decrease the equable probability, and therefore the correlation coefficient of approximation by the equation decreased gradually with increasing relative humidity regardless of the type of organic vapor (Fig. 2 (k)).
In addition, most organic vapor breakthrough curves moved to the shorter breakthrough time region with increases in relative humidity. The reduction of breakthrough times was due to water adsorption by the activated carbon bed and the hydrophobic properties of organic vapors. However, methanol showed the opposite result, because it has high hydrophilicity. Thus, methanol vapor was also dissolved into adsorbed water in the activated carbon bed, and its breakthrough time was increased. 2-Propanol is also an alcohol, but its humidity dependence is different from that of methanol, because it is less hydrophilic.
Furthermore, from the results of Fig. 3, the dependence of breakthrough curves on challenge concentration of organic vapor was assumed to be easier to handle than that on activated carbon bed weight.
4.2. Comparison with estimation of breakthrough time by NIOSH MultiVaporTM 2.2.3
As described above, MultiVapor outputs three types of estimation, and adoption of the results is also important in utilization of the software. Therefore, estimation of breakthrough time by MultiVapor showed good accordance with experimental data at RH=50% (Fig. 4 (a) - (c)). However, in detail, maximum estimation was insufficient compared with other types of estimation in the above results. In contrast, ordinary and minimum estimations were similar in accordance with experimental data, therefore judgment of adoption from the two estimations was difficult in this study12,13).
On the other hand, application of MultiVapor leaves a matter of question, particularly in the high relative humidity region. MultiVapor seemed to be liable to overestimate breakthrough times in the region RH>50%. At present, application of MultiVapor in this region is not smooth, and further improvement of the software is needed.
4.3. Comparison with RBT (Relative Breakthrough Time)
RBT is expected to be an easy-to-use and effective index in the case of commensurate size and use conditions of activated carbon beds, particularly around RH=50% and 20°C. In using RBT, the effects of various conditions of the activated carbon beds are also concerned. However, the results of this study indicated that application of the index does not require completely equal size and weight of carbon beds. Of course, considering the current distribution of many types of activated carbon products, the results are attractive and further studies are also desirable.
In contrast, we found that RBTs in the high relative humidity region (RH>50%) increased, and the results indicate that cyclohexane as a standard of RBT was affected by humidity in its reduction of breakthrough times markedly as compared with other types of organic vapor. In regard this point, further studies are required to clarify detailed behavior of RBTs in the high humidified condition (RH>50%) using various activated carbon specimens2,17).
5. Conclusions
The Wheeler-Jonas equation was effective for application even to moisture-adsorbed activated carbon beds (RH>50%). On the other hand, increases in humidity decreased the accuracy of approximation calculation by the equation. Application of the software MultiVapor 2.2.3 leaves a matter of question particularly in the high relative humidity region (RH>50%), and further improvement is needed. RBT is expected to be an effective index in the case of commensurate size and use conditions of activated carbon beds, particularly around RH=50% and 20°C.
The results of each method of approximation calculation showed good accordance with experimental data under comparatively dry conditions (RH≤50%). However, there were still shortcomings in application for breakthrough data under humidified conditions, and further studies are required to address these issues.
Conflicts of interest: The authors declare that there are no conflicts of interest in this study.
References
- 1) Nelson GO, Correia AN, Harder CA. Respirator cartridge efficiency studies: VII. effect of relative humidity and temperature. Am Ind Hyg Assoc J 1976; 37: 280-288.
- 2) Abiko H, Furuse M, Takano T. Quantitative evaluation of the effect of moisture contents of coconut shell activated carbon used for respirators on adsorption capacity for organic vapors. Ind Health 2010; 48: 52-60.
- 3) Abiko H, Furuse M, Takano T. Reduction of adsorption capacity of coconut shell activated carbon for organic vapors due to moisture contents. Ind Health 2010; 48: 427-437.
- 4) Yoon YH, Nelson JH. Application of gas adsorption kinetics. I. A theoretical model for respirator cartridge service life. Am Ind Hyg Assoc J 1984; 45: 509-516.
- 5) Yoon YH, Nelson JH. Application of gas adsorption kinetics-II. A theoretical model for respirator cartridge service life and its practical applications. Am Ind Hyg Assoc J 1984; 45: 517-524.
- 6) Abiko H. Study on approximate calculation of organic vapor breakthrough curve by small size column of activated carbon. Sangyo Eiseigaku Zasshi 2013; 55: 69-72 (in Japanese).
- 7) Wood GO. Estimating service lives of organic vapor cartridges II: a single vapor at all humidities. J Occup Environ Hyg 2004; 1: 472-492.
- 8) Abiko H. Modeling of gaseous adsorption of activated carbon bed by Wheeler-Jonas equation and estimation of breakthrough time using the extended equation. TANSO 2011; 133-143 (in Japanese).
- 9) Abiko H. Evaluation of organic vapor breakthrough time of an activated carbon bed containing moisture by Wood's estimation model using the Wheeler-Jonas equation. TANSO 2011; 185-190 (in Japanese).
- 10) The National Personal Protective Technology Laboratory (NPPTL). MultiVapor™ Version 2.2.3 Application. [Online]. 2015[cited 2015 Aug. 7]; Available from: URL: http://www.cdc.gov/niosh/npptl/MultiVapor/MultiVapor.html
- 11)
MultiVapor TUTORIAL Gerry Wood, March 18, 2007. [Online]. 2007[cited 2015 Aug. 7]; Available from: URL: http://www.cdc.gov/niosh/npptl/MultiVapor/Tutorials/MultiVapor213Tutorial.pdf
- 12) Abiko H. Estimation of organic vapor breakthrough time of activated carbon bed using NIOSH MultiVapor™ software. Sangyo Eiseigaku Zasshi 2013; 55: 165-171 (in Japanese).
- 13) Abiko H. Effect of average diameter of activated carbon granules on estimation of organic vapor breakthrough time using NIOSH MultiVapor™ software and discussion of its practical use. Sangyo Eiseigaku Zasshi 2014; 56: 275-285 (in Japanese).
- 14) Tanaka S, Nakano Y, Tsunemori K, Shimada M, Seki Y. A study on the relative breakthrough time (RBT) of a respirator cartridge for forty-six kinds of organic solvent vapors. Appl Occup Environ Hyg 1999; 14: 691-695.
- 15) Tsuda Y, Tsunemori K, Tanaka S. A study on the relative breakthrough time (RBT) of a respirator cartridge-effects of kind of respirator cartridge-. Sangyo Eiseigaku Zasshi 2004; 46: 171-172 (in Japanese).
- 16) Furuse M, Kanno S, Takano T, Matsumura Y. Cyclohexane as an alternative vapor of carbon tetrachloride for the assessment of gas removing capacities of gas mask. Ind Health 2001; 39: 1-7.
- 17) Hasegawa T, Iwasaki S, Shibutani Y, Abe I. Preparation of superior humidity-control materials from kenaf. J Porous Mater 2009; 16: 129-134.

