Originals
Does pain deteriorate working life expectancy in aging workers?
2016 年 58 巻 6 号 p. 582-592

詳細
2016 年 58 巻 6 号 p. 582-592
Objectives: Many aging workers wish to continue working as long as they can for a better life in the future. However, symptoms of pain are a key obstacle in the continuation of work among older workers. The impact of pain on work is understudied. Thus, we investigated the relationship between pain characteristics (total site and severity) and aging workers' working life expectancy scale (WoLES) in Korea. Methods: We included 1,979 participants (1,175 men and 804 women) from a well-established survey of a nationally representative population: the Korean Longitudinal Study of Ageing. A self-questionnaire was used to assess pain characteristics and WoLES. Odds ratios (ORs) and 95% confidence intervals (CIs) for the lower-WoLES group were calculated using multiple logistic regression models. Results: Compared with the absence of pain, ORs and 95% CIs of the lower-WoLES group were increased, as follows: 1 pain site, 1.75 (1.20-2.55); 2 pain sites, 1.99 (1.32-3.03); 3 or more pain sites, 2.28 (1.51-3.42); mild pain, 1.74 (1.32-2.61); moderate pain, 2.02 (1.28-3.22); and severe pain, 2.12 (1.46-3.08). The statistical trend was significant in both total sites and severity of pain (p<0.001). Conclusions: There was a significant association between WoLES and both total pain sites and severity of pain, even after adjusting for potential confounding factors.
The number of aging workers among the working population is increasing, leading to significant economic and public health challenges worldwide. The main reasons are increasing life expectancy, decreasing birth rates, and the large "baby boomer" generation born after World War II getting old1). The International Labour Organization has estimated that by the year 2025, the proportion of the working population aged more than 55 years will be 21% in Asia, 32% in Europe, 30% in North America, and 17% in Latin America2). The impact of these changes is currently being felt most strongly in developed countries, making it important for these countries to extend workers' working life expectancy (WoLE) in order to maintain labor force participation3). Furthermore, among older people, losing or leaving one's occupation is associated with a negative impact on both socioeconomic and health status4). Thus, over 75% of aging workers choose to continue working, even if they develop a significant work disability5). An investigation to assess WoLE among aging workers is thus warranted.
Unfortunately, the aging process places burdens on health that may cut working life short6,7). Workers' self-perceived health status deteriorates with age, and chronic diseases (including hypertension, diabetes, and liver disease) are more common in older people than in the middle-aged population8). Pain is especially common in older workers worldwide9); for instance, a longitudinal study in the US (1992-2008) found that the prevalence of persistent back pain among construction workers aged more than 50 years to be about 40%10). Poor health may lead to poor work performance, and both are important factors in early exits from working life11,12). Indeed, many older workers with pain experience significantly decreased work performance or find themselves unable to participate in the labor force13,14), and pain is associated with poor health status on both self-reported15) and external-observer assessments, as well as with work disability16,17).
Pain thus poses a key obstacle to maintaining WoLE in older workers; however, its impact on work has not been studied in detail, particularly given that aging workers will soon be among our main human resources. No study has yet comprehensively addressed the relationship between pain and the risk of early discontinuation of working life. Therefore, we explored the relationship between pain and WoLE scale (WoLES) among Korean workers aged 55 or older, using data from the Korean Longitudinal Study of Ageing (KLoSA), by undertaking a multivariate analysis of participants' demographic characteristics and chronic disease status. Different degrees and types of pain can have different effects on human health18). Hence, we also assessed pain severity and number of pain sites.
We used data from the 2012 phase of KLoSA, conducted by the Korea Labour Institute and the Korea Employment Institute Information Service. KLoSA began in 2006 with surveys and interviews of 10,254 randomly selected adults aged 45 or older who were residing in one of 15 city-size administrative areas based on the Population and Housing Census as a sampling frame to represent citizens in the Republic of Korea. Other countries' elderly panel surveys are conducted in those older than 50 years old. By the late 1990s currency crisis in Korea, workers in their mid-40s had fluctuations in job status. Thus, KLoSA expanded the survey target population to over 45 years old to give consideration to social circumstances in Korea.
Of the original respondents, 7,486 were able to participate in the fourth phase of the survey, conducted from July to December 2012. Participants were interviewed using computer-assisted personal interviewing, where the professional interviewers instructed respondents to read the questions on a computer and input their answers directly. For analysis purposes, we treated the 2012 phase as a cross-sectional study.
Previous studies have divided the older population into three categories: (1) young-old (65 to 74), (2) middle-old (75 to 84) and (3) oldest-old (older than 85)19). However, those older than 75 years of age are prone to frailty and rapid deterioration in physical and mental health status20). To reduce the possibility of our WoLES data being confounded by such factors, we excluded participants aged more than 75 years from our study, along with those who were economically inactive (combined n=4,754). We wished to limit our sample to patients experiencing aging-associated pain. Hence, we also excluded those diagnosed with cancer within 6 years after beginning the KLoSA; this condition is closely associated with pain, with significant pain occurring in approximately 33%-66% of cancer patients21). Finally, we excluded subjects who had any missing data. The final sample included 1,979 participants (1,175 men and 804 women) (Fig. 1).
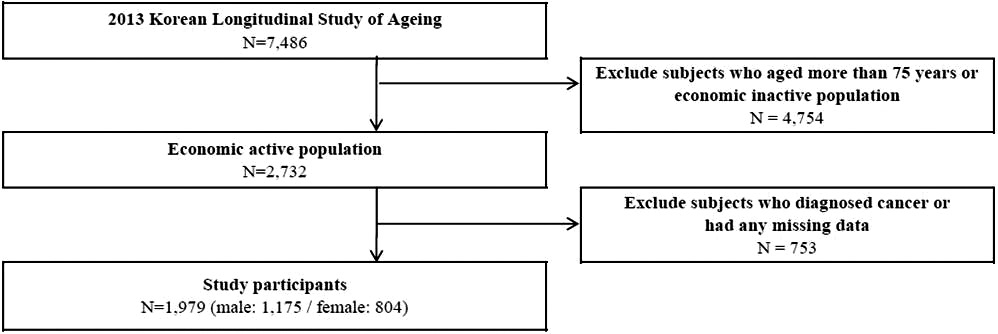
Schematic diagram depicting study participants.
Each KLoSA participant is identified by a randomly selected number to protect anonymity. Interviewers provided information about research objectives and potential risks and benefits to all survey respondents before they answered any questions. All respondents also agreed to participate in further scientific research.
Working life expectancy scaleTo define the WoLE status, the participants' expectation of maintaining the current job was assessed by self-reported questionnaires. The statement was "I can keep working in this job for 5 more years" for economically active participants. Participants were asked to answer this question using a visual analogue scale (0 to 100 with intervals of 10, where 0 signified "never" or "it will never happen to me" and 100 signified "always" or "it will happen to me sure as fate" ). Therefore, higher scores indicated a greater expectation of maintaining a current job. Workers who had scores of 50 or higher were defined as the higher-WoLES group, while others were defined as the lower-WoLES group.
Pain characteristicsParticipants were provided with a list of body parts (head, shoulder, arm, wrist, finger, chest, abdomen, waist, hip, leg, knee, ankle, and toe) and asked whether they suffered pain at any of these sites. We re-grouped thirteen pain sites into five according to the human anatomical system: head, upper extremes (shoulder, arm, wrist, and finger), chest & abdomen, back & lumbar (waist and hip), and lower extremes (leg, knee, ankle, and toe). If participants answered yes for any site, they were asked to indicate the severity of their pain (mild, moderate, or severe). We divided respondents into four groups according to the number of sites at which they had pain (0, 1, 2, ≥3), as the effects of pain worsen with increasing number of pain sites22). Respondents were also grouped by total pain severity, which was answered by pain severity for each site (mild, moderate, and severe); total pain severity categories included "none," "mild," "moderate," and "severe."
Other covariatesWe used KLoSA data on age, gender, monthly household income, education level, marriage status, physical activity level, smoking status, drinking status, population of region of residence, history of chronic disease, and history of traffic accidents. Monthly household income was self-reported and measured in US dollars, with categories including <$1,000, $1,000~2,000, $2,000~$3,000, and ≥$3,000. Marriage status was also self-reported, but we reorganized the data into two categories, "living with spouse" and "living alone," with the latter including respondents who were divorced, widowed, separated, or never married. Occupational classifications were regrouped into four of the ten major categories of the International Standard Classifications of Occupations, according to skills and duties23): white collar workers (managers, professionals, technicians, and associate professionals), pink collar workers (clerical support, service, and sales workers), green collar workers (skilled agricultural, forestry, and fishery workers), and blue collar workers (crafts and related trades, plant and machine operators and assemblers, and elementary occupations). Types of employment were categorized as paid, self-employed, and unpaid family worker. Paid workers were grouped according to working status into three categories: permanent, temporary, and daily employee. Job satisfaction level was self-reported, including satisfaction and dissatisfaction. Regarding physical activity level, regular exercise was defined as exercise more than once per week with each session lasting at least half an hour. Smoking status and drinking status were categorized as "current," "past," or "never." Regions of residence were divided into three categories according to population size: rural areas (less than 50,000), cities (more than 50,000), and metropolitan cities (more than 1 million). Questions about history of traffic accidents within 6 years of the beginning of KLoSA were asked because such accidents are a common risk factor for pain in older workers24). Chronic diseases can also lead to work disability in the older population8,25); among our respondents, chronic diseases clinically diagnosed within 6 years of the beginning of KLoSA included hypertension, diabetes, bronchiolitis, emphysema, liver diseases (excluding fatty liver), myocardial infarction, angina, heart failure, depression, anxiety, insomnia, excessive stress, senile psychosis, and others.
Statistical analysisAccording to the status of WoLES, the frequency and mean with standard deviation were calculated for each data category, and the chi-squared test was used to evaluate the association between categories. Multiple logistic regression models were then used to calculate odds ratios (ORs) and 95% confidence intervals (95% CIs) for the lower-WoLES group in relation to the number of sites where participants experienced pain and total pain severity. The multiple logistic models were adjusted for age, sex, household income, marriage status, residence, occupational classification, type of employment, working status, job satisfaction level, health behavioral factors such as smoking, drinking, and physical activity, chronic diseases (hypertension, diabetes, chronic lung disease, liver disease, and cardiovascular disease), and history of traffic accidents. Statistical analyses were performed with SAS (version 9.4, SAS Institute, Cary, NC, USA). A p value <0.05 was considered to indicate statistical significance in both tails.
Table 1 presents the basic characteristics of the study participants with mean WoLES. There were 1,979 respondents in our sample, of which 1,175 (59.4%) were male and 804 (40.6%) were female. Participants who were younger, had higher household income levels, had higher education levels, and were living with a spouse were somewhat more likely to have high WoLES. In terms of occupational characteristics, most of the participants were categorized as blue collar workers (n=812, 41.0%) or self-employed workers (n=954, 48.2%), and 66.4% of people were satisfied with their jobs. According to pain sites, 32.3% of participants were suffering from lower extremes pain, and had a low mean WoLES (61.7). The mean WoLES decreased according to an increased number of pain sites (from 70.7 in none to 59.8 in more than three) and severity (from 70.7 in none to 62.2 in severe).
| Total subjects (N=1,979) | |||
|---|---|---|---|
| N (%) | WoLES* | ||
| Mean | Standard deviation | ||
| Gender | |||
| Male | 1,175 (59.4) | 68.6 | 23.1 |
| Female | 804 (40.6) | 65.2 | 23.9 |
| Age (years) | |||
| 55~64 | 1,442 (72.9) | 70.1 | 22.4 |
| 65~75 | 537 (27.1) | 59.5 | 24.6 |
| Monthly household Income ($) | |||
| <1000 | 169 (8.5) | 58.8 | 27.8 |
| <2000 | 408 (20.6) | 64.7 | 22.9 |
| <3000 | 371 (18.7) | 65.7 | 23.4 |
| ≥3000 | 1,031 (52.1) | 70.2 | 22.5 |
| Education level | |||
| elementary school | 580 (29.3) | 61.8 | 24.6 |
| middle school | 395 (20.0) | 66.3 | 24.1 |
| high school | 735 (37.1) | 70.5 | 21.7 |
| more than university | 269 (13.6) | 71.6 | 22.6 |
| Marriage status | |||
| living with spouse | 1,737 (87.8) | 67.9 | 22.8 |
| living alone | 242 (12.2) | 62.3 | 27.3 |
| Residence | |||
| rural | 795 (40.2) | 65.6 | 23.4 |
| other cities | 606 (30.6) | 69.6 | 23.3 |
| metropolitan cities | 578 (29.2) | 66.9 | 23.7 |
| Occupational classificationa | |||
| White collar | 365 (18.4) | 67.8 | 23.4 |
| Pink collar | 437 (22.1) | 70.3 | 22.0 |
| Green collar | 365 (18.4) | 66.8 | 23.6 |
| Blue collar | 812 (41.0) | 65.5 | 24.1 |
| Type of employment | |||
| Paid worker | 811 (41.0) | 63.7 | 24.6 |
| Self-employed | 954 (48.2) | 69.9 | 22.2 |
| Unpaid family worker | 214 (10.8) | 68.7 | 23.2 |
| Working status (paid worker) | |||
| Permanent | 498 (61.4) | 64.9 | 23.8 |
| Temporary | 141 (17.4) | 61.8 | 25.2 |
| Daily employee | 172 (21.2) | 61.6 | 26.0 |
| Job satisfaction level | |||
| satisfaction | 1315 (66.4) | 68.4 | 22.9 |
| dissatisfaction | 664 (33.6) | 64.9 | 24.4 |
| Smoking | |||
| Never | 1,154 (58.3) | 66.3 | 23.2 |
| Past | 344 (17.4) | 69.4 | 24.2 |
| Current | 481 (24.3) | 67.9 | 23.7 |
| Alcohol consumption | |||
| Never | 768 (38.8) | 66.1 | 23.3 |
| Past | 217 (11.0) | 65.4 | 25.1 |
| Current | 994 (50.2) | 68.5 | 23.2 |
| Physical activity | |||
| non-regular | 1,347 (68.1) | 66.2 | 23.1 |
| regular | 632 (31.9) | 69.5 | 24.2 |
| Pain sitesb | |||
| Head | 32 (1.6) | 70.0 | 23.8 |
| Upper extremes | 455 (23.0) | 63.6 | 24.8 |
| Chest & abdomen | 8 (0.4) | 61.3 | 20.3 |
| Back & lumbar | 605 (30.6) | 62.9 | 24.5 |
| Lower extremes | 639 (32.3) | 61.7 | 23.9 |
| Total number of pain site | |||
| None | 991 (50.1) | 70.7 | 22.0 |
| 1 | 383 (19.4) | 65.7 | 24.1 |
| 2 | 288 (14.6) | 65.3 | 24.9 |
| ≥ 3 | 317 (16.0) | 59.8 | 23.9 |
| Pain severity | |||
| None | 991 (50.1) | 70.7 | 22.0 |
| Mild | 309 (15.6) | 65.5 | 23.8 |
| Moderate | 205 (10.4) | 64.6 | 23.8 |
| Severe | 474 (24.0) | 62.2 | 24.9 |
| Diagnosed chronic disorders | |||
| Hypertension | 556 (28.1) | 65.9 | 24.2 |
| Diabetes | 230 (11.6) | 67.2 | 22.3 |
| Lung diseasesc | 35 (1.8) | 58.3 | 30.7 |
| Liver diseasesd | 51 (2.6) | 67.3 | 20.9 |
| Cardiovascular diseasese | 82 (4.1) | 62.3 | 26.3 |
| Psychiatric diseasesf | 38 (1.9) | 64.2 | 27.3 |
| History of traffic accidents | 257 (13.0) | 70.1 | 24.1 |
| *WoLES: working life expectancy scale a Occupational classifications were regrouped into four of the ten major categories of the International Standard Classifications of Occupations, according to skills and duties: white collar workers (managers, professionals, technicians, and associate professionals), pink collar workers (clerical support, service, and sales workers), green collar workers (skilled agricultural, forestry, and fishery workers), and blue collar workers (crafts and related trades, plant and machine operators and assemblers, and elementary occupations). b We regrouped thirteen pain sites into five parts according to human anatomical system: head, upper extremes (shoulder, arm, wrist, and finger), chest & abdomen, back & lumbar (waist and hip), and lower extremes (leg, knee, ankle, and toe) with multiple responses c Lung diseases: bronchiolitis and emphysema. d Liver diseases: all liver disorders excluding fatty liver. e Cardiovascular diseases: myocardial infarction, angina, and heart failure. f Psychiatric diseases: depression, anxiety, insomnia, excess of stress, and senile psychosis. |
|||
Table 2 shows the characteristics of subjects according to WoLES status. Most participants (n=1,719, 86.9%) were categorized into the higher-WoLES group, whereas 260 were categorized into the lower-WoLES group. The proportion of women in the lower-WoLES group was observed to be higher (46.9%) than that in the higher-WoLES group (39.7%), and this was statistically significant. In terms of age, most of the participants were aged 55-64 (54.6% of lower- and 75.6% of higher-WoLES group). There were differences in the household income level, educational status, and marital status of the people according to the WoLES groups. The highest proportion of employment type in the lower-WoLES group were paid workers (53.1%), and in the higher-WoLES group, self-employed (49.9%) (p=0.0006). Both the total number of pain sites and severity were found to have statistically significant differences according to the WoLES groups. Regarding the number of pain sites, among subjects by the WoLES group (lower/higher), 33.4/52.6% had no pain, 21.9/19.0% had pain at one site, 18.5/14.0% had pain at two sites, and 26.2/14.4% had pain at three or more sites (p<0.001). Regarding total pain severity, among subjects by the WoLES group (lower/higher) 33.5/52.6% had no pain, 17.3/15.4% had mild pain, 13.1/9.9% had moderate pain, and 36.2/22.1% had severe pain (p<.0001).
| Total subjects (N=1,979) | |||
|---|---|---|---|
| Lower-WoLES* (n=260, %=13.1) | Higher-WoLES (n=1,719, %=86.9) | P value | |
| Gender | 0.0266 | ||
| Male | 138 (53.1) | 1,037 (60.3) | |
| Female | 122 (46.9) | 682 (39.7) | |
| Age (years) | <.0001 | ||
| 55~64 | 142 (54.6) | 1,300 (75.6) | |
| 65~75 | 118 (45.4) | 419 (24.4) | |
| Monthly household Income ($) | <.0001 | ||
| <1000 | 40 (15.4) | 129 (7.5) | |
| <2000 | 60 (23.1) | 348 (20.2) | |
| <3000 | 56 (21.5) | 315 (18.3) | |
| ≥3000 | 104 (40.0) | 927 (54.0) | |
| Education level | <.0001 | ||
| elementary school | 116 (44.6) | 464 (27.0) | |
| middle school | 58 (22.3) | 337 (19.6) | |
| high school | 61 (23.5) | 674 (39.2) | |
| more than university | 25 (9.6) | 244 (14.2) | |
| Marriage status | <.0001 | ||
| living with spouse | 207 (79.6) | 1,530 (89.0) | |
| living alone | 53 (20.4) | 189 (11.0) | |
| Residence | 0.2771 | ||
| rural | 72 (27.7) | 506 (29.5) | |
| other cities | 76 (28.5) | 532 (30.9) | |
| metropolitan cities | 114 (43.8) | 681 (39.6) | |
| Occupational classificationa | 0.1401 | ||
| White collar | 48 (18.5) | 317 (18.4) | |
| Pink collar | 46 (17.7) | 391 (22.8) | |
| Green collar | 45 (17.3) | 320 (18.6) | |
| Blue collar | 121 (46.5) | 691 (40.2) | |
| Type of employment | 0.0006 | ||
| Paid worker | 138 (53.1) | 673 (39.2) | |
| Self-employed | 96 (36.9) | 858 (49.9) | |
| Unpaid family worker | 26 (10.0) | 188 (10.9) | |
| Working status (paid worker) | 0.1227 | ||
| Permanent | 76 (55.1) | 422 (62.7) | |
| Temporary | 28 (20.3) | 113 (16.8) | |
| Daily employee | 34 (24.6) | 138 (20.5) | |
| Job satisfaction level | 0.0022 | ||
| satisfaction | 151 (58.1) | 1,164 (67.7) | |
| dissatisfaction | 109 (41.9) | 555 (32.3) | |
| Smoking | 0.4982 | ||
| Never | 157 (60.4) | 997 (58.0) | |
| Past | 43 (16.5) | 301 (17.5) | |
| Current | 60 (23.1) | 421 (24.5) | |
| Alcohol consumption | 0.0293 | ||
| Never | 112 (43.1) | 656 (38.2) | |
| Past | 37 (14.2) | 180 (10.5) | |
| Current | 111 (42.7) | 883 (51.3) | |
| Physical activity | 0.6653 | ||
| non-regular | 180 (69.2) | 1,167 (67.9) | |
| regular | 80 (30.8) | 552 (32.1) | |
| Pain sitesb | |||
| Head | 5 (1.9) | 27 (1.6) | 0.6747 |
| Upper extremes | 79 (30.4) | 376 (21.9) | 0.0024 |
| Chest & abdomen | 2 (0.8) | 6 (0.4) | 0.3198 |
| Back & lumbar | 110 (42.3) | 495 (28.8) | <.0001 |
| Lower extremes | 124 (47.7) | 515 (30.0) | <.0001 |
| Total number of pain site | <.0001 | ||
| None | 87 (33.4) | 904 (52.6) | |
| 1 | 57 (21.9) | 326 (19.0) | |
| 2 | 48 (18.5) | 240 (14.0) | |
| ≥ 3 | 68 (26.2) | 249 (14.4) | |
| Pain severity | <.0001 | ||
| None | 87 (33.5) | 904 (52.6) | |
| Mild | 45 (17.3) | 264 (15.4) | |
| Moderate | 34 (13.1) | 171 (9.9) | |
| Severe | 94 (36.2) | 380 (22.1) | |
| Diagnosed chronic disorders | |||
| Hypertension | 86 (33.1) | 470 (27.3) | 0.0552 |
| Diabetes | 28 (10.8) | 202 (11.8) | 0.6453 |
| Lung diseasesc | 9 (3.5) | 26 (1.5) | 0.0263 |
| Liver diseasesd | 4 (1.5) | 47 (2.7) | 0.2569 |
| Cardiovascular diseasese | 13 (5.0) | 69 (4.0) | 0.4573 |
| Psychiatric diseasesf | 7 (2.7) | 31 (1.8) | 0.3305 |
| History of traffic accidents | 33 (12.7) | 224 (13.0) | 0.8797 |
| *WoLES: working life expectancy scale a Occupational classifications were regrouped into four of the ten major categories of the International Standard Classifications of Occupations, according to skills and duties: white collar workers (managers, professionals, technicians, and associate professionals), pink collar workers (clerical support, service, and sales workers), green collar workers (skilled agricultural, forestry, and fishery workers), and blue collar workers (crafts and related trades, plant and machine operators and assemblers, and elementary occupations). b We regrouped thirteen pain sites into five parts according to human anatomical system: head, upper extremes (shoulder, arm, wrist, and finger), chest & abdomen, back & lumbar (waist and hip), and lower extremes (leg, knee, ankle, and toe) with multiple responses c Lung diseases: bronchiolitis and emphysema. d Liver diseases: all liver disorders excluding fatty liver. e Cardiovascular diseases: myocardial infarction, angina, and heart failure. f Psychiatric diseases: depression, anxiety, insomnia, excess of stress, and senile psychosis. |
|||
The multiple logistic regression models were used to calculate OR and 95% CI for the lower-WoLES group according to the nature of pain (Table 3). As the number of sites with pain and severity of pain increased, the possibility of being included in the lower-WoLES group increased (p for trend <0.001 in both). After adjustment for all covariates, ORs and 95% CIs of the lower-WoLES group in relation to the number of pain sites were as follows: no site, reference; 1 site, 1.75 (1.20-2.55); 2 sites, 1.99 (1.32-3.02); and ≥3 sites, 2.28 (1.51-3.41). With respect to the total pain severity, ORs and 95% CIs of the lower-WoLES group versus the reference group with no pain were as follows: mild pain, 1.74 (1.16-2.61); moderate pain, 2.02 (1.28-3.22); and severe pain, 2.12 (1.46-3.08).
| Odds ratio (95% confidence interval) for Lower-WoLES* | ||||
|---|---|---|---|---|
| Crude model | P for trend | Full adjusted model | P for trend | |
| *WoLES: working life expectancy scale Full adjusted logistic models were adjusted for age, sex, household income, marriage status, residence, occupational classification, type of employment, working status, job satisfaction level, health behavioral factors such as smoking, drinking, and physical activity, chronic diseases (hypertension, diabetes, chronic lung disease, liver disease, and cardiovascular disease), and history of traffic accidents. |
||||
| Total pain site | <.0001 | <.0001 | ||
| None | 1.00 (reference) | 1.00 (reference) | ||
| 1 | 1.82 (1.27-2.60) | 1.75 (1.20-2.55) | ||
| 2 | 2.08 (1.42-3.04) | 1.99 (1.32-3.03) | ||
| ≥3 | 2.84 (2.01-4.01) | 2.28 (1.51-3.42) | ||
| Pain severity | <.0001 | <.0001 | ||
| None | 1.00 (reference) | 1.00 (reference) | ||
| Mild | 1.77 (1.21-2.60) | 1.74 (1.16-2.61) | ||
| Moderate | 2.07 (1.35-3.17) | 2.02 (1.28-3.22) | ||
| Severe | 2.57 (1.88-3.52) | 2.12 (1.46-3.08) | ||
To the best of our knowledge, this is the first research to investigate the relationship between pain and WoLES in older workers. In this study, respondents reporting pain were more likely to be pessimistic regarding WoLES, a trend that increased with the number of pain sites and pain severity. Furthermore, potential confounding factors such as the presence of chronic diseases did not attenuate this result, showing that pain affects WoLES independently of chronic diseases and other risk factors. Most workers hope to continue working even after developing a work disability5). However, our study shows that workers who suffer from pain might give up hope of continuing to work. Hence, we consider worker pain an important social issue with regard to sustainable working life in aging workers.
There are various possible explanations for these findings. Work ability and performance generally decrease with age, but workers with pain are less likely to participate in the labor force and have reduced work ability and performance compared with those without pain26,27). Older workers, even those with pain, may not consider leaving the workplace until their performance falls below their own standards28); indeed, they are often eager to continue work until they can no longer meet job demands29). However, pain may cause a decline in task ability to a point at which the worker can no longer perform effectively.
Furthermore, pain may be related to psychological problems. Various studies have reported pain to be associated with psychological disorders such as cognitive impairment, anxiety, and depression, often as a cause or effect30,31). Some studies have suggested possible mechanisms for this relationship32,33), highlighting the important role of neurobiological interactions34). Pain shares a pathway in the central nervous system with both cognition and mood35); that is, peripheral nociception and noxious stimuli activate the same pathway involved in depression and cognitive impairment. Indeed, both serotonin and norepinephrine act as key mediators for pain as well as cognition, anxiety, and depression35). The hypothalamic-pituitary-adrenal axis, which regulates the stress response, has also been suggested as a possible link between mental illness and physical stressors such as pain34). It is well known that cognitive function declines with age, and this cognitive impairment is significantly associated with reduced workplace performance and safety36,37). Anxiety and depression are also related to reduced work ability38). Indeed, the contribution of mental health status to prolong the working life among older workers should be substantial39). The determinants of work ability could be impacted by self-rated job performance and workplace safety40). Thus, pain may aggravate mental as well as physical problems in older workers, further impairing their work performance and placing them at greater risk of an accident. These impacts were shown in our results as worked with decreased WoLES had higher pain natures.
It is somewhat surprising that no attenuation of the association between pain and reduced expectation for sustainable working life was found after adjusting for chronic disease. As previously mentioned, chronic diseases can shorten working life25), and numerous studies have emphasized the importance of chronic disease management in older workers with regard not only to individual health but also to reducing socio-economic burdens8,41,42). We absolutely agree that chronic disease management is important, but the present study suggests that pain may shorten working life independently of chronic disease, making understanding and management of pain a potential major target in efforts to extend working life.
This was the first attempt to investigate the relationship between pain and WoLE in aging workers. The work sustainability is a multidimensional condition and thus hard to assess among workers. Nevertheless, an individual's specific work demands, health conditions, and mental status linked to the perception of workers are important factors for work sustainability43). A previous study indicated self-rated work ability is useful for investigation as well as in clinical practice to assess work sustainability44). For example, even a single and simple one question survey about self-rated work ability could be used as a strong predictor for workers' sick leave45). We hoped to demonstrate the concept role of elders' perception of WoLES like self-rated work ability. Our study showed decreased WoLES with increased total pain sites or severity. It can therefore be assumed that the self-rated WoLES were linked to workers' health status or working conditions among the aging working population. A further study with more focus on self-rated WoLES is therefore suggested.
The strength of this study is that it controlled for numerous possible covariates using data from a well-established survey of a nationally representative population. However, the study has several limitations. First, its cross-sectional design prevents the establishment of causal relationships between pain and reduced WoLE in older workers. Second, our study relied on self-report questionnaires rather than medical examination for its data on pain and chances of WoLE. The lack of objective clinical measurements of pain might have resulted in inaccurate assessment of the relationship between pain and WoLE. Also, pain tolerance differed by age, gender, race, or social circumstance46). However, WoLE might be affected differently when pain is of unknown origin or nature. Furthermore, self-reporting of the sites and severity of pain is considered an effective method in the field of pain medicine22). As for WoLE, we did not investigate it in an occupational medicine setting, but merely through answers to a simple question. However, there is no consensus on the appropriate method for measuring WoLE, and previous studies indicate that self-perceived working ability and willingness to work, as measured by us, are important in extending working life47). Third, a note of caution is due here since the number of study participants might be too small for an overall survey sample size. Our study only targeted the working population at panel survey time. Thus, a high proportion of economic inactive subjects was excluded from the analysis. These results therefore need to be interpreted and applied to general aging working population with caution.
Our large cross-sectional study including an older working population showed the relationship between pain (both total pain sites and severity) and WoLE. This association was not attenuated even after adjustment for age, sex, population of area of residence, household income, education, marriage status, alcohol consumption, smoking behavior, physical activity level, chronic disease (hypertension, diabetes, lung disease, cardiovascular disease, and psychological disorders), and history of traffic accidents. Our results suggest that pain management should be considered a key factor in extending sustainable working life in aging workers, particularly for those with pain at multiple sites or severe pain.
Conflicts of interest: The authors declare no conflicts of interest.
Acknowledgments: The authors would like to thank the participants of KLoSA for the opportunity for performing this research.