Originals
Pulmonary responses in rat lungs after intratracheal instillation of 4 crystal forms of titanium dioxide nanoparticles
2016 年 58 巻 6 号 p. 602-611

詳細
2016 年 58 巻 6 号 p. 602-611
Objective: Titanium dioxide nanoparticles are widely used as UV filters in cosmetics and as a photocatalyst. We evaluated pulmonary responses to different crystal forms of TiO2 nanoparticles. Methods: We used 4 different TiO2 samples with similar specific surface areas (anatase, rutile, amorphous, and P25). Each sample was suspended in distilled water and intratracheally instilled to male Wister rats at the dose of 1 mg per rat. Five rats per group were sacrificed at 3 days, 1 month, and 6 months after instillation, and bronchoalveolar lavage fluid was collected from the right lung to determine the total cell count and polymorphonuclear cell (PMN) counts. The left lung tissues were stained with hematoxylin and eosin for the evaluation of inflammation and with elastica van Gieson for the evaluation of collagen deposition. Results: The total cell counts and PMN counts of the amorphous and P25 of four samples showed a significant increase compared with the control group at 3 days after instillation. The inflammation rate of P25 also showed a significant increase compared with controls at 3 days. The collagen deposition rate in the alveolar duct of P25 increased significantly compared with controls from 3 days to 6 months. The other samples showed a mild response after instillation. Conclusion: Although the TiO2 nanoparticles used in this study had similar specific surface areas, there were different inflammatory responses in the rat lungs. Other factors, such as different production processes or the surface activities of particles, may have been responsible for the different responses.
With recent advances in material science, workers are now handling new materials that did not previously exist, such as engineered nanomaterials. The post-exposure biological effects of such new materials are of serious concern. The mass concentration of aerosolized dust particles is used as the basic index for the threshold exposure limits of materials, but the biological effects of engineered nanomaterials are thought to be different from those of the corresponding bulk materials that are subject to the present regulations. Prior to any toxicity studies of these nanomaterials, the following physicochemical properties of the samples should be identified: particle size and/or size distribution, specific surface area, crystal structure/crystallinity, aggregation status, surface coatings, surface reactivity, method of synthesis, and purity of sample1).
Titanium dioxide (TiO2) nanoparticles are widely used as photocatalysts and in cosmetics. Pigment grade TiO2 seems to be a less harmful substance, but there is some concern about its pulmonary toxicity and dermal absorption2). Titanium dioxide nanoparticles are commercially produced from TiCl4 using hydro-carbon assisted flame synthesis, i.e., the so-called "chloride process." In Japan, TiO2 nanoparticles are also produced by the so-called "sulfate process," where the hydrolysis of the titanyl sulfate (TiOSO4) yields hydrated titanium dioxide and then heating of the solid in a furnace evaporates the water and decomposes any remaining sulfuric acid in the solid. Crystals of the TiO2 produced by both methods may also be coated with another substance, such as aluminum oxide or silica3). Several other methods have also been developed recently to synthesize TiO2 nanoparticles by either pyrolysis reactions or hydrolysis methods4).
Jiang et al.5) measured the levels of reactive oxygen species (ROS) produced by various types of gas-phase-synthesized TiO2 particles in vitro, and reported that 30-nm particles had the highest ROS production per unit surface area, and that the ROS production level decreased depending on the crystal form in the following order when the particle sizes were the same: amorphous, anatase, anatase/rutile, and rutile.
Both anatase and rutile TiO2 particles are widely used. An inhalation exposure test using rats performed by Ferin and Oberdorster6) demonstrated no differences in biological responses between the rutile and the anatase nanoparticles. Afterwards, another inhalation exposure test showed that more severe pulmonary inflammatory responses were induced by ultrafine (nano-size) TiO2 particles than by larger (submicron-size) TiO2 particles, and the biological effects of nanoparticles have since become a serious concern7).
Evaluation of the pulmonary toxicity of airborne nanomaterials involves exposing animals to nanomaterials by inhalation (OECD Test Guideline 412, 413). Bermudez et al.8) assessed pulmonary responses of rats, mice, and hamsters to inhaled P25 nanoparticle aerosols, in which pulmonary inflammation and retardation of particle clearance was evident in rats and mice exposed to 10 mg/m3 for 13 weeks. However, many institutes are unable to easily design and conduct inhalation tests of any modified or newly developed products.
Intratracheal instillation is a technique that is appropriate for evaluating the possible hazards of nanomaterials, but it is less appropriate for deriving threshold values and quantitatively assessing risk. Warheit et al.9,10) proposed pulmonary bioassay bridging studies between inhalation exposure and intratracheal instillation. A bridging study can serve as screening when assessing the safety of newly developed or modified samples compared with reference samples11).
In this study, we intratracheally administered 4 kinds of nano-size TiO2 samples with similar specific surface areas (100 m2/g) to male Wister rats at the dose of 1 mg. To evaluate the difference of toxicity among the samples with different crystal forms, the numbers of total cells and polymorphonuclear cells (PMN) counts in the bronchoalveolar lavage fluid (BALF) of each right lung were determined to measure inflammatory changes, and the left lung tissue was used for histopathological examinations.
We used four nano-size TiO2 samples: anatase, rutile, amorphous, and P25. Details of the samples are shown in Table 1. The samples of anatase and rutile were produced by the "sulfate process" without any surface treatment, as per the manufacturer's information. The sample of amorphous was a chemical supply and there was no information about its production. The P25 was synthesized by the "chloride process" and we used a de facto standard sample for toxicity of nano-size TiO2 samples. These samples were gifts from the manufacturers except for the sample of amorphous.
| Sample | Company | Manufacturing process | BET surface area (m2/g) | Sauter mean diameter* (nm) | Crystallite size (nm) | Hydrodynamic mean diameter** (nm) | |
|---|---|---|---|---|---|---|---|
| Anatase | Rutile | ||||||
| *Sauter diameter = 6 / (density of materials x surface area) **Cumulants mean size of suspensions in distilled water measured by DLS (Malvern Zetananosizer S) |
|||||||
| Anatase AMT-400 | TAYCA corporation |
Sulfate process | 102 | 15 | 16.9 | – | 737 |
| Rutile MT-150W | TAYCA corporation |
Sulfate process | 102 | 14 | – | 15.5 | 348 |
| Amorphous | Wako Pure Chemical Industries | NA | 110 | 14 | 6.1 | – | 226 |
| P25 | EVONIK Industries |
Chloride process | 53.8 | 28 | 23.5 | 35.9 | 205 |
The specific surface areas of these four samples were measured by a BET apparatus. Based on the BET theory12), the specific surface areas were measured by N2 absorption onto the samples using a Quantachrome Instruments NOVA-1200 (Boynton Beach, FL, USA) by the Ube Scientific Analysis Laboratory (Ube, Japan). The specific surface areas of the samples and calculated Sauter diameters are shown in Table 1.
Powder XRDs for the TiO2 samples were carried out by Rigaku RINT-TTR III (Rigaku Co., Tokyo), of which the wavelength of X-ray (Cu Kα) operated at 300 mA and 50 kV was 0.154 nm. The XRD patterns were obtained at a scanning rate of 5 deg/min over a range of 5 to 100 deg (2θ) by the Ube Scientific Analysis Laboratory (Ube, Japan). Microphotographs of the samples were observed by a scanning electron microscope (Hitachi S-4500, Tokyo, Japan).
Preparation of Sample SuspensionsBulk TiO2 powder was dispersed in sterile purified water by sonication for total 15 min using an ultrasonic sonicator (Sonifier 250, Branson, USA) to minimize the particle diameter in distilled water without any dispersant. The size distributions of the TiO2 particles in the suspensions were measured by the dynamic light scattering method (DLS, Zetasizer Nano S, Marvern). All the samples showed that the majority of the particles in the suspensions were agglomerates but we did not remove these particles in order to keep the values of specific surface area measured by the BET method.
AnimalsMale Wistar rats (8 weeks old) were purchased from Kyudo Co., Ltd. (Kumamoto, Japan). The animals spent one week in the Laboratory Animal Research Center of the University of Occupational and Environmental Health with a commercial diet and water provided ad libitum. The rat body weights were 320±15 g at the start of exposure (9 weeks old). All procedures involving the handling of animals followed the Japanese Guide for the Care and Use of Laboratory Animals as approved by the Animal Care and Use Committee, University of Occupational and Environmental Health, Japan.
Intratracheal InstillationRats were instilled at a dose of 1 mg (3.1 mg/kg) for all samples. That dose is between the 1 mg/kg and 5 mg/kg doses chosen by Warheit et al.10). In our previous report13), the intratracheal instillation of 1 mg/rat TiO2 (P90, Evonik) induced a moderate and transient inflammation in rat lung, while 0.2 mg/rat did not. The TiO2 concentration in the instillation liquid was adjusted to 2.5 mg/ml of TiO2 nanoparticles in distilled water. The sample suspension (0.4 ml) was intratracheally instilled once to diethylether anesthetized animals by a syringe through a catheter inserted into the airway. A control group was exposed to distilled water. The intratracheal instillations were conducted twice, that is, the anatase group and rutile group, or the amorphous group and P25 group with each control group, but administered by the same operator.
Bronchoalveolar lavage fluid (BALF)Five rats for each dose were dissected at 3 days, 1 month, and 6 months after instillation. The rats were sacrificed by exsanguination from the heart under deep anesthesia by intraperitoneal injection of pentobarbital, and then the lungs were removed from the chest cavity. BALF was collected by inserting a cannula into the right lung via the respiratory tract, with the left main bronchus clamped, and pouring in a physiological saline (5 to 10 mL each). Fifty ml of BALF was centrifuged (1500 rpm; 10 min) to separate the cellular components. After 1 mL of buffer was added and stirred thoroughly, they were examined for macrophages and neutrophils (cell/μL) with an automatic blood cell counter (Celltac MEK 5204 Nihon Koden, Tokyo). The results were used as the total number of cells in the BALF.
From the above samples, smears were prepared on glass slides by the CytoSpin method and stained by a Diff-Quik kit (Sysmex Co., Kobe, Japan). These slides were observed by an optical microscope at ×400 magnification; 200 cells per slide were differentially counted and the percentage of neutrophils was calculated. The alveolar macrophages (AM) and PMN in the BALF were identified by their shape. The number of PMN in the BALF was obtained by multiplying the percentage of PMN by the total number of cells.
Histopathology of rat lungsThe left lung of each rat (the clamped side in the BALF collection) was fixed with 10% buffered formalin at 25 cmH2O pressure overhead. Paraffin sections of the left lung (3 μm thickness) were stained with hematoxylin-eosin (HE) and elastica van Gieson (EVG) by Hist Science Laboratory Co., Ltd. (Tokyo, Japan).
1) Point counting method for HE stainingAfter each specimen was stained, six digital images of each lung section, focusing mainly on the alveoli and excluding the large vessels and trachea, were photographed with a digital camera (DS-5M; Nikon Instech Co. Ltd., Kanagawa, Japan) under light microscopy at ×100 magnification. In order to eliminate measurer bias, a third person randomly assigned numbers from 1 to 90 to microscope photographs (3 doses ×5 animals ×6 photographs) per time point and returned them to the measurer. After completion of measuring, the photographs were returned to the original order by using a conversion table. A 300-point grid was placed over each image on a computer screen and the measurer examined pulmonary inflammation at each time point using the point counting method (PCM)14-16). The accumulation of macrophages and PMN was counted mainly as inflammatory change. The rate of points of inflammation was calculated, as shown below:
I = X/300
where I is the inflammation rate and X is the number of inflammation points among 300 points.
2) Point counting method for EVG stainingTo evaluate the extent of fibrosis, digital images were taken of sections stained by the elastica van Gieson method. Two images were captured by ×400 magnification at the alveolar duct region and the pleura region, and each image was recaptured through polarized light. The birefringent areas (collagen positive) and interstitium areas were analyzed by the PCM. The rate of collagen deposits (points where there were birefringent areas) for each section was calculated as follows:
CD = (Number of birefringent points in parenchyma) / (total number of points in the lung parenchyma)
where CD is the collagen deposited rate.
Statistical analysisResults are presented as means ± standard deviation. The results were compared with the Mann-Whitney U-test, with differences of ρ<0.05 or less considered to be statistically significant. Statistical analysis was performed using IBM SPSS Statistics 19 (IBM Corp., Armonk, NY).
X-ray diffraction patterns and scanning electron microscope images of the 4 samples are shown in Fig. 1. Fig. 1A and 1B show that there were TiO2 nanoparticles in the anatase (the major diffraction angle of 25.3°) and in the rutile (the major diffraction angle of 27.4°), respectively. Fig. 1C shows amorphous particles, with a broad peak of the anatase crystallites. The P25 nanoparticles contained both anatase and rutile crystallites; the amount of anatase was larger than rutile, indicated by a 10-fold higher X-ray diffraction peak (Fig. 1D). The crystallite sizes of the TiO2 using the Scherer equation were estimated as shown in Table 1.

X-ray diffraction analysis (XRD) of TiO2 particles. (A) Anatase, (B) Rutile, (C) Amorphous, (D) P25. Scanning electron micrographs of TiO2 particles: (A) Anatase, (B) Rutile, (C) Amorphous, (D) P25.
The BET surface areas of the TiO2 nanoparticles of both the anatase and rutile were 102 m2/g, while those of the amorphous and P25 were 110 m2/g and 53.8 m2/g, respectively. Except for the P25, the BET areas of the TiO2 nanoparticle samples were similar. The Sauter diameters, defined as the diameter of equivalent surface sphere, were 14 nm for both the anatase and rutile, 15 nm for the amorphous particles, and 28 nm for the P25. Images of each of the samples are shown in Fig. 1 with the Sauter diameter indicated (white circle).
Hydrodynamic diameters of sample suspensions are shown in Table 1. In the table, we showed the cumulants mean size (nm) of the DLS.
Bronchoalveolar lavage fluid (BALF)The total cell counts and PMN counts in the BALF are shown in Fig. 2A and 2B, respectively. The experiment process was conducted twice, and the differences from the corresponding control groups were examined for statistical significance. The total cell counts 3 days after administration were significantly higher in the group with instillation of amorphous (the amorphous group) and in that with instillation of P25 (the P25 group), whereas the groups with instillation of anatase or rutile (the anatase or the rutile group) were undistinguishable. There were no significant increases in any sample beyond 1 month after administration.

Total cells counts in BALF (A) and PMN counts in BALF (B).
Similar to the changes in the total cell counts, the PMN counts 3 days after administration were significantly higher in the amorphous group and in the P25 group. Changes were largest in the amorphous group, and then in the P25 group. The rutile group and the anatase group showed similar differences, which were much smaller than those seen in the amorphous group and the P25 group. None of the groups showed significant differences beyond 1 month after administration.
HistopathologyHE-stained images of lung tissues 3 days after administration of each nanoparticle sample are shown in Fig. 3. Inflammation was observed in the amorphous group (Fig. 3C) and the P25 group (Fig. 3D); it was particularly severe in the alveolar ducts in the P25 group. Notable inflammation was not observed in Fig. 3A and 3B but macrophages phagocytizing particles are also observed. Gradual alleviation was observed 1 month after administration, and further improvement was seen 6 months after administration (data not shown).

Representative image of rat lung sections with HE stain at 3 days after intratracheal instillation (×200): (A) Anatase, (B) Rutile, (C) Amorphous, (D) P25, and (E) control
Polarizing light microscopy images of EVG-stained sections of lungs 6 months after administration are shown in Fig. 4. The shiny regions indicate the existence of collagen fibers.

Representative image of rat lung sections with EVG stain at 6 months after intratracheal instillation (×200, polarized): (A) Anatase, (B) Rutile, (C) Amorphous, (D) P25, and (E) control.
The levels of inflammation in the lung tissues assessed by the point counting method are shown in Fig. 5A. A significant increase was seen only in the P25 group. The P25 group showed the largest change, followed by the amorphous group, the rutile group and then the anatase group. However, such changes were seen only 3 days after instillation, and no significant changes compared with the control group were confirmed in any of the four groups beyond 1 month after instillation.
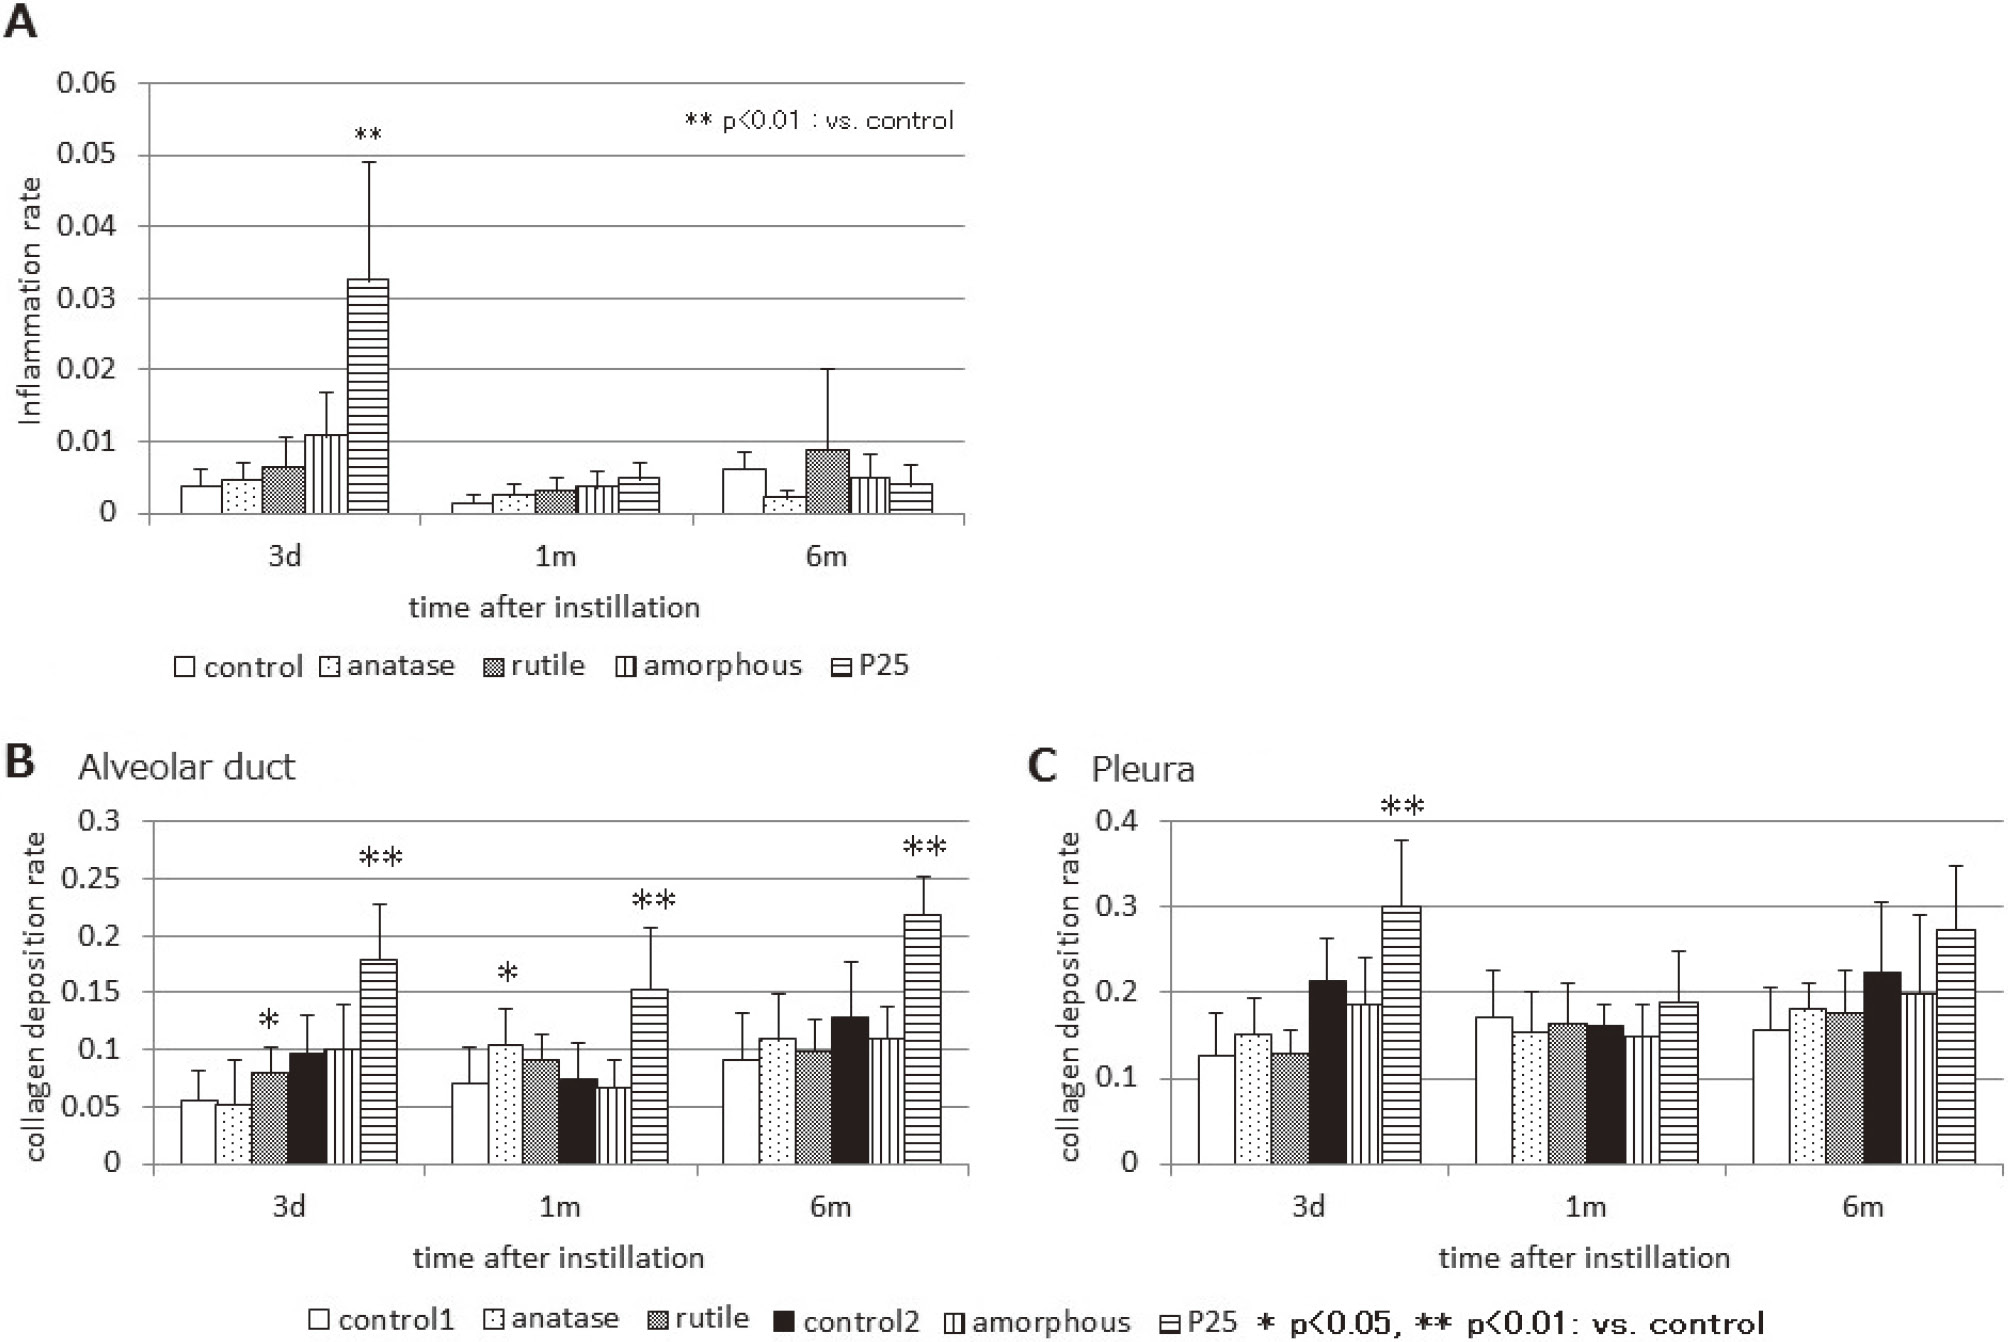
The inflammation area rate (A) by point counting method (PCM) after instillation. In the P25 group, inflammation rate raised significantly with control at 3days after instillation. Collagen deposition rate by point counting method: (B) alveolar duct, and (C) pleura.
The level of collagen deposition was assessed by the point counting method (Fig. 5B and C). When the P25 group was compared with the control group, the collagen deposition rates were significantly higher (p<0.01; Mann-Whitney U test) in the alveolar ducts 3 days, 1 month, and 6 months after instillation (Fig. 5B), and in the pleura 3 days after instillation (Fig. 5C). The collagen deposition rates in the pleura in the P25 group 1 month and 6 months after instillation were higher than in the control group but not statistically significant. The rutile group and the anatase group showed significantly higher values than the control group (p<0.05) in the alveolar ducts 3 days after instillation and 1 month after instillation, respectively.
The sizes of the crystallites in the anatase and rutile phases were larger than the corresponding Sauter diameters, while those in the amorphous and P25 nanoparticles were smaller than the corresponding Sauter diameters, as shown in Table 1. These findings suggest that the anatase and rutile samples were agglomerates of monocrystalline primary particles, while the amorphous and P25 samples were partial aggregates wherein crystallites adhere to each other and the surface area is reduced.
The characteristics of the sample suspensions are important for in vitro and instillation tests. In this study, as we focused on received bulk sample characteristics, such as BET surface areas and XRD, we did not use any dispersants or size control technique of the suspension. Cumulants mean sizes were more than 100 nm, as shown in Table 1.
In our previous study13), the suspension of TiO2 nanoparticles in distilled water were centrifuged for 20 min at 8,900 ×g and then the supernatants were instilled as the samples. The hydrodynamic diameter of well-dispersed TiO2 nanoparticles was 25 nm measured by DLS.
Warheit et al.10) measured the hydrodynamic diameter of TiO2 nanoparticle agglomerates in the suspensions with dispersant (tetrasodium pyrophosphate, 0.1 wt%) and phosphate buffer solution (PBS), of which hydrodynamic diameters were ranging from 130 to 382 nm with dispersant and from 2144 to 2890 nm with PBS and they instilled the sample suspensions with PBS to rats.
Zeta potentials of the samples were not measured in this study. The zeta potential of P25 with distilled water was +27 mV reported by Rushton et al17). Other study reported that the zeta potential of pure anatase nanomaterial with distilled water was +35 mV and that of pure rutile nanomaterial with distilled water was -33 mV18). Our previous study19) showed the zeta potentials tend to be negative for rutile and positive for anatase (both not used in this study) and medium for the amorphous (used in this study) in a buffer solution. So, zeta potentials of the samples with distilled water may be reflected by the crystal forms of the samples.
Bermudez et al.8) exposed rats (F344), mice (B3C3F1/CrlBR), and hamsters to P25 nanoparticles by inhalation for 13 weeks, and found that the biological effects of P25 inhalation exposure were more prominent in the rats than in the mice and hamsters. When rats were exposed to P25 at the concentration associated with biological effects (10 mg/m3, mass median aerodyanamic diameter = 1.37 μm), the level of deposition in each lung was 2.1 mg. In our previous study13), the average pulmonary retention of TiO2 was 0.56 mg at 3 days after intratracheal instillation of 1 mg of TiO2 nanoparticles (P90) and the rest of the TiO2 was cleared. The retention is close to the amount of pulmonary retention seen after 13 weeks inhalation exposure to P25 particles at a concentration (2 mg/m3) that did not cause a biological effect8). In the present study, we found positive biological effects after intratracheal instillation of 1 mg/rat for P25 TiO2 samples. These biological effects may be enhanced by single bolus dose of the samples by direct injection to lung.
In the present study, we examined pulmonary responses to four crystal forms of TiO2 nanoparticles with the same doses in both weight and surface area, and found that they caused considerably different levels of inflammation: amorphous>P25>> rutile=anatase, 3 days after administration (see Fig. 2). The inflammation levels were not significantly different beyond 1 month after administration in all conditions. The changes seen 3 days after administration in the amorphous group and the P25 group in the present study (Fig. 2) were in good agreement with the significant increases in total cell count and PMN count in BALF 3 days after intratracheal instillation of 1 mg of well-dispersed TiO2 (P90)13).
Höhr et al.20) investigated the acute inflammatory response in rat lungs after intratracheal instillation of surface modified (hydrophilic and hydrophobic) fine and ultrafine TiO2 particles. The responses, such as total cell counts and PMN counts in BALF, were significantly related to the administered surface dose and there were no statistically significant differences between hydrophilic and hydrophobic TiO2 particles at the dose of 1 mg. Rehn et al.21) reported that rats instilled with a single dose of 0.15-1.2 mg of P25 or silanized TiO (hydrophobic surface) nanoparticles showed no signs of inflammation. In contrast, a strong progression in the lung inflammatory response was observed in quartz-exposed rats (0.6 mg).
Warheit et al.9,10) reported that transient neutrophil infiltration in the lung of SD rats was observed at a dose of 5 mg/kg but was not observed at a dose of 1 mg/kg after intratracheal exposures to three kinds of TiO2 made by DuPont, but at a dose of 5 mg/kg of P25 a moderate and transient inflammation was observed, although not with 1 mg/kg. They concluded that the ranking of lung inflammation and histopathological responses was Quartz>P25> newly developed TiO2 nanoparticles.
Bonner et al.22) used a P25-administered group as a reference to examine inter-laboratory differences in the biological effect to compare other types of TiO2 nanoparticles administered by laryngeal aspiration or tracheal instillation to mice and rats. The measured inflammation due to administered TiO2 nanoparticles varied depending on the laboratories: some found the severest inflammation with P25 administration, while others did not.
Kobayashi et al.23) controlled TiO2 nanoparticle agglomerates in the suspensions, of which hydrodynamic sizes ranged from 20 nm to 200 nm using dispersant (disodium phosphate, 0.2-1.3 wt%). The authors concluded that there was no clear relationship in pulmonary inflammation among the rats instilled samples with the same primary size but different particle agglomerations.
Warhait et al.10) speculated that the difference in inflammatory responses to TiO2 samples was caused by the production process of P25, which does not include an aqueous or wet surface treatment step to neutralize and remove the acidic chloride ions from the surface of the particles to preserve the photo-chemical activity of the TiO2. The difference between the anatase-group and the rutile-group vs. the P25-group in our results supports their speculation that the inflammatory responses to TiO2 depend on surface activity rather than crystal form.
The most important endpoints that have been associated with exposure to respirable particles include chronic persistent inflammation, fibrosis, and cell proliferation in the lungs and mesothelial lining. All the HE-stained lung specimens showed macrophage phagocytosis of nanoparticles 3 days after instillation (Fig. 3).
In order to quantitatively assess the overall levels of pulmonary inflammation, we employed PCM and examined the images of a considerable lung area of each HE-stained section (Fig. 5A). The changes became smaller in the following order: P25>amorphous>rutile>anatase. However, such differences were seen only 3 days after instillation, and time-dependent increases in the level of inflammation, as seen after exposure to silica24), were absent. Both the amorphous group and the P25 group showed total cells and PMNs counts increase (amorphous >P25) in Fig. 2 but inflammation level evaluated by PCM was high in the P25 group only as shown in Fig. 5A. From our previous studies15,16), PCM reflects to the inflammatory reaction of the lung section, such as hyperplasia of alveolar cells in addition to the infiltration of macrophages or PMNs. The P25 group may have more inflammatory effect for lung tissue than the amorphous group.
Bermudez et al.8) demonstrated that inhalation exposure to P25 (10 mg/m3) caused the accumulation of inflammatory cells and thickening of type II cells in the alveolar ducts. Warhait et al.10) reported the accumulation of P25-containing macrophages in the lung tissue of a rat exposed to P25 (5 mg/kg) at 3 months post-instillation, although exposure to other TiO2 nanoparticles produced no adverse pulmonary effects.
After an intratracheal instillation of well-dispersed P90 TiO2 nanoparticles to rats13), accumulations of alveolar macrophages, which phagocytosed the particles, were observed from the terminal bronchioles to the alveolar ducts and alveolar spaces in the 1 and 3 mg-administered groups. Interstitial changes were also observed around these inflammatory changes 3 months after instillation.
We used PCM to evaluate collagen deposition in the lung tissues stained by the elastica van Gieson method, selecting the alveolar duct and pleura, where the initial deposition of collagen is often observed. In our previous study14), we showed an increasing fibrogenic pattern of crystalline silica by PCM enhancing the collagen-positive sites through polarized light. Collagen deposition analysis using PCM could show the different patterns of collagen deposition in a time course after instillation of several sample materials.
In Fig. 4D, the image of lung in which P25 was instilled shows remarkable collagen depositions (bright areas) at the alveolar duct 6 months after instillation. Other images showed moderate collagen depositions at the similar location. The results of point counting showed that collagen deposition in the alveolar ducts was not cleared and the levels remained significantly high even 6 months after administration in the P25 group (Fig. 5B). Significant collagen deposition in the pleura was present only on the third day after administration (Fig. 5C). Significant changes were seen in the other groups, too, but were thought to be within the fluctuation range.
The Japan Society for Occupational Health finally recommended the occupational exposure limit of 0.3 mg/m3 for TiO2 nanoparticles25) based on the NOAEL of 2 mg/m3, which was reported by Bermudez et al.8) in a 13-week inhalation exposure test using P25. The results of this and previous studies indicated a relatively strong inflammatory reaction to P25, and thus it is likely that the above limit is on the safe side. Various surface modifications are used for TiO2 nanoparticles depending on their applications, and such surface-modified particles have distinct properties. As shown in the present study, bridging studies where the results of intratracheal instillation of TiO2 nanoparticles are compared with those of P25 will be effective for evaluating the biological effects of individual types of TiO2 nanoparticles.
It is generally thought that the pulmonary inflammation caused by nanoparticles increases when particle diameters become smaller and specific surface areas become larger, even with the same material. However, in this study, the most severe fibrosis was found in the P25 group, even though the BET the particle diameter was larger and the specific surface area was smaller than other types of TiO2 nanoparticles. Considering the differences in the crystal forms (rutile versus anatase) confirmed by X ray diffraction, the production methods and the characteristics of nanoparticles (e.g., mixed-crystal phase and amorphous) are likely to determine their biological effects. This study suggests that the surface area is not the only determinant of the toxicity of nanoparticles, and other factors, such as surface properties and synthetic methods, need to be taken into account when assessing the toxicity of nanoparticles.
Acknowledgments: This research was funded by a Grant-in-Aid for Scientific Research (No. 22590566) of the Japan Society for the Promotion of Science titled: "Pulmonary effect of titanium dioxide and various particles by instillation to rats: in relation to surface area dose metrics."
Conflicts of interest: The authors have no conflicts of interest.