Abstract
Purpose: The aim of the present study was to develop a novel method for distinguishing white spot lesions (WSLs) from sound enamel in human premolars using micro-computed tomography (micro-CT) and scanning electron microscopy (SEM) with energy-dispersive spectroscopy (EDS), and to examine differences in surface morphology, chemical composition, and mineral density (MD) between these two areas.
Methods: Fourteen premolars with natural WSLs on the enamel surface of the crowns were examined. After sectioning the teeth, each specimen containing WSLs adjacent to intact enamel was examined for MD, surface morphology, and atomic percentages (At%) of chemical components using micro-CT and SEM/EDS, respectively. Differences between these areas of the same specimen were analyzed statistically using paired t-test.
Results: SEM images highlighted increased roughness and irregularity in the lesion area. EDS analysis revealed significant reductions in calcium (Ca), phosphorus (P), fluorine (F), chlorine (Cl), and sodium (Na) levels at the lesion surface in comparison to intact enamel (P < 0.05). The decreases in the MD of the lesions were statistically significant in comparison to sound enamel (P < 0.05).
Conclusion: These findings provide standard measurements for evaluating the essential characteristics of WSLs and intact enamel, being vital for assessment of treatment outcomes and development of innovative biomaterials for management of hypo-mineralized enamel lesions.
Introduction
The white spot lesion (WSL) is defined as subsurface enamel porosity caused by carious demineralization, appearing as a milky white opacity on smooth surfaces [1]. The prevalence of WSLs among orthodontic patients varies widely from 0% to 97%, and they are commonly observed as a side effect of orthodontic treatment, especially with fixed appliances [2]. WSLs can result from various factors, including the oral environment, host defense mechanisms, and cariogenic bacteria [3]. When acidic conditions, influenced by daily food consumption or the presence of oral bacteria, cause a reduction of pH to below a critical value of 5.5, enamel minerals begin to dissolve from the outer layer, progressing towards the inner layer, resulting in lesions that consist of precipitated mineral layers covering the dissolved inner area [4,5].
In orthodontic patients, WSLs commonly appear on the buccal surfaces of teeth around the brackets, particularly in the gingival area, due to difficulties in cleaning the teeth properly [6]. Several studies have reported rapid formation of WSLs within the first few weeks of bracket therapy, the prevalence increasing up to 40% within the initial 6 months of treatment [7,8]. Orthodontists need to carefully monitor the occurrence of WSLs during treatment and provide agents that promote chemical remineralization once WSLs have appeared. Fluoride remineralization is considered an essential treatment for early carious lesions and has long-lasting effects. The fluorapatite crystal formed through fluoride remineralization is more resistant to acid attack and less soluble than hydroxyapatite crystal (Ca10[PO4]6[OH]2) [9]. Upon fluoride remineralization, a CaF2 layer is deposited on the enamel surface, acting as a fluoride reservoir for further remineralization [10]. However, some studies suggest that this precipitated layer may hinder fluoride penetration into the subsurface area of the white spot lesion and can easily dissolve within one week [11].
To gain a better understanding of the chemical remineralization process and improve its efficiency for treatment of early carious lesions, there is a need to investigate the chemical components and structural differences between sound enamel and white spot lesions. The combined use of scanning electron microscopy (SEM) with energy-dispersive X-ray spectroscopy (EDS) and micro-computed tomography (micro-CT) has revolutionized the field of dentistry. SEM/EDS facilitates high-resolution imaging and precise elemental analysis, enabling detailed investigation of tooth surfaces, enamel composition, and characterization of dental lesions [12]. Meanwhile, micro-CT provides three-dimensional reconstructions of dental structures, allowing non-destructive examination of both external and internal features [13]. Recent studies have demonstrated significant mineral loss in white spot lesions in comparison to normal human enamel. Examination of the occlusal surface of enamel using SEM combined with EDS has revealed a significant paucity of calcium, phosphorus, and oxygen ions in early carious lesions relative to sound enamel [14]. However, the characteristics of pit-and-fissure caries may differ from those of smooth surface caries, which are more frequently encountered in orthodontic patients. Smooth surface caries typically shows a broad distribution and extends conically towards the dento-enamel junction (DEJ), whereas occlusal caries shows an inverted V shape with a narrow entrance and a wider area closer to the DEJ. Although a previous study investigated WSLs on smooth surfaces, it only identified a decrease in phosphate content, and did not detect any variations in other essential chemical components [15].
The present study was conducted to develop a method for investigating differences between sound enamel and natural WSLs using micro-computed tomography (micro-CT) and SEM with EDS techniques. Differences in surface morphology, essential chemical compositions, and mineral density (MD) between these two areas in extracted human premolars were also investigated.
Materials and Methods
Fourteen unidentified premolars with natural WSLs on mesial, distal, buccal, or lingual surfaces, extracted for orthodontic purposes, were included in this study. The sample size was determined using the G*Power program (version 3.1.9.7, Heinrich-Heine-Universität Düsseldorf, Germany), based on data from a previous study with an effect size (Cohen’s d) of 1.21, a significance level of 0.05, and a power of 90% [16]. While the target sample size was ten, fourteen teeth were collected in view of practical considerations. Teeth exhibiting cavitated lesions that could be examined using a dental explorer, visible crack lines, or those that had undergone root canal treatment were excluded. The teeth were collected from anonymous patients aged between 15 and 30 years between July and December 2021 to minimize any influence of age differences.
WSLs were detected using two combination methods. The first involved visual examination, for which the tooth surfaces were cleaned with pumice and air-dried for at least 5 seconds. Adequate light was used to visualize the WSLs. The pores within WSLs are filled with air, making opaque enamel lesions evident and distinct from the healthy enamel surface. The second method used fiber-optic transillumination (FOTI) (Microlux2, Addent, Inc, Danbury, CT, USA), which utilizes variations in refractive index when light passes through different tooth structures [17]. Demineralized enamel of WSLs appeared grayish, distinguishing it from natural tooth enamel. Both methods were able to distinguish WSLs from the surrounding sound enamel areas.
Each specimen, stored in 0.1% thymol solution, was prepared from a tooth surface approximately 3 × 3 × 3 mm in size using a low-speed diamond disc with cooling water. These specimens specifically targeted the area with the white spot lesion in the center, with an intact enamel area at the periphery (Fig. 1A). Then, all specimens were cleaned using an ultrasonic cleaner for 5 min and stored in deionized water before use.
Micro-computed tomography (micro-CT) was used to investigate mineral density (MD). The samples were scanned using a SkyScanner1173 high-resolution scanner with the following settings: 10 kV and 72 µA, AI filter 1.0 mm, exposure 500 ms, 180° rotation, and 8 µm voxel dimension. The reconstructed three-dimensional images of each specimen consisting of two regions of interest (ROIs) of identical size, the region covering the darker gray area of the WSL and the peripheral brighter gray area of the intact enamel, were selected from the sagittal (SAG) view (Fig. 1B) and analyzed for mineral density (MD; g/cm3) using NRecon (SkyScan, version 1.6.8.0). The images were analyzed using CTAn (SkyScan, version 1.16.1.0). For the ROI of WSLs, the upper boundary was determined from the highest level where the lesion was detected, and the lower boundary was the lowest level of the lesion. Due to the variation of natural WSLs, the lesion dimensions of all specimens were calibrated by analyzing the sizes in transverse (TRA), coronal (COR), and sagittal (SAG) views of the central part of the lesion volume in each specimen [18]. Since the ROIs of intact enamel were more consistent and less variable than those of the WSLs, they were used as the control MD of the sound enamel in this study.
The identified WSLs and the sound enamel areas from micro-CT were also utilized for locating each region in the specimen for examination using SEM at a magnification of ×400, coupled with EDS (JSM-6610LV, JEOL Ltd., Tokyo, Japan), in order to assess their morphological and chemical properties. Energy-dispersive X-ray acquisition was performed in high-vacuum electron mode with an accelerating voltage of 15 kV. The atomic percentages (At%) of calcium (Ca), phosphorus (P), fluorine (F), chlorine (Cl), oxygen (O), and sodium (Na) were recorded from both areas for each specimen.
The data were input and analyzed statistically using the SPSS statistical software package version 25.0 (IBM Corp. IBM SPSS Statistics for Windows, Version 25.0. Armonk, NY, USA). The mean and standard deviation of At% and MD values from all specimens were tested for normal distribution using the Shapiro-Wilk test. The baseline three-dimensional characteristics of the lesions were analyzed statistically using one-way repeated-measures ANOVA. The mean differences between the lesion and sound enamel on the same specimen were tested using a paired t-test. The null hypothesis (H0) of this study was that there would be no significant difference in variables between sound enamel and WSLs, and that the alternative hypothesis (H1) would be that the sample means for the sound enamel and lesion groups would differ significantly.

Fig. 1
(A) Each specimen was prepared to a size of approximately 3 × 3 × 3 mm to incorporate the area of WSL and sound enamel. (B) The baseline lesion dimensions were recorded in transverse (TRA), coronal (COR), and sagittal (SAG) views using three-dimensional sections obtained from the central part of the volume. Two regions of interest were selected from the sagittal (SAG) view where the green area was the lesion site and the yellow area was analyzed as the sound enamel.
Results
Figure 2 demonstrates the surface morphology of the WSL and sound enamel on the same specimen (Figs. 2A and 2B, respectively) revealed by SEM. The lesion area (Fig. 2A) exhibited roughness and irregularities in comparison to the smooth appearance of the sound enamel area (Fig. 2B). This visual difference highlighted the morphological distinction between WSLs and sound enamel. Furthermore, the three-dimensional characteristics of all WSLs analyzed (as mean [SD]) were 0.84 (0.75) µm in the TRA view, 0.58 (0.39) µm in the COR view, and 0.59 (0.4) µm in the SAG view, which did not differ significantly (n = 14, one-way repeated-measures ANOVA, P = 0.088). Therefore, the baseline WSLs for the specimens overall were approximately the same size and appropriate for the study.
The mean At% of each variable showed a normal distribution at a confidence interval of 99%. Paired t-test to compare the differences between the lesion and sound enamel areas within the same specimen showed significantly lower mean At% values for Ca, P, F, Na, and Cl in the lesion area relative to the sound enamel area at a confidence level of 95% (Table 1 and Fig. 3). The Ca/P ratio and O in the lesion area were also lower, although not to a significant degree. Additionally, the carbon content of the WSLs was higher than of the sound enamel.
The mean mineral density of each variable was found to have a normal distribution. Consequently, paired t-test was employed to compare the differences between the lesion area and sound enamel area within the same specimen. The mean, mean differences, and P-values between the groups are shown in Table 2 and Fig. 4. The mean MD of sound enamel was 4.55 ± 1.26 g/cm3, while that of the WSL group was 1.76 ± 0.24 g/cm3, which was significantly lower (P < 0.01).

Fig. 2
Representative SEM images showing the surface morphology of the WSL and sound enamel obtained from the same specimen in (A) and (B) respectively. The lesion area (A) exhibits evident roughness and irregularities in comparison to the smooth appearance of the sound enamel (B).
Table 1 Mean and standard deviation (SD) of atomic percentages (At%) for all specimens (
n = 14), mean differences, and
P-values for lesion sites and sound enamel
|
Sound enamel (S) |
White spot lesions (WSLs) |
Mean
differences
(S-WSLs) |
t-value |
P-value
(2-tailed) |
| mean |
SD |
mean |
SD |
| Ca/P ratio |
1.27 |
0.46 |
1.15 |
0.89 |
0.12 |
2.01 |
0.069 |
| Calcium (Ca) |
9.59 |
3.19 |
5.13 |
3.49 |
4.46 |
4.06 |
0.004** |
| Phosphorus (P) |
7.48 |
1.97 |
4.13 |
2.31 |
3.36 |
3.95 |
0.004** |
| Fluorine (F) |
0.73 |
0.41 |
0.28 |
0.36 |
0.45 |
4.86 |
0.001** |
| Sodium (Na) |
0.35 |
0.13 |
0.17 |
0.06 |
0.18 |
3.14 |
0.014* |
| Chlorine (Cl) |
0.20 |
0.05 |
0.12 |
0.06 |
0.08 |
2.69 |
0.036* |
| Oxygen (O) |
47.20 |
10.54 |
43.39 |
10.44 |
3.81 |
1.007 |
0.344 |
| Carbon (C) |
34.67 |
14.64 |
46.09 |
13.18 |
-11.42 |
-2.27 |
0.053 |
*P-value < 0.05, **P-value < 0.01
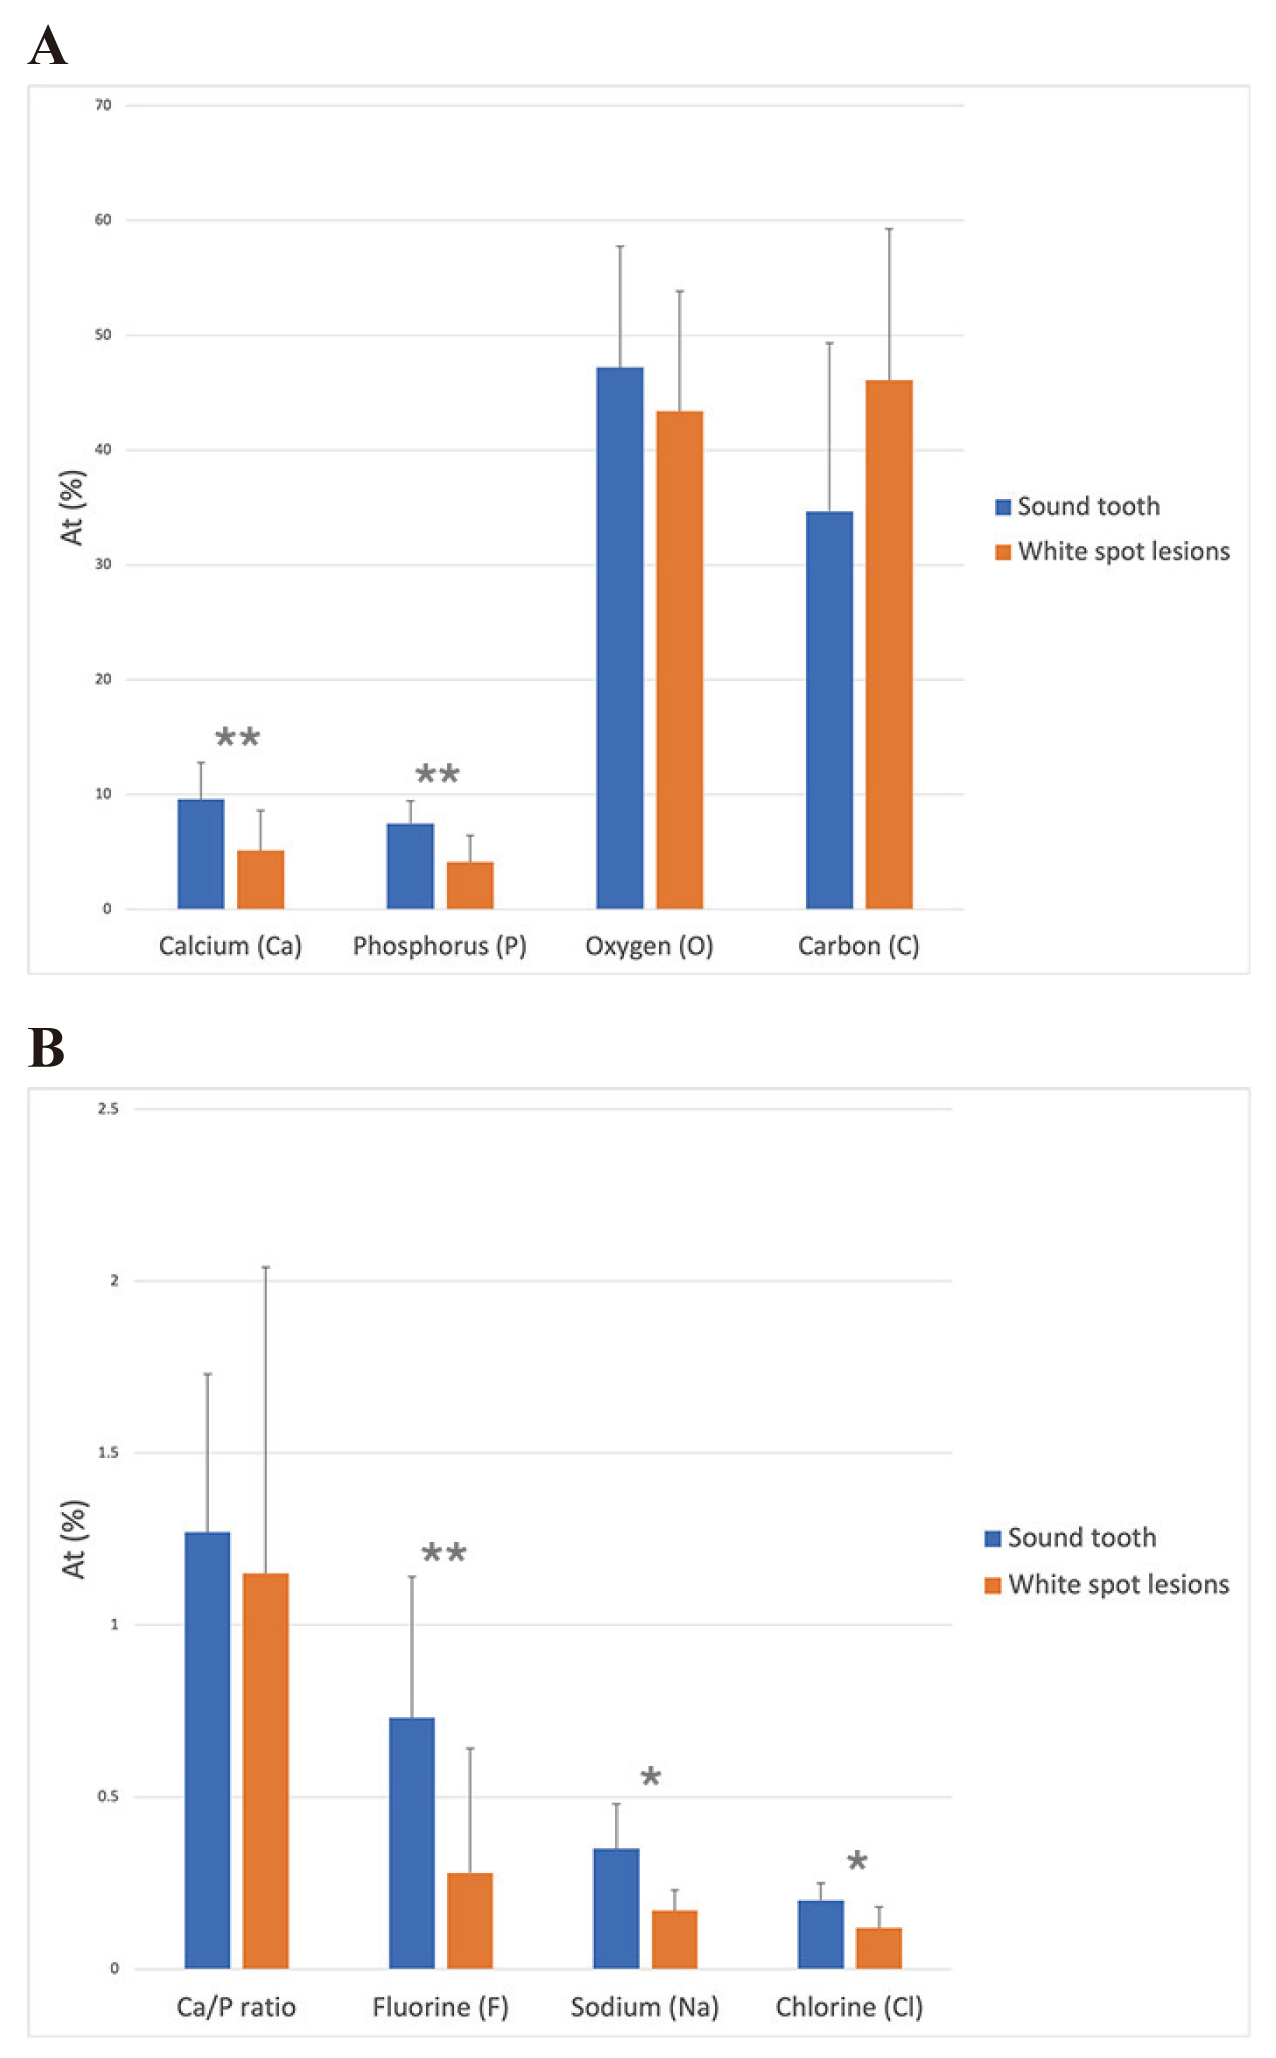
Table 2 Mean and standard deviation (SD) of mineral densities obtained from white spot lesions and sound enamel of all specimens (
n = 14), mean differences and
P-values for the lesion area relative to sound enamel
|
Sound enamel (S) |
White spot lesions (WSLs) |
Mean
differences
(S-WSLs) |
t-value |
P-value
(2-tailed) |
| mean |
SD |
mean |
SD |
| Mineral density (g/cm3) |
4.55 |
1.26 |
1.76 |
0.24 |
2.79 |
7.49 |
0.000** |

Fig. 4
Bar graph of micro-CT data showing the mean ± SD of mineral density in the intact enamel and the WSL surface (n = 14, **P < 0.01, paired t-test).
Discussion
Energy-dispersive X-ray spectroscopy (EDX) or energy-dispersive spectroscopy (EDS) is a commonly used characterization technique that provides both qualitative and quantitative information. It analyzes individual backscattered X-rays from a targeted material, allowing the identification and quantification of various elements present. EDS data can be used to calculate element concentrations and generate distribution maps. SEM/EDS is particularly suitable for investigating the distribution of elements due to its short scanning time, ease in selecting specific areas for investigation, and ability to provide quantitative element data [10]. Therefore, SEM/EDS was an appropriate method for studying the distribution of elements in this research.
Human enamel consists primarily of an inorganic component, accounting for more than 95% of its weight, in the form of calcium hydroxyapatite crystals. The remainder, accounting for less than 5%, consists of water, protein, and organic matrix [19]. The mineral composition and structure of the enamel surface are the result of a dynamic process of demineralization and remineralization. There is an equilibrium between hydroxyapatite in the enamel (Ca10[PO4]6[OH]2) and dissolved hydroxyapatite in dental plaque [20]. Demineralization of enamel occurs when oral bacteria metabolize dietary carbohydrates, leading to a drop in pH below a critical level of 5.5 and acid production [21]. The rapid increase in H+ ion concentration, which can be 100-1,000 times higher, causes diffusion of H+ ions towards the liquid in the pores surrounding the hydroxyapatite crystals in the enamel’s surface and sub-surface regions. As a result, Ca2+ and (PO4)3- ions, major components of calcium hydroxyapatite crystals, move into the mouth, leading to a reduction in Ca and phosphate content [22]. The lesion becomes clinically visible when there is a mineral deficit of around 10% compared to healthy enamel [23]. In this study, a significant decrease in the amount of Ca and P ions in WSLs was observed relative to the sound enamel group. These findings are consistent with an X-ray microtomography study by Huang et al. (2007), which showed significantly lower mineral density in WSLs compared to sound enamel [24]. Another study by Topoliceanu et al. (2013) also found a reduction in Ca and phosphorous ions in white and brown spot lesions relative to sound enamel in molar teeth [14].
Calcium hydroxyapatite crystal (Ca10[PO4]6[OH]2) in human teeth consists of approximately 23% Ca and 14% P in terms of atomic percentage, with a Ca/P molar ratio of 1.67. It is noteworthy that the hydroxyapatite in human teeth may have slight variations from pure hydroxyapatite crystal due to substitution of trace elements in certain areas of the crystal. These substitutions play a role in determining the structure and function of teeth, as depicted in Fig. 5 [25]. Substitution of calcium ions with magnesium and sodium was evident. Magnesium substitution delayed crystal growth and increased acid solubility, whereas sodium substitution was associated with apatite destabilization [26]. In A-type substitution, the hydroxyl group (OH-) is replaced with fluorine ions, creating fluorapatite crystals. Fluorapatite plays an important role in caries prevention by increasing the resistance of the mineral to acid dissolution and decreasing mineral solubility [27,28]. Not only fluorine ions, but also the hydroxyl group can be substituted with chlorine, forming chlorapatite. Therefore, in addition to Ca and phosphorous, Na+, F-, and Cl- were also found on the enamel surface in this study, and these ions were decreased significantly in the WSL group due to mineral degradation. However, the presence of fluorine in enamel can be influenced by individual factors, including fluoride exposure during both the pre-eruption and post-eruption stages. As a result, fluorine levels may vary among individuals. To address this potential confounding factor, the samples were carefully matched in pairs within each sample group, and therefore the results should be interpreted while considering the potential influence of fluoride exposure.
Carbon content plays an important role in determining the rate of demineralization. Substitution of the phosphate ion with the carbonate ion produces defects in calcium-deficient areas. The higher the carbon content, the deeper the demineralized lesions [29,30]. This study also found an increase in carbon content in the WSL group, but there was no significant difference from the sound enamel group, perhaps due to the early stage of demineralization.
Using the micro-CT technique to obtain multiple series of images from specimens and measurement of linear absorption coefficients (LAC) by hydroxyapatite phantom calibration is a common non-destructive method for determining mineral density [31]. Data from micro-CT can be used for both three- and two-dimensional measurements. However, due to the rotating motion of the specimen during the imaging process and the polychromatic X-ray source from the desktop system, ring artifacts and cupping artifacts are noteworthy and may be a significant aspect to consider when interpreting micro-CT results [32].
The mineral density value determined by micro-CT in the WSL group showed a highly significant reduction in comparison to sound enamel (mean difference = 2.79 g/cm3, P-value < 0.001). A decrease in mineral density was also observed in previous studies, and the reduction varied from 5% [33] to 19% [34] and 28% [16]. In the present study, however, the observed reduction was significantly larger at 61%.
The present study demonstrated a significant reduction in calcium (Ca), phosphorus (P), and fluorine (F) levels in WSLs, suggesting that these lesions involve depletion of essential minerals. Given this insight, NaF or CPP-ACP alone might not provide sufficient remineralization. Casein phosphopeptide-amorphous calcium phosphate fluoride (CPP-ACPF) has the potential to assist in reducing WSLs by promoting the deposition of high concentrations of calcium, phosphate, and fluoride ions onto the tooth surface. However, further studies are required to confirm the remineralization activity of this agent.
In conclusion, this study has provided standard measurements for evaluating the important characteristics of WSLs and intact enamel using micro-CT and SEM with EDS techniques. Such measurements play a vital role in evaluating treatment results and developing advanced biomaterials for the treatment of hypomineralized enamel lesions. Additionally, a significant reduction in the atomic percentages of calcium, phosphorus, fluoride, sodium, and chlorine ions was found in the WSLs compared to sound enamel, indicating mineral loss due to the demineralization process. However, the Ca/P ratio and oxygen ions on the surface of sound enamel were slightly higher than in the lesion area, although the difference was not statistically significant.

Fig. 5
Substitution of trace elements in certain areas of a calcium hydroxyapatite crystal.
Ethical Statements
This research was granted exemption from approval by the ethics committee of Srinakharinwirot University (SWUEC-252/2564X).
Conflicts of Interest
The authors have no potential conflicts of interest to declare with respect to the authorship and/or publication of this article.
Funding
This project was funded by National Research Council of Thailand (NRCT) and Srinakharinwirot University: N42A650380. The funding agencies had no role in the submitted work.
References
- 1. Sundararaj D, Venkatachalapathy S, Tandon A, Pereira A (2015) Critical evaluation of incidence and prevalence of white spot lesions during fixed orthodontic appliance treatment: a meta-analysis. J Int Soc Prev Community Dent 5, 433-439.
- 2. Julien KC, Buschang PH, Campbell PM (2013) Prevalence of white spot lesion formation during orthodontic treatment. Angle Orthod 83, 641-647.
- 3. Heymann GC, Grauer D (2013) A contemporary review of white spot lesions in orthodontics. J Esthet Restor Dent 25, 85-95.
- 4. Anderson P, Hector M, Rampersad M (2001) Critical pH in resting and stimulated whole saliva in groups of children and adults. Int J Paediatr Dent 11, 266-273.
- 5. Swain MV, Xue J (2009) State of the art of micro‐CT applications in dental research. Int J Oral Sci 1, 177-188.
- 6. Mattousch TJ, van der Veen MH, Zentner A (2007) Caries lesions after orthodontic treatment followed by quantitative light-induced fluorescence: a 2-year follow-up. Eur J Orthod 29, 294-298.
- 7. Tufekci E, Dixon JS, Gunsolley JC, Lindauer SJ (2011) Prevalence of white spot lesions during orthodontic treatment with fixed appliances. Angle Orthod 81, 206-210.
- 8. Lucchese A, Gherlone E (2013) Prevalence of white-spot lesions before and during orthodontic treatment with fixed appliances. Eur J Orthod 35, 664-668.
- 9. Baik A, Alamoudi N, El-Housseiny A, Altuwirqi A (2021) Fluoride varnishes for preventing occlusal dental caries: a review. Dent J (Basel) 9, 64.
- 10. Petzold M (2001) The influence of different fluoride compounds and treatment conditions on dental enamel: a descriptive in vitro study of the CaF(2) precipitation and microstructure. Caries Res 35 Suppl 1, 45-51.
- 11. Brar GS, Arora AS, Khinda VIS, Kallar S, Arora K (2017) Topographic assessment of human enamel surface treated with different topical sodium fluoride agents: scanning electron microscope consideration. Indian J Dent Res 28, 617-622.
- 12. Orilisi G, Tosco V, Monterubbianesi R, Notarstefano V, Özcan M, Putignano A et al. (2021) ATR-FTIR, EDS and SEM evaluations of enamel structure after treatment with hydrogen peroxide bleaching agents loaded with nano-hydroxyapatite particles. PeerJ 9, e10606.
- 13. Ghavami-Lahiji M, Davalloo RT, Tajziehchi G, Shams P (2021) Micro-computed tomography in preventive and restorative dental research: a review. Imaging Sci Dent 51, 341-350.
- 14. Topoliceanu C, Stoleriu S, Ghiorghe A, Salceanu M, Sandu AV, Andrian S (2013) Chemical changes of enamel occlusal surfaces affected by incipient dental caries: an EDX study. Rev Chim 64, 1324-1328.
- 15. Araujo EMdS, Vidal CdMP, Freitas AZd, Wetter NU, Matos AB (2022) Characterization of sound enamel and natural white spot lesions. Braz Dent Sci 25, e3488.
- 16. Huang TT, He LH, Darendeliler MA, Swain MV (2010) Correlation of mineral density and elastic modulus of natural enamel white spot lesions using X-ray microtomography and nanoindentation. Acta Biomater 6, 4553-4559.
- 17. Strassler HE, Pitel ML (2014) Using fiber-optic transillumination as a diagnostic aid in dental practice. Compend Contin Educ Dent 35, 80-88.
- 18. Chaiwat A, Chunhacheevachaloke E, Kidkhunthod P, Pakawanit P, Ajcharanukul O (2023) Enamel remineralization and crystallization after fluoride iontophoresis. J Dent Res 102, 402-411.
- 19. Mann AB, Dickinson ME (2006) Nanomechanics, chemistry and structure at the enamel surface. Monogr Oral Sci 19, 105-131.
- 20. Hicks J, Garcia-Godoy F, Flaitz C (2004) Biological factors in dental caries enamel structure and the caries process in the dynamic process of demineralization and remineralization (part 2). J Clin Pediatr Dent 28, 119-124.
- 21. Marsh PD (1994) Microbial ecology of dental plaque and its significance in health and disease. Adv Dent Res 8, 263-271.
- 22. Abou Neel EA, Aljabo A, Strange A, Ibrahim S, Coathup M, Young AM et al. (2016) Demineralization-remineralization dynamics in teeth and bone. Int J Nanomedicine 11, 4743-4763.
- 23. Denis M, Atlan A, Vennat E, Tirlet G, Attal JP (2013) White defects on enamel: diagnosis and anatomopathology: two essential factors for proper treatment (part 1). Int Orthod 11, 139-165.
- 24. Huang TT, Jones AS, He LH, Darendeliler MA, Swain MV (2007) Characterisation of enamel white spot lesions using X-ray micro-tomography. J Dent 35, 737-743.
- 25. Wang R, Zhao D, Wang Y (2021) Characterization of elemental distribution across human dentin-enamel junction by scanning electron microscopy with energy-dispersive X-ray spectroscopy. Microsc Res Tech 84, 881-890.
- 26. Robinson C, Shore RC, Brookes SJ, Strafford S, Wood SR, Kirkham J (2000) The chemistry of enamel caries. Crit Rev Oral Biol Med 11, 481-495.
- 27. Featherstone JD (1994) Fluoride, remineralization and root caries. Am J Dent 7, 271-274.
- 28. Aoba T (1997) The effect of fluoride on apatite structure and growth. Crit Rev Oral Biol Med 8, 136-153.
- 29. Pugach MK, Strother J, Darling CL, Fried D, Gansky SA, Marshall SJ et al. (2009) Dentin caries zones: mineral, structure, and properties. J Dent Res 88, 71-76.
- 30. Sabel N, Robertson A, Nietzsche S, Norén J (2012) Demineralization of enamel in primary second molars related to properties of the enamel. ScientificWorldJournal 2012, 587254.
- 31. Shahmoradi M, Swain MV (2016) Quantitative characterization and micro-CT mineral mapping of natural fissural enamel lesions. J Dent 46, 23-29.
- 32. Neves Ade A, Coutinho E, Vivan Cardoso M, Jaecques SV, Van Meerbeek B (2010) Micro-CT based quantitative evaluation of caries excavation. Dent Mater 26, 579-588.
- 33. Sadyrin E, Swain M, Mitrin B, Rzhepakovsky I, Nikolaev A, Irkha V et al. (2020) Characterization of enamel and dentine about a white spot lesion: mechanical properties, mineral density, microstructure and molecular composition. Nanomaterials (Basel) 10, 1889.
- 34. Garot E, Rouas P, D'Incau E, Lenoir N, Manton D, Couture-Veschambre C (2016) Mineral density of hypomineralised and sound enamel. Bull Group Int Rech Sci Stomatol Odontol 53, e33.