Abstract
Purpose: Coffee consumption is a well-known contributor to tooth discoloration, and the extent of staining is influenced by the chemical composition of the coffee. This study investigated the associations of coffee roasting level, chlorogenic acid (CGA) content, absorbance level, and their combined effects with tooth discoloration.
Methods: Bovine tooth enamel specimens were immersed in light, medium, and dark roasts of four coffee types (two Arabica and two Robusta coffees) for 72 h. High-performance liquid chromatography (HPLC) was used to measure CGA content, absorbance levels were estimated by using pigment concentration, and discoloration was assessed by spectrophotometry. The data were analyzed with the Friedman test.
Results: Medium roasts induced the greatest discoloration, and tooth specimens immersed in Ethiopia Arabica exhibited the greatest color difference based on CIEDE2000 (ΔE00 at 72 h: 13.51 ± 4.63). Light roasts induced the least staining, despite having the highest CGA content. Dark roasts showed the highest absorbance, indicating a higher pigment concentration. Friedman analysis revealed a significant difference in color change in relation to roasting level for all coffee types.
Conclusion: The present findings indicate that tooth discoloration is caused by the complex interaction of CGA, melanoidins, and roasting level. Because of the interplay of these factors, medium roasting had the greatest effect on discoloration.
Introduction
Tooth discoloration often results from dietary habits and lifestyle choices and is a common concern. Among the culprits, coffee stands out because of its widespread consumption and significant staining potential [1,2]. Coffee contains numerous compounds, and tannins, chlorogenic acids (CGAs), and chromogens are key factors in tooth discoloration. Although evidence indicates that these components are linked to discoloration, the components that have the most substantial effects, and the mechanisms involved, are unclear. CGA content in coffee positively correlates with tooth discoloration [3,4]. Similarly, tannins contribute significantly to tooth staining [5]. However, few studies of coffee composition have examined the complex interactions that contribute to tooth discoloration and the factors that increase the concentrations of the relevant components.
Coffee consumption habits are potential factors in the degree of tooth discoloration. Coffee temperature notably changes staining potential, as hot coffee is associated with greater staining [6]. Additionally, the roasting level of coffee should be considered. Coffee roasts are typically classified as light, medium, and dark—each requiring different temperatures and roasting times [7]. These differences in roasting affect the flavor and chemical composition of the coffee [8]. The pigments in coffee, primarily melanoidins formed during the roasting process, may cause discoloration by depositing on the tooth surface [9]. It is important to determine how these factors, along with CGAs, affect discoloration trends. Therefore, coffee consumption styles and preferences should be evaluated when considering the complex extrinsic staining process of teeth.
This study aimed to develop a comprehensive understanding of coffee-induced tooth discoloration by examining the individual and combined effects of CGA and pigments and determining how their concentrations are affected by coffee roast level. Measurements were made with colorimetry, high-performance liquid chromatography (HPLC), and ultraviolet-visible (UV-Vis) spectrophotometry. By exploring the interactions between these factors, this study attempted to identify the main contributors to coffee-induced tooth discoloration and provide insights on mitigating such discoloration.
Materials and Methods
Bovine teeth procured from the Korean Traditional Market in Seoul and stored at −20°C until use were used as tooth enamel specimens (Fig. 1). Mandibular central and lateral incisors were used, and teeth with cracks or caries were discarded. Before modification, the teeth were thawed at room temperature. Holes (diameter, 8 mm) were drilled through the center of the teeth with a bench drilling machine (YDM-13 mm, Yongsoo Precision, Daegu, Republic of Korea) equipped with a cylindrical diamond core (10 × 8 mm) while supplying water to prevent overheating. The drilled teeth were then affixed to custom-made acrylic rings (30 × 12 × 4 mm) by using self-curing resin (ASCP3000500, Vertex-Dental, Soesterberg, Netherlands). To maintain the enamel layer and prevent dentin exposure, the specimens were meticulously polished with a grinding and polishing machine (LaboPol-5, Struers, Copenhagen, Denmark) using silicon carbide papers (#220, #600, and #1200 SiC sand paper, R&B, Daejeon, Republic of Korea) [10,11,12]. To ensure consistent thickness overall—a requirement for accurate microhardness measurement—specimen thickness was measured after each grinding session with a digital micrometer (CD67-S15PM, Mitutoyo, Kawasaki, Japan).
The specimens were selected by using predefined inclusion criteria—those having a Vickers Hardness Number (VHN) ≥250 and a 75 ± 1 L* value were considered satisfactory [3,4,13]. The VHN was determined with a Vickers hardness tester (HM-220, Mitutoyo) to ensure that each part consisted primarily of enamel rather than dentin. Additionally, the baseline colors of each specimen were measured with a spectrophotometer (Ci7600 X-rite Pantone, Grand Rapids, MI, USA) in reflectance mode.

Fig. 1
Workflow of the present experiment
Two types of Arabica (Coffea arabica) and two types of Robusta (Coffea canephora) raw beans (Ethiopia Yirgacheffe Arabica, Colombia Supremo Arabica, Vietnam Robusta, Uganda Robusta; Greenearth Coffee, Yongin, Republic of Korea) were roasted to three levels (Fig. 2A). By using a coffee bean roaster (MK301, RAF, Jinhua City, China), beans were roasted at 205°C for 13 min for light roasts, at 210°C for 20 min for medium roasts, and at 220°C for 25 min for dark roasts. A grinder (BCG-740All, Beancruise, Seoul, Republic of Korea) was then used to coarsely grind the roasted beans, and 15 g of the ground coffee powder was inserted into a drip coffee maker (LCZ1002WT, Lacuzin, Seoul, Republic of Korea) containing 250 mL of distilled water. The brewed coffee was transferred to a plastic container for immersion of tooth specimens. A small portion was saved for HPLC analysis of CGA content and absorbance measurements.
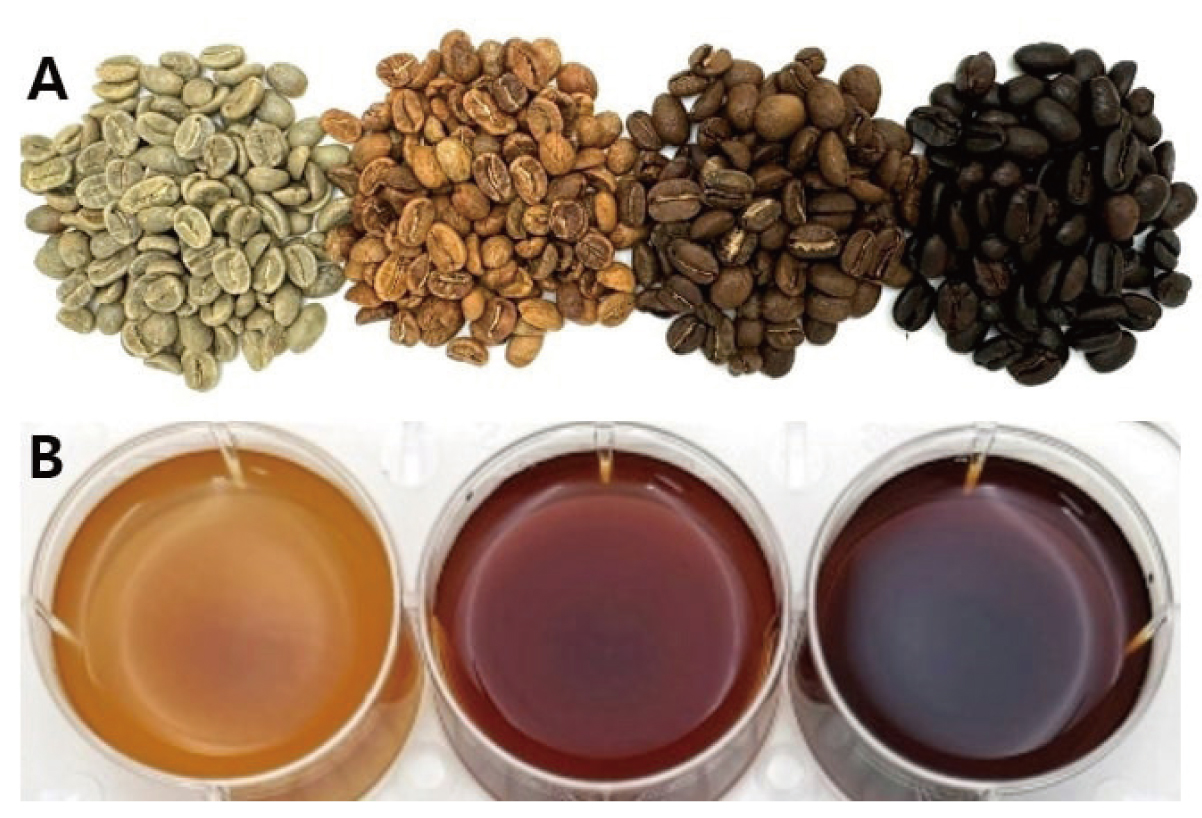
Fig. 2
Coffee beans arranged by roast level from left to right—raw green beans, light-roasted beans, medium-roasted beans, and dark-roasted beans (A), and coffee solutions brewed from light, medium, and dark roasts (B)
The most abundant CGA isomers—3-caffeoylquinic acid (3-CQA), 5-caffeoylquinic acid (5-CQA), and 4-caffeoylquinic acid (4-CQA)—were measured to determine the CGA content in the present coffee solutions [14]. The standards were purchased from Sigma-Aldrich (St. Louis, MO, USA), and the standards and coffee solutions were analyzed with an HPLC photodiode array detector (HPLC YL 9100-PDA, Youngin Chromass, Anyang, Republic of Korea) and YL-Clarity software (Youngin Chromass), in accordance with the conditions recommended by DIN 10767 [15]. Gradients of 0 min-90% mobile phase A (Acetonitrile, Sigma-Aldrich) and 40 min-40% mobile phase B (1% phosphoric acid, Sigma-Aldrich) were created at a flow rate of 1.0 mL/min. The coffee solutions were then centrifuged at 10,000 rpm for 10 min at 4°C, after which the supernatant was collected, filtered through a 0.2-µm filter (Advantec, Tokyo, Japan), transferred to an HPLC vial, and loaded into an autosampler for testing.
Absorbance
To estimate and compare pigment concentration, which indicates the melanoidin levels formed during the three-level roasting process, the coffee supernatant was subjected to absorbance testing at a wavelength of 416 nm (Hidex Chameleon, Hidex Oy, Turku, Finland) (Fig. 2B).
Tooth immersion
To measure color change from coffee exposure, 120 tooth specimens were used. The sample size was calculated using G*Power Version 3.1.9.6 (Heinrich Heine University Düsseldorf, Düsseldorf, Germany), assuming a significance level of 0.05, a power of 0.95, and an effect size of 0.15. Although the recommended sample size was 60, the experiment proceeded with 120 specimens to ensure sufficient power and reliability. Coffee solutions were prepared at three different roast levels—light, medium, and dark—for each type of coffee bean: Ethiopia Yirgacheffe, Colombia Supremo, Vietnam, and Uganda (Greenearth Coffee). This resulted in three batches per coffee type, with 10 specimens immersed for each batch. Baseline measurements of the tooth specimens were taken before and after immersion for 1, 3, 9, 24, 48, and 72 cumulative hours. In accordance with the Commission Internationale de l'Éclairage L*a*b* (CIELAB) method [16], L*, a*, and b* values were measured to determine color differences with the CIEDE2000 (ΔE00) formula [17].
|
$$ \Delta \mathrm{E}_{00} = \sqrt{\left(\frac{\Delta \mathrm{L}'}{\mathrm{K}_{\mathrm{L}} \mathrm{S}_{\mathrm{L}}} \right)^2 + \left(\frac{\Delta \mathrm{C}'}{\mathrm{K}_{\mathrm{C}} \mathrm{S}_{\mathrm{C}}} \right)^2 + \left(\frac{\Delta \mathrm{H}'}{\mathrm{K}_{\mathrm{H}} \mathrm{S}_{\mathrm{H}}}\right)^2 + \mathrm{R}_{\mathrm{T}} \left(\frac{\Delta \mathrm{C}'}{\mathrm{K}_{\mathrm{C}} \mathrm{S}_\mathrm{C}}\right)\left(\frac{\Delta \mathrm{H}'}{\mathrm{K}_{\mathrm{H}} \mathrm{S}_\mathrm{\mathrm{H}}}\right)} $$
|
ΔL*, Δa*, and Δb* were calculated by subtracting the baseline measurements from the measurements taken at a specific time point. The whiteness index (WID) was calculated using a formula developed by Pérez et al. [18]:
|
$$ \mathrm{WI}_{\mathrm{D}} = \mathrm{P} × \mathrm{a}^* + \mathrm{Q} × \mathrm{b}^* + \mathrm{R} × \mathrm{L}^* $$
|
To assess the normality and homoscedasticity of the data, the Shapiro-Wilk and Levene tests were conducted. On the basis of the test results, the Friedman test was then applied with a significance level set at P < 0.05. All analyses were performed using Python 3.10.12 (main, November 20, 2023, 15:14:05) [GNU Compiler Collection 11.4.0].
Results
The results of the Shapiro-Wilk normality test showed deviations from normality for all variables, indicating that the assumption of normality was not met. The Levene test was used to assess homogeneity of variances across the different coffee types for each of the three variables. Color change and absorbance had differences in variances across the groups (P = 0.019 and P = 0.040, respectively), indicating a violation of the homogeneity of variances assumption. In contrast, CGA showed no significant difference in variances across groups (P = 0.078), suggesting that the assumption of homogeneity of variances was valid for this variable.
The Friedman test was used to assess the significance of differences in color change, CGA content, and absorbance across the roast levels. The results indicated significant differences in color change across roast levels for all coffee types (P < 0.001). Moreover, pairwise comparisons using the Wilcoxon signed-rank test with Bonferroni correction revealed significant differences between most pairs of roast levels (Table 1). For CGA content and absorbance, significant differences were detected across all roast levels (P ≤ 0.001 for all comparisons).
Specimens immersed in medium roasts exhibited the highest ΔE00 and ΔWID across all four coffee types at the final 72-h sequence (Table 1). Specifically, medium-roast Ethiopia Arabica resulted in the greatest discoloration, with the highest ΔE00 (13.51 ± 4.63; median: 11.97, interquartile range [IQR]: 10.48-15.27) and ΔWID (26.24 ± 11.45; median: 25.74, IQR: 16.50-33.85). These findings indicate substantial overall color change in the specimens and that there was a considerable reduction in whiteness, which suggests prominent yellowing or darkening over time.
In contrast, Uganda Robusta had the lowest ΔE00 (8.76 ± 4.74; median: 7.14, IQR: 6.27-10.70) and ΔWID (15.44 ± 9.94; median: 14.93, IQR: 8.44-21.21) among the medium roasts. Although this coffee type still caused noticeable discoloration and reduction in whiteness, the extent was significantly less than that for Ethiopia Arabica. This suggests that Uganda Robusta affects the color and whiteness of the specimens, but to a lesser degree than other medium roasts.
Among light roasts, the Colombian Arabica had the highest ΔE00 (5.27 ± 1.59; median: 5.15, IQR: 3.95-6.90) and ΔWID (9.82 ± 4.57; median: 8.61, IQR: 6.18-13.20) at 72 h. These values are lower than those for medium and dark roasts, indicating that light roasts result in less discoloration and less reduction in whiteness. This trend was consistent across all light roasts. The Uganda Robusta light roast had the least impact on ΔE00 and ΔWID, particularly in the early immersion periods.
Among dark roasts, Ethiopia Arabica again caused the most substantial discoloration and reduction in whiteness: ΔE00 was 7.47 ± 3.78 (median: 6.67, IQR: 4.96-8.71) and ΔWID was 12.19 ± 4.46 (median: 12.34, IQR: 7.64-15.69) at 72 h. Although these values are lower than those for the medium roast of the same coffee, they are still notable and suggest that, even at darker roast levels, Ethiopia Arabica contributes to considerable color change and whiteness reduction.
All specimens except those immersed in light roasts exhibited discoloration above the thresholds of perceptibility (0.8) and acceptability (1.8) after just 1 h of immersion. This highlights the rapid impact of coffee on specimen discoloration, particularly for medium and dark roasts, for which color changes were noticeable and significant after a short interval. The light roasts, while still causing discoloration, exhibited a slower rate of color change and remained closer to the perceptibility threshold in the early stages.
HPLC analysis revealed that total CGA content was highest in light roasts, followed by medium and dark roasts (Table 2). The differences among coffee types were minimal as compared with the variance observed among roast levels. Conversely, absorbance was lowest for light roasts and highest for dark roasts (Table 2).
Table 1 Color difference (ΔE
00), whiteness index difference (ΔWI
D), and CGA content (median and interquartile ranges), by coffee type and roast level
| Roast Level |
Coffee |
1 h |
3 h |
9 h |
24 h |
48 h |
72 h |
| ΔE00 |
ΔE00 |
ΔE00 |
ΔE00 |
ΔE00 |
ΔE00 |
| ΔWID |
ΔWID |
ΔWID |
ΔWID |
ΔWID |
ΔWID |
| Light |
A1 |
0.61
(0.29-1.06) |
1
(0.33-1.37) |
1.96
(1.36-3.09) |
2.55
(1.78-4.19) |
3.83
(2.12-4.81) |
3.98a
(3.09-5.41) |
0.88
(0.54-1.78) |
0.92
(-0.06-1.70) |
4.17
(3.31-5.00) |
7.56
(3.87-8.02) |
7.37
(5.19-12.53) |
8.82
(6.14-10.85) |
| A2 |
0.63
(0.52-0.79) |
1.08
(0.52-2.50) |
1.28
(0.71-2.17) |
3.02
(2.05-4.66) |
3.05
(2.20-4.42) |
5.15a
(3.95-6.90) |
0.7
(0.16-1.39) |
1.66
(0.24-2.74) |
2.86
(2.20-4.54) |
4.32
(1.71-6.20) |
5.92
(3.96-8.99) |
8.61
(6.18-13.20) |
| R1 |
0.71
(0.29-1.97) |
1.04
(0.73-2.45) |
1.16
(0.51-2.64) |
1.49
(1.12-4.22) |
2.7
(1.11-4.01) |
3.75a
(1.77-5.05) |
−0.45
(−1.13-0.55) |
0.74
(−1.07-1.68) |
1.06
(−0.76-2.68) |
1.4
(−1.67-3.49) |
2.01
(−0.88-6.69) |
3.59
(0.18-8.18) |
| R2 |
0.41
(0.25-0.70) |
1.03
(0.54-1.85) |
1.25
(0.40-2.34) |
2.08
(1.42-3.72) |
2.81
(2.05-5.35) |
3.12a
(2.70-5.59) |
0.57
(0.02-0.78) |
1.15
(0.22-2.41) |
1.53
(0.85-2.63) |
2.94
(1.71-4.27) |
4.49
(2.48-6.27) |
6.1
(2.31-7.26) |
| Medium |
A1 |
1.35
(0.95-2.14) |
1.95
(1.68-3.11) |
5.48
(3.25-7.54) |
7.83
(5.93-10.13) |
8.92
(7.58-16.31) |
11.97b
(10.48-15.27) |
3.63
(1.66-5.89) |
5.5
(2.79-8.40) |
10.46
(6.36-17.64) |
14.38
(9.31-27.98) |
16.32
(13.55-37.21) |
25.74
(16.50-33.85) |
| A2 |
0.68
(0.36-1.14) |
1.46
(1.14-3.09) |
2.18
(1.94-4.12) |
4.62
(3.73-7.95) |
6.97
(5.35-10.64) |
9.23b
(6.25-13.88) |
1.31
(0.36-3.27) |
3.79
(1.25-5.15) |
5.11
(2.54-9.71) |
9.02
(4.81-14.88) |
12.42
(6.63-16.77) |
16.89
(8.04-25.35) |
| R1 |
0.99
(0.64-1.77) |
1.52
(1.18-2.60) |
2.29
(1.45-3.24) |
3.11
(2.47-5.91) |
5.07
(3.93-7.41) |
7.14b
(6.27-10.70) |
1.74
(0.13-3.11) |
2.76
(1.38-4.87) |
3.92
(2.09-7.66) |
5.89
(3.84-12.76) |
8.72
(6.40-17.71) |
14.93
(8.44-21.21) |
| R2 |
1.85
(0.95-2.01) |
3.03
(2.10-5.34) |
4.21
(3.37-6.73) |
8.04
(5.61-11.15) |
10.43
(6.71-15.34) |
12.82b
(9.20-17.28) |
2.9
(1.32-4.08) |
4.86
(2.57-9.72) |
6.11
(4.18-12.72) |
8.64
(6.02-21.31) |
15.48
(7.44-25.88) |
17.58
(8.68-30.87) |
| Dark |
A1 |
0.87
(0.50-1.39) |
1.55
(0.92-2.22) |
2.89
(2.54-4.89) |
4.38
(3.56-6.09) |
6.03
(4.74-7.92) |
6.67c
(4.96-8.71) |
1.76
(0.21-3.33) |
3.33
(2.50-5.73) |
7
(4.83-10.66) |
8.83
(6.17-10.43) |
11.54
(9.12-14.43) |
12.34
(7.64-15.69) |
| A2 |
1.19
(0.58-1.46) |
2.48
(1.54-3.30) |
3.18
(1.99-3.82) |
4.93
(3.79-6.58) |
6.64
(4.63-9.17) |
8.50b
(6.54-9.45) |
1.85
(0.61-3.12) |
1.93
(0.65-4.54) |
3.94
(3.23-4.95) |
5.69
(3.88-11.01) |
9.67
(5.88-13.80) |
12.11
(6.21-15.92) |
| R1 |
1.06
(0.71-1.45) |
2.22
(1.86-2.66) |
2.7
(2.43-3.55) |
4.22
(3.73-6.55) |
4.86
(3.74-7.73) |
7.34b
(6.25-9.72) |
2.89
(0.82-3.62) |
5.66
(1.66-6.81) |
7.15
(4.89-9.54) |
11.08
(6.57-15.77) |
12.81
(5.40-16.76) |
16.11
(11.08-19.90) |
| R2 |
0.53
(0.17-0.82) |
1.75
(1.17-2.00) |
2.08
(1.48-2.80) |
4.95
(3.06-6.00) |
5.62
(3.76-7.17) |
6.75c
(4.10-8.10) |
0.63
(0.28-1.86) |
2.92
(1.41-3.89) |
3.35
(1.65-6.10) |
6.36
(4.08-14.42) |
8.55
(5.27-11.73) |
9.04
(4.33-15.35) |
A1: Ethiopia Yirgacheffe (Arabica), A2: Colombia Supremo (Arabica), R1: Uganda (Robusta), R2: Vietnam (Robusta). a,b,cdifferent letters in the same column indicate a significant difference.
Table 2 Chlorogenic acid content and absorbance, by roast level
| Roast level |
Coffee |
CGA (mg/100 mL) |
Absorbance (AU) |
| Median (IQR) |
Median (IQR) |
| Light |
A1 |
61.51 (61.25-61.74)a |
1.03 (1.02-1.06)a |
| A2 |
49.88 (47.91-51.88)a |
0.94 (0.93-0.96)a |
| R1 |
52.09 (51.61-52.57)a |
0.77 (0.76-0.80)a |
| R2 |
58.17 (55.88-60.42)a |
1.12 (1.10-1.14)a |
| Medium |
A1 |
30.88 (30.18-31.62)b |
1.88 (1.87-1.91)b |
| A2 |
26.92 (25.76-28.09)b |
2.45 (2.43-2.47)b |
| R1 |
34.15 (33.33-34.98)b |
1.93 (1.89-1.98)b |
| R2 |
31.64 (30.89-32.40)b |
2.14 (2.11-2.18)b |
| Dark |
A1 |
7.24 (6.87-7.61)c |
2.73 (2.70-2.76)c |
| A2 |
3.88 (3.68-4.01)c |
2.68 (2.65-2.72)c |
| R1 |
5.32 (5.31-5.35)c |
2.72 (2.69-2.77)c |
| R2 |
5.73 (5.46-5.97)c |
3.23 (3.21-3.26)c |
A1: Ethiopia Yirgacheffe (Arabica), A2: Colombia Supremo (Arabica), R1: Uganda (Robusta), R2: Vietnam (Robusta). a,b,cdifferent letters in the same column indicate a significant difference
Discussion
The present prolonged immersion times of tooth specimens in coffee solutions—up to 72 h—do not reflect typical coffee consumption habits, which involve brief contact. However, this method is useful experimentally as it amplifies the effects of coffee compounds on enamel, thus allowing for clearer observation of staining potential and the chemical interactions involved. By extending immersion time, the study aimed to simulate cumulative exposure over a longer period, thereby providing insights into the potential long-term effects of regular coffee consumption on tooth discoloration.
The present results shed light on the relationship between roasting levels, CGA content, absorbance levels, and their combined effects on tooth discoloration. Previous studies established that CGA level positively correlates with tooth discoloration [3,4,19]. The different roast levels of coffee evaluated revealed that CGA content varies greatly in relation to roast level, which was partly reflected in the discoloration trends of tooth specimens. Specimens immersed in medium roasts had the greatest discoloration. While CGA was most prevalent in light roasts, the least discoloration occurred in these roasts, suggesting that tooth discoloration results from the complex interaction of various factors rather than from a single component.
Absorbance measurements of coffee revealed that dark roasts had the highest absorbance, indicating the highest pigment concentration. This is consistent with chemical transformations known to occur during roasting, where higher temperatures and longer roasting times degrade CGA and create more melanoidins through Maillard reactions [20,21]. The Maillard reaction in coffee occurs when the temperature of the beans is above 154°C and involves a complex reaction between sugars to produce melanoidins [22]. Although melanoidins comprise 29% of the total weight of coffee, they cannot be directly analyzed because of uncertainty regarding their structures; hence the use of absorbance to estimate their concentration [22,23,24]. Melanoidins tend to exhibit maximum absorbance near a wavelength of 405-420 nm [23,24].
Medium roasts, which induced the most discoloration, contained moderate levels of CGA and melanoidins, as compared with light and dark roasts, highlighting the importance of these components in inducing discoloration. Moreover, when beans are exposed to extremely high temperatures, CGAs are almost completely degraded, as observed in the dark roasts, which had much lower CGA levels than light and medium roasts [25]. Despite the low CGA content, dark roasts still had greater discoloration than light roasts, indicating that melanoidin concentration is slightly more important than CGA in tooth staining.
There were only minor variations in CGA, pigment content, and discoloration trends among the different coffee types. The findings for Ethiopia Arabica coffee, which induced the greatest discoloration, were consistent with those of a previous study that reported that Arabica coffee tended to stain more than Robusta coffee [6]. However, differences in discoloration attributable to coffee type were minimal, as compared with differences in discoloration due to differences in roasting level. A previous CGA analysis also reported that CGA was more affected by roasting level than by geographical factors [7]. This indicates that roasting level has a greater impact on CGA content than the origin of the beans and that roasting level indirectly and substantially affects tooth discoloration attributable to coffee consumption.
CGAs contribute to tooth discoloration through several mechanisms. CGA, a colorless acid, can potentially erode tooth enamel [26]. Compromised enamel integrity can lead to dentin exposure, making the tooth surface more porous, rough, and prone to staining [27]. Pigments formed during roasting are more likely to deposit on pores and roughened surfaces. Past experiments on enamel-acid exposure have shown demineralization, as indicated by increased surface roughness and decreased microhardness [28].
CGAs can also cause tooth discoloration through heat-induced breakdown into quinic and caffeic acids. This process increases the complexity of coffee-driven tooth discoloration because it contributes to the brown color and is incorporated into melanoidins. Melanoidins are indirect products of CGA thermal breakdown and are indirectly influenced by CGAs. A study reported that quinic and caffeic acids are incorporated into melanoidins during roasting, and that more quinic acid was released during CGA breakdown [29]. Although CGA content in coffee may be indirectly positively correlated with melanoidin production, CGAs enhance the functional properties of melanoidins. Therefore, the indirect interactions between CGAs and melanoidins suggest that coffee with naturally high CGA content likely causes substantial tooth discoloration when heavily roasted.
Although the role of saliva was not considered in this study, a previous study has shown that polyphenols bind to salivary proteins [30], which indicates that CGAs can interact with salivary proteins and adhere to tooth surfaces. However, further research is needed to determine how this contributes to tooth discoloration. Future studies should also consider the amount of sucrose in coffee, to confirm the association between sucrose and melanoidins [31]. Additionally, the effects of coffee additives are important because many consumers add sugar or syrup to their drinks. These additives could alter the chemical composition and staining potential of the coffee. It is also crucial to explore the impact of dairy products such as milk and cream, because they might interact with polyphenols and affect their binding to tooth enamel. Furthermore, investigating the role of brewing method, including espresso, drip, and cold brew, could provide a comprehensive understanding of how preparation techniques influence the staining properties of coffee. Understanding these variables will help in developing more-effective strategies for preventing coffee-induced tooth discoloration and maintaining oral health.
In summary, the present findings indicate that tooth discoloration is driven by a complex interplay of CGA, melanoidins, and coffee roasting level. Discoloration was greatest for medium roasts because of the considerable amounts of CGAs and melanoidins, and specimens exposed to Ethiopia Arabica coffee had the greatest discoloration. Light roasts, despite having the highest CGA content, induced the least discoloration, indicating that factors other than CGA influence staining. Dark roasts had the highest pigment concentration, as evidenced by absorbance measurements, highlighting the role of melanoidins formed during roasting.
Abbreviations
CGA: chlorogenic acid; CIELAB: Commission Internationale de l'Éclairage L*a*b*; CQA: caffeoylquinic acid; ΔE00: CIEDE2000 color difference; HPLC: high-performance liquid chromatography; IQR: interquartile range; UV-Vis: ultraviolet-visible; VHN: Vickers hardness number; WID: whiteness index
Ethical Statements
Not applicable
Conflicts of Interest
The authors declare no conflicts of interest related to this research.
Funding
This work was supported by the Korea Medical Device Development the Ministry of Science and ICT, the Ministry of Trade, Industry and Energy, the Ministry of Health and Welfare, the Ministry of Food and Drug Safety (Project Number: 1711134912, RS-2020-KD000002) and Basic Science Research Program through the National Research Foundation of Korea (NRF) funded by the Ministry of Education (NRF-2021R1I1A2048516).
Author Contributions
SK: data curation, formal analysis, investigation, methodology, writing – original draft; SL: data curation, investigation, writing – original draft; NT: formal analysis, validation, writing – review and editing; SHC: formal analysis, validation, writing – review and editing; MS: formal analysis, validation, writing – review and editing; YJK: formal analysis, validation, writing – review and editing; YSP: conceptualization, funding acquisition, supervision, writing – review and editing. All authors reviewed and approved the final version of the manuscript.
ORCID iD
1)SK: babyyoda@snu.ac.kr, https://orcid.org/0000-0001-6377-9902
1)SL: larnani@snu.ac.kr, https://orcid.org/0000-0003-1866-6006
2)NT: ntyoussef@iau.edu.sa, https://orcid.org/0000-0002-1527-638X
3)SHC: den533@snu.ac.kr, NA
4)MS: murali.srinivasan@zzm.uzh.ch, https://orcid.org/0000-0003-3365-576X
5)YJK: neokarma@snu.ac.kr, NA
1,6)YSP*: ayoayo7@snu.ac.kr, https://orcid.org/0000-0002-0148-7848
Data Availability Statements
Data generated during the current study are available from the corresponding author on reasonable request. All data generated or analyzed during this study are included in this published article.
References
- 1. Ciaramelli C, Palmioli A, Airoldi C (2019) Coffee variety, origin and extraction procedure: Implications for coffee beneficial effects on human health. Food Chem 278, 47-55. doi: 10.1016/j.foodchem.2018.11.063
- 2. Nigra AD, Teodoro AJ, Gil GA (2021) A decade of research on coffee as an anticarcinogenic beverage. Oxid Med Cell Longev 2021, 4420479. doi: 10.1155/2021/4420479
- 3. Kim S, Chung SH, Kim RJY, Park YS (2024) Investigating the role of chlorogenic acids and coffee type in coffee-induced teeth discoloration. Acta Odontol Scand 82, 1-8. doi: 10.1080/00016357.2023.2245880
- 4. Kim S, Lee CH, Ma S, Park YS (2024) Whitening efficacy of toothpastes on coffee-stained teeth: an enamel surface analysis. Int Dent J 74, 1233-1238. doi: 10.1016/j.identj.2024.02.006
- 5. Okamura T, Hisano Y, Isono H, Suzuki K, Cui J, Yamamoto Y et al. (2022) Effects of tannin on experimental staining of enamel. J Oral Tissue Eng 20, 47-54. doi: 10.11223/jarde.20.47
- 6. Kim S, Song JS, Yoon J, G-G F, Park YS (2024) Influence of coffee characteristics on tooth discoloration. Am J Dent 37, 171-176.
- 7. Liang N, Xue W, Kennepohl P, Kitts DD (2016) Interactions between major chlorogenic acid isomers and chemical changes in coffee brew that affect antioxidant activities. Food Chem 213, 251-259. doi: 10.1016/j.foodchem.2016.06.041
- 8. Moon JK, Yoo HS, Shibamoto T (2009) Role of roasting conditions in the level of chlorogenic acid content in coffee beans: correlation with coffee acidity. J Agric Food Chem 57, 5365-5369. doi: 10.1021/jf900012b
- 9. Yu J, Hu N, Hou L, Hang F, Li K, Xie C (2023) Extraction methods of melanoidins and its potential as a natural pigment. Food Sci Technol 43, e113322. doi: 10.1590/fst.113322
- 10. Kim J-H, Kim S, Truong VM, Lee JW, Park YS (2022) Is whitening toothpaste safe for dental health?: RDA-PE method. Dent Mater J 41, 731-740. doi: 10.4012/dmj.2021-303
- 11. Kim JH, Kim S, Jin BH, Garcia-Godoy F, Park YS (2023) Longterm abrasive and erosive effect of whitening toothpaste on dentin surface. Am J Dent 36, 267-273.
- 12. Kim S, Yoo YJ, Garcia-Godoy F, Park YS (2024) Coffee-stained tooth enamel color restoration and surface abrasion with whitening and regular toothpaste. Am J Dent 37, 3-8.
- 13. Tanaka K, Someya T, Kawada E, Ohyama T, Yoshinari M, Takemoto S et al. (2020) In vitro wear behavior of restorative resin composites against bovine enamel. Dent Mater J 39, 915-923. doi: 10.4012/dmj.2018-297
- 14. Naveed M, Hejazi V, Abbas M, Kamboh AA, Khan GJ, Shumzaid M et al. (2018) Chlorogenic acid (CGA): A pharmacological review and call for further research. Biomed Pharmacother 97, 67-74. doi: 10.1016/j.biopha.2017.10.064
- 15. Ayelign A, Sabally K (2013) Determination of chlorogenic acids (CGA) in coffee beans using HPLC. Am J Res Commun 1, 78-91.
- 16. Mahrous AA, Alhammad A, Alqahtani F, Aljar Y, Alkadi A, Taymour N et al. (2023) The toothbrushing effects on surface properties and color stability of CAD/CAM and pressable ceramic fixed restorations—an in vitro study. Materials 16, 2950. doi: 10.3390/ma16082950
- 17. Sharma G, Wu W, Dalal EN (2005) The CIEDE2000 color-difference formula: Implementation notes, supplementary test data, and mathematical observations. Color Res Appl 30, 21-30. doi: 10.1002/col.20070
- 18. Pérez MdM, Ghinea R, Rivas MJ, Yebra A, Ionescu AM, Paravina RD et al. (2016) Development of a customized whiteness index for dentistry based on CIELAB color space. Dent Mater 32, 461-467. doi: 10.1016/j.dental.2015.12.008
- 19. Pratomo AH, Triaminingsih S, Indrani DJ (2018) Effect on tooth discoloration from the coffee drink at various smoke disposal during coffee bean roasting. J Phys Conf Ser 1073, 032031. doi: 10.1088/1742-6596/1073/3/032031
- 20. Baggenstoss J, Poisson L, Kaegi R, Perren R, Escher F (2008) Coffee roasting and aroma formation: application of different time-temperature conditions. J Agric Food Chem 56, 5836-5846. doi: 10.1021/jf800327j
- 21. Kamiyama M, Moon JK, Jang HW, Shibamoto T (2015) Role of degradation products of chlorogenic acid in the antioxidant activity of roasted coffee. J Agric Food Chem 63, 1996-2005. doi: 10.1021/jf5060563
- 22. Hu GL, Wang X, Zhang L, Qiu MH (2019) The sources and mechanisms of bioactive ingredients in coffee. Food Funct 10, 3113-3126. doi: 10.1039/c9fo00288j
- 23. Budryn G, Nebesny E, Podsędek A, Żyżelewicz D, Materska M, Jankowski S et al. (2009) Effect of different extraction methods on the recovery of chlorogenic acids, caffeine and Maillard reaction products in coffee beans. Eur Food Res Technol 228, 913-922. doi: 10.1007/s00217-008-1004-x
- 24. Moreira AS, Nunes FM, Domingues MR, Coimbra MA (2012) Coffee melanoidins: structures, mechanisms of formation and potential health impacts. Food Funct 3, 903-915. doi: 10.1039/c2fo30048f
- 25. Cheng B, Furtado A, Smyth HE, Henry RJ (2016) Influence of genotype and environment on coffee quality. Trends in Food Sci Technol 57, 20-30. doi: 10.1016/j.tifs.2016.09.003
- 26. Wildermuth SR, Young EE, Were LM (2016) Chlorogenic acid oxidation and its reaction with sunflower proteins to form green‐colored complexes. Compr Rev Food Sci Food Saf 15, 829-843. doi: 10.1111/1541-4337.12213
- 27. West NX, Lussi A, Seong J, Hellwig E (2013) Dentin hypersensitivity: pain mechanisms and aetiology of exposed cervical dentin. Clin Oral Investig 17, 9-19. doi: 10.1007/s00784-012-0887-x
- 28. Larnani S, Song Y, Kim S, Park YS (2024) Examining enamel-surface demineralization upon exposure to acidic solutions and the remineralization potential of milk and artificial saliva. Odontology June 21, 2024. doi: 10.1007/s10266-024-00960-y
- 29. Bekedam EK, Schols HA, Van Boekel MAJS, Smit G (2008) Incorporation of chlorogenic acids in coffee brew melanoidins. J Agric Food Chem 56, 2055-2063. doi: 10.1021/jf073157k
- 30. de Freitas V, Mateus N (2001) Structural features of procyanidin interactions with salivary proteins. Agric Food Chem 49, 940-945. doi: 10.1021/jf000981z
- 31. Perrone D, Farah A, Donangelo CM, de Paulis T, Martin PR (2008) Comprehensive analysis of major and minor chlorogenic acids and lactones in economically relevant Brazilian coffee cultivars. Food Chem 106, 859-867. doi: 10.1016/j.foodchem.2007.06.053

