Review
QSAR of toxicology of substituted phenols
2015 Volume 40 Issue 1 Pages 1-12

Details
2015 Volume 40 Issue 1 Pages 1-12
The quantitative structure activity relationship paradigm provides an excellent avenue for investigating ligand–receptor interactions in medicinal chemistry/toxicology. Lateral validation of models formulated using this approach allows for a cohesive understanding of the mechanistic underpinnings of a specific class of related molecules. The diverse biological activities of substituted phenols (X-phenols) in organisms that run the gamut from protozoa to animals are herein examined and compared. Correlations between biological activities and physicochemical attributes of X-phenols reveal strong consistencies between various models. Two parameters in particular, hydrophobicity and electronic terms dominate the extent of interactions between these chemical entities and their molecular targets. Hydrophobicity is represented by π values or partition coefficients while electronic contributions are delineated by molecular orbital indices or Hammett sigma constants. They help us to define the similarity in these mechanistic models that allow for an understanding of forces that are at play at the molecular level.
Many chemical compounds induce some form of reaction in a biological system that responds in an appropriate manner. Biochemical toxicology focuses on the mechanisms underlying toxicity at the molecular and cellular level as well as factors that determine or impact toxicity. It is manifested in two ways: the effects of compounds on the organism or biological receptor or by the effects of the organism on the chemical compound. These complex interactions are affected by pharmacokinetic and pharmacodynamic processes.1,2)
The pharmacokinetic parameters include the absorption, distribution, metabolism and excretion of a toxicant by the body. The uptake of a xenobiotic is primarily determined by the structure of the membrane and its physicochemical attributes. The very nature of cell membranes as defined by their lipid bilayers interspersed with proteins ensures that lipophilicity is the most important determinant in the absorption of exogenous chemicals.3) Distribution usually entails the sequestration of toxicants by blood proteins such as serum albumins and hemoglobin and while various types of toxicant–protein interactions involving hydrogen bonding, van der Waals forces, ionic bonding and covalent bonding are important, lipophilicity plays a dominant role in these interactions.4) Metabolism involves either a Phase 1 modification of a toxicant to a more polar entity susceptible to further transformation in a Phase 2 reaction, and/or a Phase 2 direct transformation via conjugation with an endogenous, polar compound such as glucuronic acid that is rapidly excreted. The most prominent Phase 1 reactions involve the nucleotide adenine dinucleotide phosphate (NADP)-molecular oxygen catalyzed activities of the cytochrome-P450 monooxygenases. The substrate specificity of the cytochrome-P450 isozymes is defined by lipophilicity as well as size and ionization status of the xenobiotics.5)
It is well established that not all xenobiotics are detoxified and excreted. Some of them may be metabolized to more reactive species that are ultimately responsible for the toxic biological end points that are observed. This constitutes the pharmacodynamic phase of xenobiotics. They can be substrates or inhibitors of enzymes or receptors and their activation could take place in hepatocytes, nuclei or the mitochondria.6) Thus systematic and comprehensive toxicological studies of classes of potential xenobiotics in combination with computational analysis are valuable in delineating their mechanism of action and subsequent risk assessment.6)
Phenolic compounds and their derivatives are constituents of numerous synthetic and natural chemicals that include drugs, dyes, agricultural products, pesticides, food additives and cosmetics.7,8) Their bewildering and often confounding array of biological/toxicological activities has led to enhanced scrutiny of their structure-activity relationships at the molecular and cellular level. Thus, phenolic-based compounds provide an excellent opportunity to not only examine the biological activities of mono, di and poly-phenolics but also to analyze mechanistic details in a comparative fashion using the quantitative structure activity relationship (QSAR) paradigm.9,10)
Phenols toxicities have been extensively investigated in aquatic organisms such as protozoa, tadpoles, fleas, green algae, aquatic and terrestrial bacteria, plants, fish and mammalian systems.
1.1. Tetrahymena pyriformisTetrahymena pyriformis is a teardrop-shaped, unicellular, ciliated freshwater protozoan that is very common in aquatic habitats. Its short generation time coupled with its ability to grow to high cell density in inexpensive media makes this species a valuable tool for studies in toxicology and ecotoxicology. To date, the main mechanism underlying the acute toxicity of phenols to T. pyriformis is polar narcosis that has been modeled very well by using log P (hydrophobic parameter) with or without the use of other parameters such as pKa (acid dissociation constant), electrophilicity (ELUMO; the energy of the lowest unoccupied molecular orbital), Hammett constant (σ), etc.
The toxicity of a heterogeneous series of 30 para-substituted phenols to T. pyriformis has been well predicted by a QSAR model based on pKa values and hydrophobicity. Hydrophobicity is an intrinsic molecular property relating to the “aqueous-avoidance” characteristic of a compound. It is parameterized by the equilibrium partition coefficient, P of a compound between n-octanol and water that is mostly represented by log P or log Kow.
 |
Equation (1). delineates the toxicity of substituted phenols (X-phenols) to Tetrahymena pyriformis11):
 | (1) |
IGC50 is the 50% growth inhibitory concentration (mmol/L) of each phenol to T. pyriformis. This QSAR suggests that the predictability of polar narcosis of phenol toxicity depends on hydrophobicity and acid dissociation constants of the substituted phenols. In Eq. (1) as well as all the other equations, n is the number of compounds, r is the correlation coefficient, s is the standard deviation and q2 is the cross-validated r2. F is the Fischer statistic that is represented by the following equation: Fm,f=fr2/[(1−r2)m], where f is the number of degrees of freedom [f=n−(m+1)], n is the number of data points, m is the number of descriptors and r is the correlation coefficient.
The importance of quantum mechanics electronic parameters in toxicology of phenols becomes apparent, when the descriptor ELUMO in combination with log P leads to excellent statistical relationships. Cronin and Schultz12) investigated the acute toxicity of 166 phenols to the T. pyriformis, of which 120 phenols were designated as acting via polar narcosis, and used in the development of Eq. (2):
 | (2) |
In this equation, log P describes the hydrophobic-dependent penetration of the phenols while ELUMO refers to the energy of the lowest unoccupied molecular orbital.
Using the same data set of Eq. (2), Garg et al.13) developed a simple and mechanistically relevant QSAR for the toxicity of phenols to T. pyriformis, in which they demonstrated a similar relationship (Eq. (3)) replacing ELUMO with Hammett constant (∑ σ):
 | (3) |
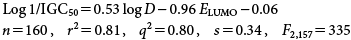
An effort was also made by Cronin et al.14) to model the toxicity of a diverse set of 200 phenols to T. pyriformis using distribution coefficients (log D) at pH 7.35 and ELUMO (Eq. (4)):
 | (4) |
The statistics of Eq. (4) are poor. This may be attributed to the heterogeneity of the phenol data set that represents a variety of electrophilic mechanisms of toxic action including polar narcosis, weak acid respiratory uncoupling, soft electrophilicity, and also those phenols capable of being metabolized or oxidized to quinones. Thus by sequestering phenols with respect to their structural features as well as their enhanced toxicity based on Eq. (4), the following Eq. (5) was developed.14)
 | (5) |
Ionized and unionized forms make different contributions to toxicity; the unionized form plays a more important role than the ionized form since the toxicity of phenols decreases as the pH increases. It must be noted that nearly all the di- or more halogen substituted phenols and the nitro-phenols (highly electron-withdrawing phenols) are partially ionized at pH 7.35. In order to investigate the effect of ionization, Eq. (6) was developed for the toxicity of a diverse set of 207 phenols to T. pyriformis.15)
 | (6) |
In this model, F0 is the fraction of neutral (unionized) form in water that can be regarded as the correction factor for the degree of ionization of phenols. F− is the fraction of the negatively charged form of the phenolic hydroxyl groups, rather than the –COOH group. This large data set contains four phenols with the COOH moiety. Thus the ionized form of phenols can lead to toxicity, but not the ionized form of carboxylic acids. It is in agreement with the findings of Selassie, et al.,16) that the polarization of the –OH moiety by the substituent may enhance its toxicity. In addition, the fraction of negatively charged form (F−) may reflect the electrophilicity of phenols.17) Thus, a similar relationship (Eq. (Eq. 7 )) was developed by replacing F− term in Eq. (6) with ELUMO.
 | (7) |
It must be noted that the fraction of negatively charged form (F−) may also reflect the propensity of phenolic –OH group to form radicals, which supports the evidence that a variety of toxicities occur through phenoxy-radicals.16)
In order to investigate the underlying toxicity mechanism of di- and tri-hydroxybenzenes, Eq. (Eq. 8 ) was developed for the toxicity of 18 di- and tri-hydroxybenzenes to T. pyriformis.18)
 | (8) |
In this equation, the activation energy index (AEI) is based on the changes in energy of the frontier molecular orbitals for di- and tri-hydroxybenzenes acting via the Michael addition mechanism of action. On the basis of this equation, it has been suggested that the toxicity of these phenols may be attributed to their ability to be oxidized to quinone-type species, which then react via subsequent electrophilic Michael addition.
1.2. Rana japonica tadpolesAmphibian species have proved to be more sensitive bio-indicators of aquatic contaminants than many other aquatic vertebrates. Tadpoles, the larvae of frogs are more sensitive to hazards than adult frogs and therefore useful for the performance of standardized, acute toxicity assessment bioassays.19) Rana japonica tadpoles are very common and more sensitive to hazards than other tadpoles.20) It is thus interesting and of value to investigate the acute toxicity of phenols on Rana japonica tadpoles in order to protect this species and the aquatic environment.
The toxicity of 24 phenol derivatives to Rana japonica tadpoles was modeled by Wang et al., using hydrophobicity as the key variable.21) Substituted phenols included 2-, 3- and 4-nitrophenols; 4-chloro-2-nitrophenol; 2- and 4-chlorophenols; 2,4-dichlorophenol; 4-bromophenol; 2-bromo-4-methylphenol; 4-fluorophenol; 2- and 4-methoxyphenols; 2- and 4-methylphenols; 2,6-dimethylphenol; salicylaldehyde; 4-hydroxybenzaldehyde; salicylic acid; methyl 4-hydroxybenzoate; resorcinol, 3-aminophenol, 4-hydroxyacetophenone; 4-tertbutylphenol and phenol. See Eq. (9):
 | (9) |
Log 1/LC50 is the acute semi-static 24-hr toxicity (mol/L) of phenols to Rana japonica tadpoles. This model was further improved by addition of a pKa term and removal of one compound, methyl 4-hydroxybenzoate due to the lack of availability of its pKa value; see Eq. (10):
 | (10) |
On the basis of Eq. (10), the authors suggested that polar narcosis constituted the key mechanism for the acute toxicity of phenol derivatives to Rana japonica tadpoles.21) A general and robust QSAR model (Eq. (11)) was also developed for the acute toxicity (24 hr semi-static exposure) of a series of 31 diverse phenols to Rana japonica tadpoles using four descriptors.22) In addition to the original data set (n=24) mentioned above, seven new phenols were included in this study: 2-nitro-resorcinol; 2-hydroxyl-5-chlorobenzoic acid; 4-hydroxy-benzylacetic acid; methyl 2-hydroxylbenzoate; bisphenol-A; diphenylolsulfoxide and 1,1-diphenylol ethane.
 | (11) |
The descriptor HOF reflects the conformational stability of the phenols in kcal/mol, while 1χp represents the first order connectivity index. Since no stepwise regression analysis was undertaken, it is difficult to assess the statistical contributions of the last two descriptors to overall toxicity. Reformulation of this model and exclusion of three carboxylic acids from this analysis led to the development of the following model.23)
 | (12) |
Daphnia magna is a species of Daphnia (a cladoceran freshwater flea), which is widely used as a laboratory animal for ecotoxicity testing. They are easy to culture, requiring only water containing bacteria or their equivalent for food. They can be grown individually in small bottles or in mass culture in large aquaria. Cronin et al.24) examined the toxicity of 11 substituted phenols (X=H; 2-CH3; 3-CH3; 4-CH3; 2-NO2; 3-NO2; 2–4-(NO2)2; 2-4-Cl2; 2-4-6-Cl3; 2-3-4-5-6-Cl5 and 3-OH) to Daphnia magna at three different pH conditions (pH=6.0, 7.8, and 9.0) in order to develop QSAR models (Eqs. (13)–(15)). During the QSAR modeling process, two phenols (2,4-dinitrophenol and resorcinol) were identified and thought to be acting by a polar narcosis mechanism of toxic action. They were removed from the analysis.
 | (13) |
 | (14) |
 | (15) |
At all pH values, Eqs. (13)–(15) for phenols showed a strong dependence of toxicity on hydrophobicity. From the experimental toxicity data, it is clear that the toxicity of phenols decreases with increasing pH. These variations in toxicity are clearly brought about by the effect of ionization. Thus, the toxicity of phenols decreases with an increasing proportion of ionized molecules. It is also believed that the ionized form of phenols does contribute to their toxicity. However, the decreased overall toxicity suggests that a lower relative toxicity is attributable to the ionized form. The authors suggested using Eqs. (16) or (17) to calculate IC′50 (in mol/L) of the unionized form of the phenol that can be used to calculate toxicity (log 1/IC′50) of phenols under different pH conditions.25)
 | (16) |
 | (17) |
Note that (IC50)pH x is the observed toxicity of phenol at pH x.
1.4. Green algaeShigeoka et al. determined the acute toxicity of 13 chlorophenols including phenol using two species of green algae, Selenastrum capricornutum and Chlorella vulgaris, according to OECD guidelines.26) The toxicity data (EC50 in ppm) at 96 hr was used to develop a number of QSAR models, of which some important ones are listed below:
Toxicity of chlorophenols to Selenastrum capricornutum
 | (18) |
 | (19) |
Toxicity of chlorophenols to Chlorella vulgaris
 | (20) |
 | (21) |
The strong collinearity between log P and the sigma term as well as the limited size of the dataset precludes the inclusion of both these parameters in the same model. Equation (21) is not a robust model.
1.5. Aquatic bacteriaThe Shk1 assay is a procedure for wastewater toxicity testing based on the bioluminescent Pseudomonas, Shk1whose parent strain originated from activated sludge. The toxicity of 23 phenols was measured using the Shk1 assay, and EC50 values were obtained. The EC50 values (mmol/L) were then used to develop a QSAR model (Eq. (22)) that was primarily based on hydrophobicity; one phenol, 2,6-dimethoxyphenol was an outlier.27)
 | (22) |
The influence of pH on the toxicity of 11 chlorophenols including phenol to fish (guppies) was determined at 3 pH conditions (pH=6.1, 7.3, and 7.8) and the obtained LC50 values in μmole/L were used to develop the following QSAR models.28)
 | (23) |
 | (24) |
 | (25) |
The above QSAR models were further modified by adding a pKa term as seen in Eqs. (26)–(28).
 | (26) |
 | (27) |
 | (28) |
There is no significant influence of pKa term in Eq. (26) at pH 6.1, but Eqs. (27) and (28) show improved statistics compared to the corresponding equations without pKa. The positive pKa in Eq. (27) (pH=7.3) and Eq. ((28) (pH=7.8) suggests that more acidic compounds are less toxic than their less acidic, but equally hydrophobic counterparts. This effect has all but disappeared at pH 6.1. Thus, the toxicity of chlorophenols to fish (guppies) depends strongly on the pH: ionization effect of chlorophenols.
Using a flow-through method, Veith and Mekenyan derived the following equation for toxicity of phenols to Promelas pimephales in a much larger, more diverse dataset. Their model is described below.29)
 | (29) |
Rose and Hall used topological descriptors to model the fish toxicity of a diverse set of 25 phenols to Poecilia reticulate.30) See Eq. (30).
 | (30) |
LC50 is the lethal concentration that reduces the fish population by 50% for Poecilia reticulata. 1χv is the first order molecular connectivity valence chi index and its positive coefficient suggests that increased branching leads to decreased toxicity. The second descriptor for the model is the atom-type E-State descriptor for chlorine atoms, ST(–Cl), encoding the electron accessibility for chlorine atoms in each molecule. Electropositive atoms in close proximity to chlorine tend to increase the descriptor value. Thus, the positive coefficient of ST(–Cl) suggests that the presence of more chlorine atoms and more polar chlorines tends to increase the toxicity. The third descriptor in the model is the atom-type E-State descriptor for ether atoms, ST(–O–), encoding the electron accessibility for ether atoms. The smaller, negative coefficient on ST(–O–), results in higher toxicity.
Terrestrial bacteria, Burkholderia species RASC c2 and Pseudomonas fluorescens were previously marked with luxCDABE genes encoding for bacterial bioluminescence and utilized to evaluate the toxicity of mono-, di- and tri-chlorophenols. See Fig. 1.

EC50 values were obtained and the following QSAR models (Eqs. (31) and (32)) were then developed by Boyd et al.31)
Toxicity of mono-, di- and tri-chlorophenols to RASC c2 (marked with lux genes)
 | (31) |
The toxicity of the same dataset of mono-, di- and tri-chlorophenols was determined in P. fluorescens (marked with lux genes)
 | (32) |
In Eqs. (Eq. 31 ) and (32), q+ is the most positive formal charge on a hydrogen atom, q− is the most negative formal charge, εa is the ELUMO for the molecule scaled to the EHOMO of water, π* defines the ease of polarizability of an electron cloud and R is the Pearsons correlation coefficient.
Re-analysis of Eqs. (31) and (32) gave the following simple but excellent and mechanistically relevant QSAR Eqs. (33) and (34).32) The 2,4,6-tri-chlorophenol was an outlier in this study.
Toxicity of mono-, di- and tri-chlorophenols to RASC c2 (marked with lux genes)
 | (33) |
The toxicity of mono-, di- and tri-chlorophenols to P. fluorescens (marked with lux genes) was assessed and 4-chlorophenol was deemed to be an outlier.
 | (34) |
Note that Eqs. (31) and (32) utilize EC50 in mmole/L while Eqs. (33) and (34) use mol/L.
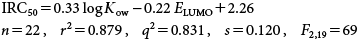
2.2. PlantsIncreasing concern about the toxicological effects of chemicals to all animal and plant species has led to the development of aquatic toxicity-based QSAR of substituted phenols in significant numbers. However, little emphasis has been placed on the assessment of phenol toxicity to plant species. In recent years moderate efforts have been made to assess the effects of phenols and their derivatives on seed germination and root elongation.33,34) Using the data of Wang et al.,33,34) the following models that pertain to the toxicity of substituted phenols to root elongation of Cucumis sativus, were formulated. See Eq. (35). IRC50 is the negative logarithm of the 50% inhibition concentration (mol/L) of 2 d root elongation. Twenty-two diverse, substituted phenols were used in this analysis. Substitutions included 3-NO2; 2-Cl; 4-Cl; 2,4-Cl2; 4-Br; 2-Br, 4-CH3; 4-F; 4-OCH3; 2-OCH3; 4-CH3; 2-CH3; 2,6-(CH3)2; 4-COOCH3; 3-OH; 4-OH; 2,3-(OH)2; 4-C(CH3)3; 4-OC6H5; 2-COCH3, 3-OH; H; 2-naphthol and 1-naphthol.
 | (35) |
The addition of ELUMO in the log Kow-based Eq. (35) resulted in a greatly improved two-parameter model as seen in Eq. (36):
 | (36) |
Five bio-reactive molecules were not included in the above analyses. They are 2-nitrophenol; 4-nitrophenol; 4-chloro, 2-nitrophenol; 2-aminophenol and 1,4-naphthoquinone. These two models, Eq. (35) and (36) specifically focused on the involvement of a polar narcotic mechanism for the inhibition of root elongation of Cucumis sativus by phenols.
In an extended QSAR study, Eq. (37) was developed for the inhibition of germination rates by 42 substituted phenols. In addition to the already mentioned 26 phenols (1,4-naphthoquinone was removed from the initial study) above, the following 16 new phenols were added: 2,4-dinitrophenol; 2-nitroresorcinol; 4-fluoro, 2-nitrophenol; 2-hydroxy-5-chlorobenzoic acid; salicylaldehyde; 4-hydroxybenzaldehyde; salicylic acid; 4-hydroxylbenzoic acid; 2-hydroxyl methyl benzoate; bisphenol A; bisphenol S; bisphenol E; pyrocatechol; 3-aminophenol; 4-hydroxylacetophenone and 3-hydroxylbenzoic acid.
GC50 (mol/L) is the concentration of each phenol that induces a 50% germination rate.
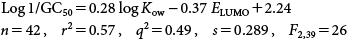 | (37) |
After removing five poorly predicted phenols (2-OH, 5-Cl benzoic acid (pKa 4.20); 4-OH benzoic acid (pKa 4.58); 3-OH benzoic acid (pKa 4.08), 4-Cl, 2-nitrophenol (pKa 4.09) and hydroquinone (pKa 9.81), the above QSAR was modified as follows:
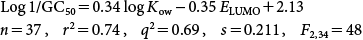 | (38) |
The above results indicated that utilization of a response-surface analysis allowed for the inclusion of mostly polar narcosis-inducing and bioreactive phenols. Three of the benzoic acids are outliers. However, salicylic acid fits moderately well despite its strong acidic character (pKa=2.98). Its strong intramolecular hydrogen bonding enhances its hydrophobicity which balances the negative aspects of its ionization. 4-Chloro, 2-nitrophenol is a very strong acid and more like a benzoic acid in terms of its ionization.
Many studies have demonstrated that various substituted phenols affect energy production in cells by interference with mitochondrial activities; they curtail the electrochemical gradient in the inner mitochondrial membrane.35,36) In an elegant study, Miyoshi et al.,35) examined the protonophoric activity of 19 substituted phenols (X=H; 4-Me; 4-Et; 4-n-Pr; 4-t-Bu; 4-t-Pentyl; 4-Cl; 2,4-Cl2; 2,4,6-Cl3; 3-CF3; 4-CN; 4-COMe; 3-NO2; 2,4-(NO2)2; 2-Me-4,6-(NO2)2; 2-Et-4,6-(NO2)2; 2-i-Pr-4,6-(NO2)2; 2-t-Bu-4,6-(NO2)2 and 2-sec-Bu-4,6-(NO2)2) in rat liver mitochondria and developed the following QSAR that delineates the importance of two key parameters, partition coefficients and acid dissociation constants in uncoupling activity at pH 7.4. See Eq. (39).
 | (39) |
The same data was used to revise this equation to obtain the relevant statistics
 | (39b) |
In both equations, C200 represents the concentration of each phenol that induces a 200% increase in mitochondrial respiration rate with respect to controls. P (L/W) represents the overall partition coefficient of each phenol between aqueous (W) and liposomal (L) membranes of the neutral and ionized species at pH 7.2. It should be noted that usage of octanol–water partition coefficients of the neutral species was inadequate. This strong dependence on aqueous-partition coefficients and dissociation constants was also apparent in potencies to increase proton permeability (r2=0.94). This strong correspondence between the two models underscores the strong relationship between the uncoupling activity in mitochondria and increased proton permeability across the liposomal membrane.
3.2. Toxicity of phenols to mammalian SMP (sub-mitochondrial particles)The toxicity of a series of fourteen (poly)chlorophenols (X=2-Cl; 4-Cl; 2,3-Cl2; 2,4-Cl2; 2,6-Cl2; 3,4-Cl2; 3,5-Cl2; 2,3,4-Cl3; 2,4,6-Cl3; 2,4,5-Cl3; 2,3,6-Cl3; 2,3,5-Cl3; 2,3,5,6-Cl4 and 2,3,4,5,6-Cl5) as determined by a short-term in vitro assay based on mammalian SMP was found to be well correlated with either log P or Hammett ∑ σ as shown in Eqs. (40) and (41), respectively.37)
 | (40) |
 | (41) |
In these equations, EC50 represents the concentration of phenol toxicant affecting the rate of the reverse electron transfer (RET) process by 50%. The significant presence of the hydrophobic parameter suggests that the ability of chlorophenols to partition into the lipid bilayer of the mitochondrial membrane plays a major role in determining their toxic effects on respiratory functions. Moreover, the regression analysis also points to the important relationship between the strongly electron-withdrawing attributes of the chloro substituents as represented by Hammett ∑ σ, and their toxicity. This parameter reflects the influence of the chloro substituents on charge distribution within the molecule. According to the hypothesized mechanism of protonophoric uncoupling action, enhanced toxicity will ensue from the greater stability of the phenolate anion in the low polar medium represented by the lipid bilayer of the membrane.37) It should be noted that the two variables log P and ∑ σ are not orthogonal and thus cannot be utilized in the same model.
3.3. Toxicity of phenols in isolated rat hepatocytesQuantitative structure toxicity relationships (QSTR) were developed by Moridani et al., to predict and describe the cytotoxicity of 30 phenols and capsaicin to isolated rat hepatocytes, using LD50 (concentration of phenol to induce 50% cytotoxicity in isolated rat hepatocytes in 2 hr and in µmol/L) and log P.38) Mostly mono- and di- substituted phenols and capsaicin were analyzed in this study. The substituents were as follows: 2,4-(C(CH3)3)2; 2,4-(NO2)2; 4-C(CH3)(CH2CH3); 2,4-Cl2; 2-C(CH3)3; 4-C(CH3)3; 4-NO2; 4-C6H5; 3-C(CH3)3; 2-Cl; 4-OC4H9; 4-C3H7; 4-Cl; 4-OH; 3-Cl; 4-CH(CH3)2; 3-NO2; 2-OH; 3-OCH3; 4-OC3H7; 4-C2H5; 2-OCH3; 2-CH3; 4-CH3; 3-CH3; 4-OC2H5; H; 2-NO2; 4-OCH3; 3-OH and capsaicin. The following Eqs. (42)–(45), using various descriptors were delineated by Moridani et al., and q2 values were not calculated in this study.
 | (42) |
The outliers in Eq. (42) are hydroquinone; catechol; 4-nitrophenol and 2, 4-dinitrophenol.
 | (43) |
In this double parameter model, the outliers were hydroquinone; catechol and 2-nitrophenol. The presence of outliers indicates that other factors or specific mechanisms other than hydrophobicity and the degree of ionization maybe at play in the isolated hepatocytes. This equation also suggests that substituted phenols with lower pKa and higher log P values will be more toxic than their higher pKa and lower log P counterparts. Using the same data, the acid dissociation constant pKa was replaced with the Brown variant of the Hammett constant σ+, resulting in the development of Eq. (44).
 | (44) |
According to this equation, phenols with electron-withdrawing groups (positive σ+ values) are more toxic, whereas phenols with electron-releasing groups (more negative σ+ values) are less toxic toward isolated rat hepatocytes. Replacing σ+ values with bond dissociation energies (BDE) resulted in the formulation of Eq. (Eq. 45 ):
 | (45) |
In this case the outliers were hydroquinone, catechol, 2-nitrophenol and 4-nitrophenol while four other phenols (2,4-di-t-butyl phenol; 2,4-dichlorophenol; 2,4-dinitrophenol and capsaicin) were also removed due to unavailability of their BDE values. Similarly, Eq. (Eq. 45 ) also suggests that phenols with electron withdrawing groups and more negative BDE were more toxic towards isolated rat hepatocytes. These authors have suggested that since lower values of σ+ and BDE of phenols induce toxicity by expressing the ability to form radicals, their results imply that phenoxy radical formation does not play a major role in the toxicity of simple phenols to hepatocytes, and mitochondrial uncoupling could be a more likely toxicity mechanism.35,39)
A careful reevaluation of Moridani’s data38) was carried out and the following QSTR models, Eqs. (46)–(49) were obtained.32) Also, LD50 values are delineated in mol/L. Note that capsaicin was not included in any of these calculations due to the non-availability of accurate sigma plus (σ+) and BDE values.
 | (46) |
In this case, the outliers are hydroquinone; catechol; 4-nitrophenol; 2-chlorophenol and 2,4-dinitrophenol. C log P is the calculated log P.
 | (47) |
The outliers were hydroquinone; catechol and 2-nitrophenol. This equation is similar to Eq. (43) and suggests that toxicity is enhanced by increasing hydrophobicity and lowering pKa. Further analysis using σ+ and BDE led to the delineation of Eqs. (48) and (49).
 | (48) |
 | (49) |
These toxicity models in rat hepatocytes differ considerably from the following models that pertain to L1210 murine leukemia cells which are rapidly growing cells. Hepatocytes are generally slower growing cells. There is much stronger dependence on hydrophobicity and the electron withdrawing capacity of the substituted phenols. These factors augur strongly for the involvement of mitochondrial uncoupling in hepatocytes that subsequently results in eventual toxicity at high concentrations. The outliers, hydroquinone and catechol can easily undergo oxidation to quinones via a phenoxy radical mechanism.
3.4. Toxicity of phenols to mammalian cells3.4.1. Murine leukemia L1210 CellsExtensive studies have been conducted on the toxicity of substituted phenols to L1210 murine leukemia cell line. The QSAR for the inhibition of growth of L1210 cells by electron-releasing phenols is outlined as follows40):
 | (50) |
 | (51) |
ID50 represents the molar concentration of phenol that induces 50% growth inhibition in murine leukemia L1210 cells, BDE is the energy associated with the abstraction of a hydrogen atom from the hydroxy moiety. In both models, the low coefficient with log P suggests that the radical may be interacting with a receptor such as DNA or it may represent an enhanced transport of the phenoxy radical in the cellular environment.
The QSAR for the inhibition of growth of L1210 cells by phenols with electron-withdrawing substituents such as 4-NO2; 4-Cl; 4-I; 4-CHO; 4-CN; 4-Br; 4-CONH2; 4-SO2NH2; 3-NO2; 3-NHCOCH3; 3-Cl; 3-Br; 3-CN; 3-OCH3 and 3-F was analyzed separately.41)
 | (52) |
Selassie et al., also examined the activation of caspases and subsequent apoptosis of a library of phenols in a murine leukemia cell line.42) Results were then compared with their corresponding cytotoxicity in the same cell line to determine if apoptosis plays a major role in the overall cytotoxicity of mono-phenolic compounds. The following QSAR equations were derived:
 | (53) |
I50 is the concentration of each substituted phenol that induces caspase-mediated apoptosis by 50%. The hydrophobic parameter π2,4 represents the sum of the hydrophobicity of substituents in the ortho and para positions. B52 and B53 are Verloop’s sterimol descriptors that measure the width of larger substituent in the ortho and meta positions, respectively. In the above model, 81% of the variance in the data is explained only by the steric parameter B52, which led the authors to suggest a receptor-mediated interaction of phenols with caspases or mitochondrial proteins being the likely targets.42)
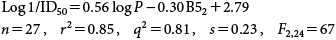
The cytotoxicity of 65 phenols with electron-releasing substituents in the same cell line led to the development of the following QSAR model (see Eq. (54))42):
 | (54) |
The presence of σ+ in the above equation is confirmation of the previous suggestion that radical stabilization is of prime importance for electron-releasing substituents. B52,6 represents the sum of the width of the substituents in the ortho positions; these substituents flank the labile hydroxy group. I1 and I2 are indicator variables that pinpoint the unusual activities of the ortho methyl and methoxy substituents, respectively.
The following QSAR for the interactions of 27 heterogenous, phenols with electron-withdrawing substituents [X=H; 4-CONH2; 4-NO2; 4-I; 4-SO2NH2; 4-CHO; 4-Cl; 4-Br; 4-CN; 3-NO2; 3-NHCOCH3; 3-Cl; 3-OCH3; 3-Br; 3-CN; 3-F; 3-OH; 2-Cl; 2-CN; 2-NO2; 2-Br; 2-I; 2-CF3; 2,6-(C(CH3)3)2-4-NO2; 2-CH3-4-NO2; 2-CH3-4-COCH3 and 2,6-(C(CH3)3)2-4-CN] was also developed (see Eq. (55))42):
 | (55) |
In Eq. (Eq. 55 ), log P is of critical importance in describing the cytotoxicity, since it accounts for 81% of the variance in the data. The significant differences between the cytotoxicity and apoptosis QSAR models suggest that cytotoxicity involves minimal apoptosis by most of these substituted mono-phenols.
3.4.2. CCRF-CEM cellsThe following model was also developed for the inhibition of growth of CCRF-CEM cells by electron-releasing phenols with the following para substituents: NH2; OC6H13; CH3; C(CH3)3; H; OCH3; C3H7; C2H5; C8H17 and bisphenol-A.42)
 | (56) |
Since σ+ vs. NMR chemical shifts of δC(C–OH), yield excellent correlations (r=0.99), σ+ was replaced by 13C NMR chemical shift of the phenolic carbon (δC(C–OH)) that yielded a slightly improved QSAR (see Eq. (Eq. 57 ))43):
 | (57) |
The inhibition of growth of CCRF-CEM cells by para substituted phenols with electron-withdrawing groups (I, NO2, SO2NH2, CONH2 and Cl) was described by Eq. (58).42)
 | (58) |
Skin irritation assessment was evaluated by applying test solutions of twenty-four phenols to the dorsal skin of rabbits. Based on the hypothesis that skin irritation is induced by reaction of phenols with macromolecules present in epidermal and dermal levels of the skin, the following QSARs were developed by sequestering the phenols based on their positive and negative LUMO energies and utilizing molecular- based skin irritation scores (PII).44) Phenols with positive LUMO energies included resorcinol; pyrogallol; 4-aminoresorcinol hydrochloride; 2-methylresorcinol; 4-ethylresorcinol; 4-tert-butylcatechol; 3,5-dihydroxybenzyl alcohol; 3,4-dihydroxyphenylacetic acid; 4-ethylphenol; 4-tert-butylphenol; 3,4-dihydroxydihydrocinnamic acid phenol and 4-methoxyphenol. Skin irritation induced by phenols with positive LUMO energy levels.
 | (59) |
Phenols with negative LUMO energies were 2,4-dihydroxybenzoic acid; 2,4-dihydroxybenzaldehyde; 2-nitroresorcinol; 2′,4′-dihydroxyacetophenone; 2′,4′-dihydroxypropiophenone; 2,4-dihydroxybenzophenone; propylgallate; 4-hydroxyacetophenone; 4-hydroxybenzophenone; 4-phenylphenol and 2,3,4-trihydroxybenzophenone.
Skin irritation induced by phenols with negative LUMO energy levels
 | (60) |
On the basis of the above QSAR models especially Eq. (59), the authors suggested that phenols with positive LUMO react with amino acids as electron donors in both the epidermal and the dermal skin layers that results in irritation (based on log P). On the other hand phenols with negative LUMO react with amino acids only in the epidermis as electron donors; they are not dependent on skin permeability (based on absolute hardness), where, the absolute hardness (N)=(1/2)(IP−EA). However, the correlation with absolute hardness is not strong which suggests that the small size of the group and the lack of heterogeneity limits its utility.
Genotoxicity is an overarching term and refers to processes that alter the structure, information content or segregation of DNA and which are not necessarily associated with mutagenicity. Such processes include unscheduled DNA synthesis (UDS), sister chromatid exchange (SCE), DNA strandbreaks, DNA adduct formation, and mitotic recombination. Using EC50 data from the phenol-induced inhibition of replicative DNA synthesis in V79 Chinese Hamster cells, Richard et al., developed Eq. (61).45)
 | (61) |
Substituents on the phenols used in this study included: H; 2,4-diamino; 2 amino; 4-amino; 4-methyamino; 4-methyl; 3-amino; 4-acetylamino; 4-hydroxy; 2-acetylamino; and 2,6-dimethyl-4-acetylamino. Two of the substituted phenols (phenol and 4-hydroxyphenol) were excluded from the study. EC50 is the concentration of each phenol in mole/L that inhibits the rate of [3H]TdR incorporation in V79 Chinese Hamster cells by 50%. Both descriptors, σ+ and calculated molar refraction (CMR) contribute equally to the variance in the data. The negative coefficient of σ+ in the above model suggests that electron releasing substituents with reduced bulk enhance the genotoxicity of phenols which was directly attributed to the formation of a tyrosyl radical species at the active site of ribonucleotide reductase. Quenching of this radical by activated phenols would subsequently impede normal DNA replicative synthesis.
The following QSAR was developed by Hu and Aizawa and it examined the binding affinity to the estrogen receptor by a set of phenols (IC50, nmole/L), that includes phenol, eight alkylphenols (e.g. nonylphenol and octylphenol), four hydroxyl biphenyls, and bisphenol A.46)
HOMO energy levels represent the electron donating capability of a molecule while Vm represents the volume of phenols in cubic angstroms.
 | (62) |
Re-analysis of Eq. (62) (IC50, mol/L) yielded a more realistic and mechanistically relevant Eq. (63)32):
 | (63) |
This model suggests that the toxicity of phenols is enhanced by increasing their hydrophobicity and EHOMO. Since the EHOMO of phenols increases for electron donating groups (EDGs), the toxicity of phenols increases when EDGs are present on the aromatic ring. It must be noted that the intercept of this model is artificially inflated by the limited variation in the EHOMO values; a simpler model correlating estrogenic binding with hydrophobicity is described as follows:
 | (64) |
Four complex estrogenic phenols were not included in Eqs. (63) and (64) since it was apparent that their binding was significantly more specific in nature.
6.2. Maternal toxicityThe following QSAR models were developed by Kavlock in the assessment of developmental toxicity of rats induced by substituted phenols.47)
 | (65) |
 | (66) |
MTOX1 and MTOX2 are defined as doses (mmol/kg) that decrease maternal weight gain by 10 g at 24 and 72 hr respectively after treatment. The above QSARs suggest that the maternal toxicity of substituted phenols increases with increasing hydrophobicity. The negative coefficient of the Hammett σ constant further suggests that electron-releasing substituents enhance maternal toxicity of substituted phenols.
6.3. Toxicity of X-phenols to rat embryosQSARs pertaining to three toxicological end-points of 13 substituted phenols (X=H; 4-CN; 4-F; 4-Br; 4-NO2; 4-CH3; 4-I; 4-Cl 4-OCH3; OC5H11; 4-OC7H15; 4-NH2 and 4-OH) on rat embryos were originally developed by Hansch et al.48) and recently revised. These models include the following toxicity indicators:
Somite number of rat embryos
 | (67) |
Tail deformation in rat embryos
 | (68) |
In this case, two substituted phenols were not tested (4-OCH3 and 4-OC7H15) and two phenols were outliers (4-CH3 and 4-NO2). The 4-NO2 phenol was much more active than it should be and that could be attributed to its metabolism to active intermediates while the 4-CH3-phenol was not as active as expected.
Loss of weight (10 g/24 hr) induced in pregnant rats.48)
 | (69) |
Equation (70), was developed for the lethal toxicity to mice induced by a series of 28 substituted phenols with the following substituents: H; 4-Cl; 2-Cl; 2,4-Cl2; 2-Br; 2-C2H5; 4-C2H5; 4-NO2; 4-I; 2,4-(CH3)2; 3,5-(CH3)2; 4-C6H5; 2-F; 4-F; 2-CH3; 2-Br,4-CH3; 4-C3H7; 4-C(CH3)3; 2-C(CH3)3; 2-SC4H9; 2-C(CH3)3, 4-CH3; 4-C(CH3)3, 2-CH3; 4-Br; 2-Cl,4-NO2; 3-OH; 4-OCH3 and 2-NO2. Two derivatives (2-C(CH3)3, 4-CH3 and 2-Cl,4-NO2) were not included in the derivation of the equation49):
 | (70) |
A comparison of these QSAR models on the toxicity of substituted phenols is shown in Table 1. A comparative QSAR study can be carried out in two ways: considering toxicological systems within a particular class or the toxicological systems among all classes. In aquatic organisms, the six QSARs (Eqs. (2), (12), (14), (18), (22) and (29)) are well correlated with log P with a range from 0.58 to 0.89; this suggests that the overall toxicities of X-phenols are directly proportional to their associated hydrophobicity values. Along with log P, the three QSARs (Eqs. (2), (12) and (29)) based on larger data sets include an electronic term, ELUMO with a negative coefficient (−0.42 to −0.67) that suggests that toxicities of substituted phenols are enhanced by increased hydrophobicity and lower ELUMO values as shown by substituents that are better electron acceptors. This relationship indicates that an increase in ELUMO is associated with a decrease in toxicity. For the terrestrial organisms, Eqs. (33) and (38) are not very similar although Eq. (38) which is based on a larger data set is more in line with the models pertaining to aquatic organisms i.e. its toxicity is well delineated by log P and ELUMO.
| System | n | Hydrophobic | Electronic | Intercept | QSAR # |
|---|---|---|---|---|---|
| A. Aquatic organisms | |||||
| 1. Tetrahymena | 120 | 0.67 log P | −0.67ELUMO | −1.12 | 2 |
| 2. Tadpoles | 28 | 0.82 log P | −0.53ELUMO | +1.55 | 12 |
| 3. Daphnia magna (fleas) | 9 | 0.82 log P | — | +2.03 | 14 |
| 4. Green algae | 13 | 0.89 log P | — | −1.55 | 18 |
| 5. Aquatic bacteria | 22 | 0.58 log P | — | −1.12 | 22 |
| 6. Guppies | 114 | 0.58 log P | −0.42ELUMO | −2.41 | 29 |
| B. Terrestrial organisms | |||||
| 1. Bacteria | 14 | 1.09 log P | — | +1.11 | 33 |
| 2. Plants | 38 | 0.60 log P | −0.71ELUMO | +2.24 | 38 |
| C. Mammalian toxicity | |||||
| 1. Rat mitochondria | 19 | 1.29 log P | +0.53 log Ka | +5.23 | 39 |
| 2. Sub-mitochondrial particles | 14 | 0.91 log P | — | +2.02 | 40 |
| 3. Rat hepatocytes | 27 | 0.55 log P | +0.56σ+ | +1.56 | 48 |
| 4.Mouse L1210 cells | 51 | 0.18 log P | −1.35σ+ | +3.31 | 50 |
| 5. Mouse L1210 cells | 15 | 0.62 log P | — | +2.35 | 52 |
| 6. CCRF cells | 10 | 0.28 log P | −1.52σ+ | +2.69 | 56 |
| 7. CCRF cells | 5 | 0.64 log P | — | +2.14 | 58 |
| 8. Genotoxicity | 9 | −[1.02 CMR] | −0.74σ+ | +6.98 | 61 |
| 9. Estrogenic toxicity | 14 | 0.77 log P | — | +0.61 | 64 |
| 10. Maternal toxicity (24 hr) | 22 | 0.34 log P | −0.15σ | +0.12 | 65 |
| D. Whole animals | |||||
| 1. Rat embryos (somite no) | 11 | — | −0.65σ+ | +3.74 | 67 |
| 2. Rat embryos (tail defects) | 9 | — | −0.56σ+ | +3.66 | 68 |
| 3. Pregnant rats (weight loss) | 19 | 0.83 log P | −0.63σ+ | +1.13 | 69 |
| 4. Lethality to mice | 26 | 0.45 log P | +1.74 | 70 | |
In the mammalian class, the QSAR models have some common features that include hydrophobicity and electron density although the toxicological endpoints vary considerably; they run the gamut from cell growth inhibition to estrogenic toxicity/genotoxicity. Equations (50) and (56) and Eqs. (52) and (58) are very similar to each other with strong electronic contributions (−σ+) for only electron rich phenols. The toxicity of rat mitochondria (Eq. (39)) and rat hepatocytes (Eq. (48)) reveal a similar dependence on the electron withdrawing capabilities of these phenols (0.53 log Ka and 0.56σ+). This suggests that mitochondrial uncoupling in rat hepatocytes could be responsible for the eventual toxicity.
In studies pertaining to toxicity in animal embryos, Eqs. (67) and (68) are very similar to each other in terms of their electron donating abilities as represented by their σ+ constants. This implies that radical toxicity is at play in these fast growing embryonic cells. In contrast Eqs. (66) and (70) based on maternal rats and mature mice respectively share a common dependence on hydrophobicity only. It appears to be important in both species but their dependence on sigma constants varies significantly. It appears to be significant in the fast-growing cells of rats during gestation but does not play a major role in mature mice.
With respect to objectively assessing performance particularly with varied data sets, some of limited size, a comparison of a significant number of models provides external validation. A recurrence of particular parameters underlies the importance of these variables in delineating the toxicity of phenols. These models allow for mechanistic interpretation of the activity/reactivity of substituted phenols in different organisms and with different end-points. The use of physicochemical-attributes adds some realism to the interpretation of the QSARs at the current level of understanding toxicity effects of substituted phenols in organisms that run the gamut from tetrahymena to mice.
Dedicated to the late Professor Corwin Hansch and Professor Toshio Fujita.