Technical Reports
Hydrolytic decontamination of methyl parathion in the presence of 2-aminoethanol: Kinetics study
2018 Volume 43 Issue 1 Pages 41-46

Details
2018 Volume 43 Issue 1 Pages 41-46
Methyl parathion (MP) decontamination by hydrolysis in aqueous solutions containing 2-aminoethanol (EA) was investigated using the UV-Visible and GC/MS techniques. The kinetics of the hydrolysis reaction was studied at pH values of 4, 7, and 9 in water at 75, 85, and 95°C, respectively. At various EA concentrations 60, 100, and 200 mg/L MP degradation followed pseudo-first order kinetics and was found to be strongly pH and temperature dependent. The rate of MP degradation accelerated significantly as pH increased. The conversion reached 93.5% after 90 min of hydrolysis at a pH of 9, as compared to 69.9% and 49.8% at pH values of 7 and 4, respectively. The MP degradation byproducts removed from aqueous solutions by solid phase microextraction (SPME) were identified. The main intermediate products were p-nitrophenol and O,O-dimethyl phosphorothioate. This study concludes that hydrolysis in the presence of EA is an effective process for decontaminating solutions containing MP.
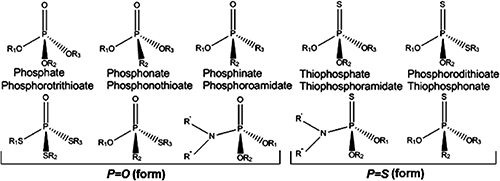
Recent decades have witnessed increased levels of environmental contamination with toxic organic compounds due to human activity. Industry is usually blamed for the introduction of pollutants into the environment. Of the compounds concerned, pesticides, although essential to improving the yield and diversity of cultures, are harmful to both humans and ecosystems. Some are resistant to environmental degradation and tend to accumulate in the food chain. The vast majority of pesticides are classified as organophosphorus compounds (OPs) and listed in the phosphorothioate category, with a predominance of the thiophosphoryl form (P=S) rather than phosphoryl form (P=O) (Fig. 1).
The acute toxicity of some OP pesticides with P=O bonding is mainly due to their ability to inhibit acetylcholinesterase (AChE), which plays a key role in the cholinergic system in terminating the action of the neurotransmitter acetylcholine, however those with P=S bonding do not possess anticholinesterase activities before biotransformation.1–4) Yet, in a fairly recent comparative study, it was revealed that the genotoxic and co-genotoxic potential in human hepatoma HepG2 cells may be even higher in parathion [O,O-diethyl O-(p-nitrophenyl) phosphorothioate] than in paraoxon [O,O-diethyl O-(p-nitrophenyl) phosphate].5) Poisoning by OP pesticides leads to severe cholinergic syndrome, which can cause seizures and death by respiratory failure.6) Common sources of exposure to pesticide toxicity for the general population include the ingestion of residues on food, in drink, or just breathing pesticide particles carried in the air. The exposure of people working in enclosed areas, farmers and those living near farms can be very high.
Therefore, there is considerable interest in developing efficient, cheap, and environmentally friendly techniques for the detoxification or decontamination of organophosphate-based pesticides and chemical warfare agents. Several methods have been proposed for the neutralization of organophosphorus compounds; those involving open-air combustion, incineration, diluting with water, and burying are broadly prohibited by national conventions.7) Transformation by chemical means is known to be the most efficient method. Over the past decade, research into the degradation of parathion and methyl parathion [O,O-dimethyl O-(p-nitrophenyl) phosphorothioate] by photolytic,8–10) bacteriological,11) ultrasonic, and UV irradiations12–14) has led to the development of effective methods that respect the environment.
Hydrolysis is one of the methods used in the detoxification of organophosphates. To enhance hydrolysis, various reagents such as nucleophiles, α-effect nucleophiles, metal complexes, metallomicelles, and biological catalysts and media such as micelles, micro-emulsions, solid supports, and latexes have been employed.15–18)
In the present study, we focused on the neutralization of methyl parathion (MP) by hydrolysis. The choice of this compound is mainly related to its extensive use in Algeria as a pesticide, often in contact with aquatic environments. Moreover, MP can be considered as a potential model for the study of the decontamination of nerve agents. Based on literature data, alkaline hydrolysis appears very favorable for this type of transformation.19–22) The experimental portion was especially based on the kinetics study of the hydrolysis of MP by decontamination with aqueous solutions containing 2-aminoethanol (EA) at different concentrations and under different values of pH and temperature, completing our first optimization work.23) It is easy to monitor the kinetics of hydrolysis by UV-Visible spectrometry (UV-Vis). MP degradation intermediate products were analyzed by gas chromatography coupled to electron ionization (EI) mass spectrometry (GC/MS mode EI).
EA (C2H7NO, 99.9% purity) and dichloromethane (HPLC grade) were purchased from Panreac. MP (C8H10O5NSP, purity 98%), phosphoric acid (H3PO4) and sodium hydroxide (NaOH) with 99.5% purity (used in dilute solutions to obtain the desired pH values), monobasic and dibasic potassium phosphate (KH2PO4/K2HPO4) with 98.6% purity (buffer solutions for the hydrolysis), and standard solutions of p-nitrophenol (C6H5NO3) and O,O-dimethyl phosphorothioate (C2H7O3PS) were obtained from Sigma-Aldrich (USA) and used without further purification. All other solutions were prepared daily with water distilled by the Nüve ND12 water purification system, presenting a pH value between 6.2 and 6.5.
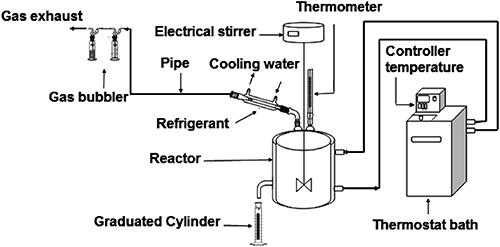
2. ExperimentsAll degradation experiments were conducted in a cylindrical borosilicate glass reactor (Fig. 2) purchased from SOMIVER (Thenia, Algeria). The reactor was filled with 200 mL of the test solution (30 mg/L). The test solution placed in the reactor was initially buffered to a pH of 7 (±0.01) by the addition of 10 mL of the phosphate buffer solution and was then adjusted to the desired pH by the addition of dilute H3PO4 or NaOH. EA was added in slight excess. The temperature of the reactor was kept constant with a water jacket and the reaction mix was electrically stirred at 500 rpm. The system was sealed to avoid volatilization and protected from the light to prevent photodegradation. Experiments were conducted for 90 min, in most cases, and the liquid samples (5 mL) were withdrawn every 15 min. The samples were placed in vials with a PTFE/silicone cap and extracted with dichloromethane (3×5 mL) before spectrometric analysis of the MP concentration. Each kinetics experiment was run in duplicate.
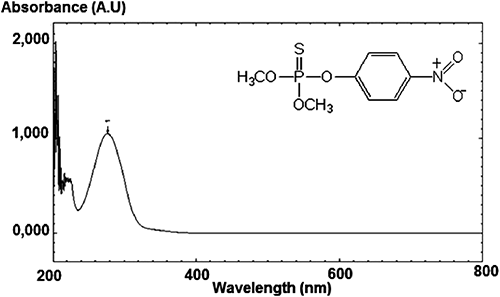
MP degradation was followed by a UV-Visible spectrophotometric analysis (UV-1800 Shimadzu driven by UVProbe software). A calibration curve of standard MP solution was constructed by plotting its concentration against absorbance at the UV λmax (CH2Cl2) 275.4 nm (Fig. 3).24) Good linearity was achieved from 0.1 to 50 mg/L with a correlation coefficient (R2) equal to 0.9995. The standard curve equation is as follows (1):
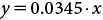 | (1) |
In order to further identify the intermediate organic compounds produced in the hydrolytic degradation of MP, reaction samples were extracted by SPME (65 µm PDMS/DVB) for 20 min adsorption at room temperature and analyzed by GC/MS mode EI. A Thermo Fisher Scientific GC Ultra-DSQII gas chromatograph-mass spectrometer equipped with a 30 m RTX-5MS column (thickness: 0.25 µm, diameter: 0.25 mm) from Restek was used to identify the degradation products. Helium (99.9999% pure) was used as carrier gas at a flow rate of 1 mL/min. The GC oven temperature program was: initial temperature 55°C for 1 min; 5°C/min gradient to 200°C, held for 2 min; 1°C/min gradient to 210°C, held for 3 min; and 20°C/min to 280°C. The programmable temperature vaporizing (PTV) injector temperature was set at 230°C in splitless mode. The mass spectrometer (MS) was operated in electron ionization mode (EI) with an ionization potential of 70 eV, and the spectra were obtained in full scan mode with a range from m/z 35 to 450 atomic mass units (amu). The identification of the main degradation byproducts was confirmed by comparing retention times (tR) and mass spectra of available standard samples and the interpretation of mass spectra of unknown compounds through NIST 2.0 (2007) for mass spectral library searches. The pH was measured with a HANNA pH 301 m with a combined glass electrode (HANNA Hi 1131B) calibrated with standard buffer solutions (pH 4, 7, and 10).
The degradation yield of MP was calculated as follows:
 | (2) |
In order to evaluate the effect of EA concentration on MP degradation, the pseudo-first order model was used.
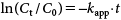 | (3) |
 | (4) |
 | (5) |
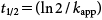
The hydrolysis rate constants of MP (kapp and k2) and the half-life (t1/2) were measured at EA concentrations of 60, 100, and 200 mg/L. Plots of ln(Ct/C0) versus degradation time (t) were prepared as shown in Fig. 4 in accordance with data obtained at a fixed temperature and pH (95°C, pH 9), producing straight lines passing through the origin, confirming that the reaction is pseudo-first order with respect to MP concentration. The whole reaction is considered to be a second order reaction, depending on the concentrations of MP and EA. Constant kapp was determined from the slope of these lines and is reported together with the second order constant k2 in Table 1. The results indicate that the pesticide MP is sensitive to the EA concentration in aqueous solutions. It was revealed that the percentage of degradation of MP increased with the EA concentration.
| Temperature (°C) | [EA] (mg/L) | kapp (min−1) | k2 (L/mol·min) | t1/2 (min) | R2 |
|---|---|---|---|---|---|
| 95 | 60 | 8.2×10⁻³ | 8.35 | 84.52 | 0.9639 |
| 100 | 1.64×10⁻² | 10.01 | 42.26 | 0.9949 | |
| 200 | 3.14×10⁻² | 9.60 | 22.07 | 0.9937 |
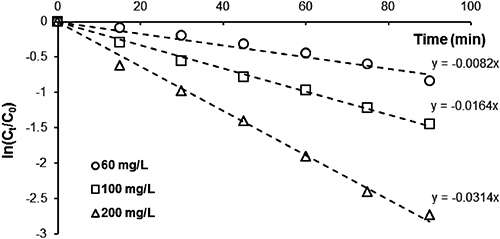
Degradations of 93.5, 76.56, and 49.80% were recorded for concentrations of 200, 100, and 60 mg/L, respectively. Figure 5 plots kapp for MP versus EA concentration.
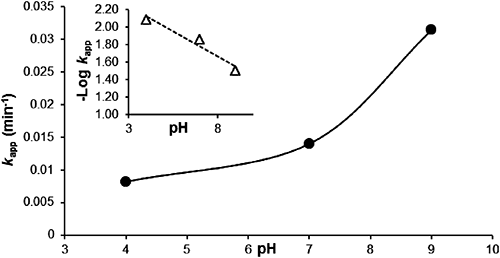
The chemical hydrolysis of MP at 95°C was conducted using buffered solutions at pH values of 4, 7, and 9. Plots of ln(Ct/C0) versus degradation time (t), as reported in Fig. 6, were linear over a pH range of 4–9, indicating that the reaction also tends to be pseudo-first order. The rate constants (kapp and k2) and half-life (Table 2) indicate the relative stability of organophosphate insecticides in an acidic medium. The stability of these compounds decreased as the pH increased. The plot of the pseudo-first order constant (kapp) versus pH (Fig. 7) clearly indicates that MP hydrolyzed much more in basic medium (pH 9) than in neutral or acidic medium (pH 7 and 4), with a rate constant that increases exponentially between pH values of 4 and 9, while the half-life decreases (Table 2). This is due to the presence of hydroxide ions that promote hydrolysis of the MP in the presence of EA, compared to the other environments investigated. Degradations of 93.5, 69.9 and 49.8% were recorded for pH values of 9, 7, and 4, respectively.
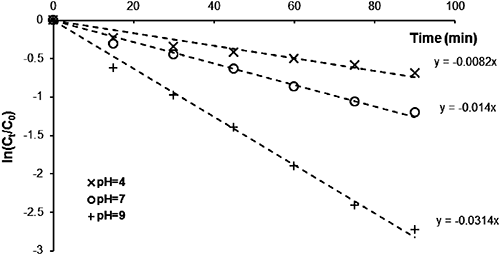
| Temperature (°C) | pH | kapp (min−1) | k2 (L/mol·min) | t1/2 (min) | R2 |
|---|---|---|---|---|---|
| 95 | 4 | 8.2×10⁻³ | 2.50 | 84.52 | 0.9200 |
| 7 | 1.4×10⁻² | 4.28 | 49.51 | 0.9859 | |
| 9 | 3.14×10⁻² | 9.60 | 22.07 | 0.9937 |
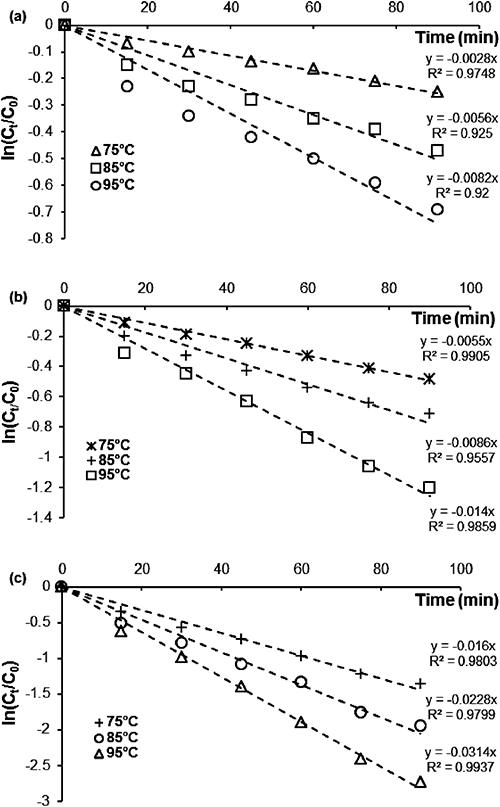
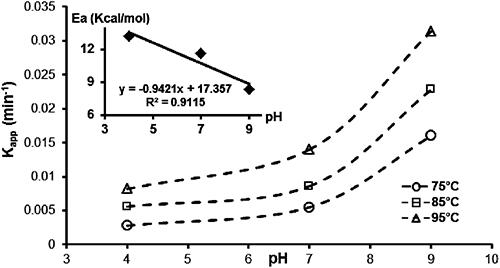
A series of kinetics experiments at different temperatures 75, 85, and 95°C in a pH range between 4 and 9 were carried out in order to study the dependence of the MP hydrolysis rate on temperature (Fig. 8). The second order rate constants were calculated at the three temperatures at three different pH values (Table 3).
| pH | Temperature (°C) | [EA] (mg/L) | kapp (min−1) | k2 (L/min·mol) | Q10 | Ea (kcal/mol) |
|---|---|---|---|---|---|---|
| 4 | 75 | 200 | 2.8×10⁻³ | 0.86 | — | 13.25 |
| 85 | 5.6×10⁻³ | 1.71 | 1.99 | |||
| 95 | 8.2×10⁻³ | 2.50 | 1.46 | |||
| 7 | 75 | 5.5×10⁻³ | 1.68 | — | 11.61 | |
| 85 | 8.6×10⁻³ | 2.63 | 1.56 | |||
| 95 | 1.4×10⁻² | 4.28 | 1.63 | |||
| 9 | 75 | 1.6×10⁻² | 4.89 | — | 8.37 | |
| 85 | 2.28×10⁻² | 6.97 | 1.42 | |||
| 95 | 3.14×10⁻² | 9.60 | 1.38 |
The results show that when the temperature increases, the reaction velocity increases. The increase in the second order rate constant for each 10°C rise of temperature, known as the temperature coefficient (Q10), was calculated as follows:
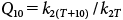 | (6) |
The values obtained for Q10 (Table 3) indicate that the rate of hydrolysis increases (on average) 1.5 times for each 10°C rise in temperature.
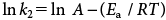
The apparent rate constant of MP degradation versus pH at the three temperatures studied (Fig. 9) showed that, for all values of temperature and pH, MP hydrolysis followed pseudo-first order kinetics. The most satisfactory way to express the influence of temperature on reaction velocity is by using the Arrhenius equation:
 | (7) |
 | (8) |
The hydrolysis of MP yielded a number of organic intermediates. From the results of GC/MS mode EI analysis, the retention times of three major byproducts were observed at 30.74 (3), 22.60 (2), and 5.84 (1) min (Table 4). The identification of these products showed that they were parent MP, p-nitrophenol, and O,O-dimethyl phosphorothioate, respectively.
| Compound | Structure | tR (min) | MS (m/z) ions |
|---|---|---|---|
| 1 |  | 5.84 | 142 (M+), 125, 109, 106, 91, 88, 79, 60, 47 and 39. |
| 2 | 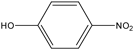 | 22.60 | 139 (M+), 123, 109, 93, 81, 65, 63, 53 and 39. |
| 3 | 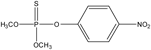 | 30.74 | 263 (M+), 125, 109, 93, 79, 63 and 47. |
MS m/z (%) of 263 (100%), 125 (65%), 109 (67%), 93 (12%), 79 (22%), and 63 (11%) are characteristic fragment ions of MP. The fragment ion at m/z 125 is formed by the loss of p-nitrophenol from the molecular ion of m/z 263. The ion at m/z 109 is formed by the loss of NO from the nitrobenzene group. Further fragmentation with the loss of an oxygen atom gave [C6H5O]+ at m/z 93. In the thiophosphoric moiety, the loss of a methyl and a methoxyl group produced the ion at m/z 79, followed by the loss of another oxygen atom to give the m/z 63 ion. p-Nitrophenol and O,O-dimethyl phosphorothioate were identified as hydrolysis intermediates of MP. MS m/z of 139 (100%), 109 (45%), 93 (12%), 81 (15%), and 65 (52%) are characteristic fragment ions of p-nitrophenol, and MS m/z of 142 (35%), 125 (22%), 109 (50%), 106 (90%), 91 (98%), 88 (100%), and 60 (75%) are characteristic fragment ions of O,O-dimethyl phosphorothioate (Table 4).
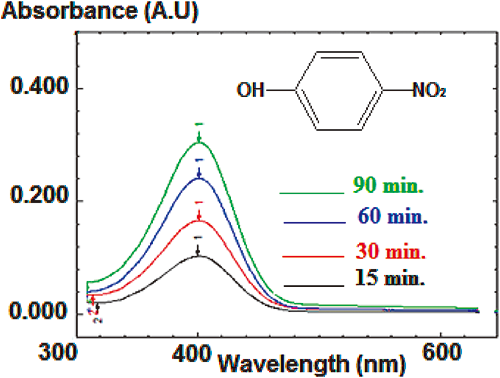
In addition, UV-Vis analysis of byproduct degradation in water revealed the presence of an absorbance band UV λmax (H2O, pH 9) of 400 nm. This UV-Vis band is characteristic of p-nitrophenol.25) Its intensity increased with time, indicating that the p-nitrophenol concentration increased during the hydrolysis reaction ([MP]=30 mg/L, [EA]=200 mg/L, T=95°C, as mentioned in Fig. 11).
These two compounds are formed due to the nucleophilic attack at the phosphorus atom, which results in cleavage of the P-O aryl bond. This hydrolysis reaction is favored by increasing the nucleophilicity of the system upon the addition of EA. The P-O attack generates the formation of p-nitrophenol and O,O-dimethyl phosphorothioate. This mechanism is supported by a degradation reaction, which increases with the ratio of EA to MP.
We report the effects of pH, temperature, and 2-aminoethanol concentration on the rate of hydrolysis of MP pesticides. It was concluded that hydrolysis in the presence of EA follows pseudo-first order kinetics. The rate constant and half-lives indicated the relative stability of MP in neutral and acidic liquid media. However, increasing the pH decreased its stability. Alkaline conditions favored the hydrolysis of the MP, and increasing the nucleophilicity of the aqueous medium is the main route of MP degradation. It can be concluded that pH is one of the most important variables in the removal of MP by hydrolysis. Conversion reached 93.5% after a 90 min reaction time at a pH of 9, temperature of 95°C, and with 200 mg/L of EA.
The rate constant was enhanced by increasing the temperature and rose by a factor of approximately 1.5 for every 10-degree rise in temperature. The rate constants at various temperatures (75, 85, and 95°C) were used to calculate the activation energy, Ea.
Based on the results of GC/MS mode EI analysis, the main byproducts of MP degradation were p-nitrophenol and O,O-dimethyl phosphorothioate, formed via nucleophilic attack. The absence from the degradation byproducts of dimethyl p-nitrophenyl phosphate, considered to be more toxic than MP, clearly demonstrates the benefits of the incorporation of EA in the hydrolysis reaction with an additional advantage being the production of p-nitrophenol, which can be used in pharmaceutical chemistry for the synthesis of paracetamol.
The authors thank “The National Institute of Forensic Science and Criminology (INCC/GN),” Algiers, Algeria, for providing the GC/MS mode EI system for our laboratory.