Original Articles
Differential uptake and translocation of organic chemicals by several plant species from soil
2018 Volume 43 Issue 2 Pages 96-107

Details
2018 Volume 43 Issue 2 Pages 96-107
We performed uptake experiments with 12 different organic chemicals using 16 plant species and determined differences in the ability of plant species to take up and translocate these chemicals. There were differences among the plant species in the shoot and root concentrations of each organic chemical. The root concentration factor values increased with an increasing log of the n-octanol–water partition coefficient (log KOW) of organic chemicals. Thus, the concentrations in roots may be predicted to a certain extent because the root concentration factor values were related to the log KOW. The root-to-shoot translocation was related to the log KOW because the shoot-to-root concentration ratio decreased with an increasing log KOW; however, there was no clear relationship between the shoot concentration factor value and the log KOW, and this differed among plant species.
Agricultural land can be burdened with various anthropogenic organic chemicals, including pesticides applied intentionally for production and pollutants mixed unintentionally. These organic chemicals can cause various problems, such as crop contamination from pesticides exceeding the maximum residue limits (MRLs).1) Recently, in Japan, agricultural chemicals used on preceding crops and persisting in the soil were detected in succeeding crops at levels exceeding the MRLs.1) In these situations, production areas may be forced to take emergency measures, such as the self-imposed stoppage of shipments or the extensive inspection of soils and crops. At present, countermeasures for these problems are carried out on a case-by-case basis, and a strong need exists for measures that use science-based risk evaluation of crop contamination. As a preemptive strategy, it is important to predict the uptake of organic compounds by plants based on physicochemical properties and plant physiology.
In general, plant uptake of organic chemicals is influenced by their chemical properties, especially those that determine the n-octanol–water partition coefficient (KOW) or, more often, log KOW. In a hydroponic experiment with Hordeum vulgare,2,3) as hydrophobicity increased (i.e., log KOW increased), organic chemicals were concentrated in the roots. On the other hand, the relationship between translocation to shoots and log KOW produced a bell-shaped curve.2–6) It was also reported that the relationship between translocation to shoots and log KOW followed a negative sigmoid curve.7) Based on the relationship between log KOW and accumulation in roots or translocation to aboveground tissues via xylem, a number of plant uptake models for xenobiotic organic chemicals have been developed.8–14) However, in these studies, differences among plant species in the uptake and translocation of organic chemicals were not considered.
Numerous screening data are available concerning the concentrations in soils and residues in crops or vegetables of pesticides applied to soils. However, these screenings have focused on pesticide residues in edible parts, and so the parts in which concentrations were measured have differed-in some cases fruit and in others leaves and stems. Moreover, in these screenings, the cultivation periods differed with the crop or vegetable growth speed, and so the periods of pesticide uptake from soil by plants were also different. In this study, we intended to observe differences in the organic chemical concentrations in shoots and roots under the same growing conditions-that is, the chemical concentration in the soil, the plant uptake period, and plant size (especially root size). By choosing different pre-growing periods and plant densities, the tested plants were grown for the same period (21 days) in soil treated with the tested organic chemicals, and the concentrations in shoots and roots were compared. Using the results, we discussed the different abilities among plant species to take up organic chemicals from the soil into their roots and to translocate the chemicals from their roots to their shoots. In addition, we considered the chemical properties affecting the concentrations of organic chemicals in shoots and roots among the plant species.
For plant uptake experiments, we used 12 organic chemicals with a wide range of log KOW levels: −0.6 to 5. The tested chemicals were 10 pesticides and β-HCH and dieldrin, which are persistent organic pollutants (Table 1). These organic chemicals were chosen because they are relatively hard to degrade in soil and they are not herbicides affecting plant growth. The organic chemicals were dissolved and mixed in acetone to 50 mg/L. One liter of the mixture was added to 278 g of Celite® powder (No. 545; Wako Pure Chemical, Osaka, Japan), and the acetone evaporated for 4 hr at room temperature in a draft chamber. Because chemicals were volatilized while evaporating the acetone, their final contents in 1 g of Celite® were 124.9 µg of dinotefuran, 122.7 µg of clothianidin, 128.2 µg of imidacloprid, 129.7 µg of thiacloprid, 122.7 µg of metalaxyl, 133.6 µg of fosthiazate, 82.7 µg of fenobucarb, 81.0 µg of procymidone, 104.0 µg of flutolanil, 102.9 µg of tolclofos-methyl, 100.6 µg of β-HCH, and 92.6 µg of dieldrin. These organic chemicals were added to an uncontaminated Andosol (soil texture, loam; pH [H2O], 5.5; cation exchange capacity, 33.8 cmol/kg; organic carbon, 52.1 g/kg; and water-holding capacity [WHC], 747.1 mL/kg soil).
| Chemicals | Pesticide type | Substance group | Octanol-water partition coefficient (log KOW) | |||
|---|---|---|---|---|---|---|
| Dinotefuran | Insecticide | Neonicotinoid | −0.549a) | −0.549c) | −0.549d) | |
| Imidacloprid | Insecticide | Neonicotinoid | 0.57a) | 0.57c) | 0.57d) | |
| Veterinary substance | ||||||
| Clothianidin | Insecticide | Neonicotinoid | 0.7a) | 0.7c) | 0.905d) | |
| Thiacloprid | Insecticide | Neonicotinoid | 0.74a) | 1.26c) | 1.26d) | |
| Molluscicide | ||||||
| Fosthiazate | Insecticide | Organophosphate | 1.68a) | 1.68c) | 1.68d) | |
| Nematicide | ||||||
| Metalaxyl | Fungicide | Phenylamide | 1.75a) | 1.75b) | 1.75c) | 1.65d) |
| Fenobucarb | Insecticide | Carbamate | 2.67a) | 2.67c) | 2.78d) | |
| Procymidone | Fungicide | Dicarboximide | 3.14a) | 3.14b) | 3.30c) | 3.3d) |
| Flutolanil | Fungicide | Phenylbenzamide | 3.17a) | 3.77c) | 3.17d) | |
| β-HCH | Organochlorine | 3.8b) | ||||
| Tolclofos-methyl | Fungicide | Chlorophenyl | 4.56a) | 4.56c) | 4.56d) | |
| Dieldrin | Organochlorine | 5.20b) | 3.7d) | |||
a) Values obtained from The Pesticide Manual (16th ed.).15) b) Values obtained from Illustrated Handbook of Physical-Chemical Properties and Environmental Fate for Organic Chemicals Vol. V Pesticide Chemicals (selected properties at 25°C).16) c) Values obtained from The 2011 Pesticide Handbook.17) d) Values obtained from the Footprint Pesticide Database of IUPAC.18)
Plastic pots (600 mL) were filled with prepared soil (450 g of uncontaminated soil mixed with 5 g of Celite® prepared as above). The soil in each pot was fertilized with 5 g of chemical fertilizer (0.4 g nitrogen, 0.17 g phosphorus, and 0.34 g potassium) and 5 g of dolomite. We raised plants of 16 species (Table 2). Seeds were sown in nursery soil and germinated in a growth chamber (Koito Kogyo, Tokyo, Japan) at 20°C under a 14 : 10 hr light:dark cycle. At 7–28 days, the seedlings were transplanted into pots and raised in the same conditions for 21 days. Growth periods and plant densities were chosen to obtain approximately equal amounts of biomass so that the root dry weights were 1–2 g per species (Table 2). The soil moisture was maintained at 50–70% water holding capacity (WHC). Twenty-one days after transplanting, shoots and roots were harvested. The roots were washed in running tap water and sonicated in distilled water for 5 min to remove soil particles. For each sample, the fresh weight of shoots and roots was measured, and then cut finely, mixed, and divided into two subsamples. One subsample was dried at 70°C to measure the moisture content, and the other was used to measure organic chemical contents. These uptake experiments were conducted in quadruplicate.
| Plant name | Family name | Cultivar name | Growing days | Plant density per pot | |
|---|---|---|---|---|---|
| in nursery soil | in test soil | ||||
| Hordeum distichon L. | Poaceae | Hayadori-2 | 7 | 21 | 10 |
| Zea mays L. | Poaceae | Gold dent | 7 | 21 | 2 |
| Glycine max Merrill | Fabaceae | Fukuyutaka | 14 | 21 | 3 |
| Phaseolus vulgaris L. | Fabaceae | 10 | 21 | 3 | |
| Brassica oleracea L. var. capitata | Brassicaceae | Irodori | 14 | 21 | 3 |
| Brassica rapa L. var. peruviridis | Brassicaceae | Yokattana | 21 | 21 | 3 |
| Chrysanthemum coronarium L. | Asteraceae | Satoyutaka | 21 | 21 | 3 |
| Lactuca sativa L. | Asteraceae | Sun valley | 21 | 21 | 2 |
| Allium wakegi Araki | Amaryllidaceae | Jakkoh gold | 28 | 21 | 20 |
| Apium graveolens L. var. dulce | Apiaceae | Top seller | 28 | 21 | 10 |
| Solanum lycopersicum Mill. | Solanaceae | Magnet | 21 | 21 | 3 |
| Capsicum grossum L. | Solanaceae | 21 | 21 | 3 | |
| Cucumis sativus L. | Cucurbitaceae | Sharp-1 | 14 | 21 | 2 |
| Cucurbita maxima Duch. | Cucurbitaceae | Ebisu | 10 | 21 | 2 |
| Spinacia oleracea L. | Amaranthaceae | Summers | 28 | 21 | 5 |
| Beta vulgaris L. var. cicla | Amaranthaceae | 14 | 21 | 5 | |
To analyze organic chemicals in a soil solution, we mixed 667 mg of prepared Celite® into 60 g of uncontaminated soil in a 100 mL stainless steel vessel, adjusted the water content to 60% WHC with Milli-Q water, added the lid, and placed the vessel in darkness at 20°C. After 1, 3, 7, 14, and 22 days, the soil solution was collected by centrifuging at 15,800×g for 60 min. The experiment was conducted in quadruplicate.
To purify of dinotefuran, clothianidin, imidacloprid, thiacloprid, fosthiazate, and metalaxyl, a 10 mL aliquot of the soil solution was cleaned using the method applied for group A from Motoki et al. (2015).19) The dinotefuran, clothianidin, imidacloprid, thiacloprid, fosthiazate, and metalaxyl in the purified samples were measured by liquid chromatography-tandem mass spectrometry (LC-MS/MS; ACQUITY UPLC-Quattro Micro API; Waters Corporation, Milford, MA, USA) equipped with an ACQUITY UPLC HSS T3 (30 mm×φ2.1, 1.8 µm particle size; Waters).
To purify of fenobucarb procymidone, flutolanil, and tolclofos-methyl, a 10 mL aliquot of soil solution was cleaned using the method applied for group B from Motoki et al. (2015).19) The fenobucarb procymidone, flutolanil, and tolclofos-methyl in the purified samples were measured by a gas chromatograph-mass spectrometer (GC-MS; HP6890–5973N; Agilent Technologies, Santa Clara, CA, USA) equipped with an ENV-8MS capillary column (φ0.25 nm×30 m×0.25 µm film thickness; Kanto Chemical, Tokyo, Japan).
To purify of β-HCH and dieldrin in the soil solution, a 5 mL aliquot was spiked with 100 ng each of D6-γ-HCH and 13C12-dieldrin (Cambridge Isotope Laboratories, Andover, MA, USA) as an internal standard. The soil solution was extracted with 2 mL of n-hexane twice with shaking for 1 min. The extract was passed through Na2SO4 for dehydration, syringe-spiked with 100 ng each of 13C12-2,4,4′-trichlorobiphenyl and 13C12-2,2′,4,4′,6,6′-hexachlorobiphenyl (Wellington Laboratories, Guelph, Ontario, Canada), and then concentrated to 100 µL under a gentle stream of nitrogen gas. The β-HCH and dieldrin in the purified extracts were measured by GC-high resolution MS (AutoSpec Ultima; now Waters/Micromass, Milford, MA, USA) equipped with an ENV-8MS capillary column.
To analyze organic chemicals in the soil, we mixed 89 mg of prepared Celite® into 8 g dry weight of the uncontaminated soil, placed the soil in a 50 mL centrifuge tube, adjusted the water content to 60% WHC with Milli-Q water, covered the tube top with cling film, and placed the tube in darkness at 20°C. After 1, 3, 7, 14, and 22 days, the test soil was extracted with 30 mL of acetone by shaking for 20 min at 20°C. The solution was centrifuged at 2000×g for 10 min, and the supernatant was collected. This extraction was performed twice, and the combined acetone extract was adjusted to 100 mL. The experiment was conducted in quadruplicate.
To purify of dinotefuran, clothianidin, imidacloprid, thiacloprid, fosthiazate, and metalaxyl, a 10 mL aliquot of soil acetone extract was added to 10 mL of water. The extract was concentrated in a rotary evaporator. To the concentrated extract, 1 g of NaCl was added and then purified as for the soil solution. The dinotefuran, clothianidin, imidacloprid, thiacloprid, fosthiazate, and metalaxyl in the purified extract were measured as for the soil solution.
To purify of fenobucarb procymidone, flutolanil, and tolclofos-methyl, a 10 mL aliquot of soil acetone extract was added to 10 mL of water. The extract was concentrated in a rotary evaporator. The concentrated extract was purified as for the soil solution. The fenobucarb procymidone, flutolanil, and tolclofos-methyl in the purified extract were measured as for the soil solution.
To purify of β-HCH and dieldrin, a 10 mL aliquot was spiked with the same internal standard as above. Each extract was washed through an InterSep K-solute® column with 100 mL of n-hexane, and the eluate was concentrated in a rotary evaporator. The concentrated extract was purified through a graphite column and an ENVI-Carb-II/PSA column. The sample was syringe-spiked and then concentrated to 100 µL under a gentle stream of nitrogen gas. The β-HCH and dieldrin in the purified samples were measured by a GC-MS instrument equipped with an ENV-8MS capillary column.
4. Analysis of organic chemical concentrations in plantsTo extract pesticide, each 10 g of the shoot and root sample was homogenized in 100 mL of acetone. The extract was passed through a filter and adjusted to 200 mL.
To test for dinotefuran, imidacloprid, clothianidin, and thiacloprid, a 4 mL aliquot of the extract was concentrated. Then 3 mL of water and 1 g of NaCl were added to the concentrated extract, and it was adsorbed with a for 10 min and washed through a InterSep K-solute® column with 40 mL of n-hexane. An InterSep GC-e® column (GL Sciences, Tokyo, Japan) was connected below the diatomite column and then eluted with 80 mL of ethyl acetate. The eluate was concentrated and dried. The dried residue was dissolved in 2 mL of water : methanol (50 : 50) and then passed through a 0.2 µm filter. The dinotefuran, imidacloprid, clothianidin, and thiacloprid in the purified samples were measured by LC-MS/MS (AQUITY UPLC-Xevo TQ MS; Waters) equipped with an AQUITY UPLC BET C18 column (φ2.1 mm×100 mm, 1.7 µm particle size; Waters).
To test for fosthiazate, metalaxyl, fenobucarb, procymidone, flutolanil, and tolclofos-methyl, a 20 mL aliquot of the extract with 200 mL of 5% NaCl aq was extracted with 100 mL of dichloromethane with shaking. We collected the dichloromethane, and then extracted 50 mL of dichloromethane with shaking. The collected dichloromethane was concentrated and dried. The dried residue was dissolved in 5 mL of ethyl acetate and then adsorbed with a graphite column and an InterSep GC/NH2® column (GL Sciences) and then eluted with 15 mL of ethyl acetate. The eluate was concentrated and dried. The dried residue was dissolved in acetone and adjusted to 10 mL.
To test for fosthiazate, metalaxyl, fenobucarb, and flutolanil, a 2 mL aliquot of the extract was concentrated and dried. The dried residue was dissolved in 2 mL of acetonitrile and then passed through a 0.2 µm filter. The purified samples were measured by an LC-MS/MS instrument equipped with an AQUITY UPLC BET C18 column.
To test for procymidone, a 2 mL aliquot of the extract was concentrated and dried. The dried residue was dissolved in 2 mL of n-hexane adsorbed with a Sep-Pak Florisil® Plus column (Waters) washed with 10 mL of diethyl ether : n-hexane (4 : 96) and then eluted with 20 mL of acetone : n-hexane (5 : 95). The eluate was concentrated and crystallized. The residue was dissolved in 1 mL of n-hexane. The purified samples were measured by a GC-electron capture detector (GC-ECD 6890; Agilent Technologies) equipped with a DB-1701 column (φ0.25 mm×30 m, 0.25 µm film thickness; Agilent Technologies).
To test for tolclofos-methyl, a 5 mL aliquot of the extract was concentrated and dried. The dried residue was dissolved in acetone and adjusted to 1 mL. The samples were measured by a GC-flame photometric detector (GC-FPD 6890; Agilent Technologies) equipped with a VF-200MS column (φ0.25 mm×30 m, 0.25 µm film thickness; Agilent Technologies).
To extract β-HCH and dieldrin, the shoot and root samples were homogenized with 150 mL of acetone for 3 min. The extract was passed through a 0.8 µm glass fiber filter and concentrated to 50 mL in a rotary evaporator. A 5 mL aliquot of plant extracts was purified as for the soil acetone extract. The β-HCH and dieldrin in the purified extract were measured as for the soil extracts.
5. Statistical analysesStatistical analyses were performed using SPSS 23 software (SPSS Inc., Chicago, IL, USA). Analysis of variance (ANOVA) was followed by Tukey’s multiple comparison test using a pairwise comparison matrix to determine which samples differed significantly.
We defined the acetone-extractable organic chemicals as the total organic chemicals in the soil, and the organic chemicals in the soil solution as phytoavailable organic chemicals (Table 3). The half-lives (τ1/2) of the total and phytoavailable organic chemicals were calculated from the changes in concentrations as:
 | (1) |
 | (2) |
| Chemicals | Concentration (µg/kg, µg/L)a) | Ct=C0e/kt | τ1/2 (days) | Mean Conc. (µg/kg, µg/L) | ||||||
|---|---|---|---|---|---|---|---|---|---|---|
| 1 d | 3 d | 7 d | 14 d | 22 d | C0 | k | r2 | |||
| Total organic chemicals in soil | ||||||||||
| Dinotefuran | 1263.0 | 1399.8 | 1372.0 | 1291.4 | 1295.9 | 1341.5 | 0.001 | 0.08 | >22 | 1319.4 |
| Imidacloprid | 1300.7 | 1475.5 | 1355.1 | 1234.1 | 1313.5 | 1377.3 | 0.003 | 0.20 | >22 | 1323.8 |
| Clothianidin | 1317.9 | 1392.6 | 1262.8 | 1156.1 | 1163.5 | 1355.3 | 0.008 | 0.77 | >22 | 1234.0 |
| Thiacloprid | 1289.7 | 1557.8 | 1363.9 | 1294.8 | 1364.6 | 1397.7 | 0.002 | 0.05 | >22 | 1364.9 |
| Fosthiazate | 1422.6 | 1479.5 | 1144.5 | 1009.3 | 1039.7 | 1421.6 | 0.018 | 0.74 | >22 | 1159.9 |
| Metalaxyl | 1272.0 | 1294.5 | 1071.6 | 1006.9 | 1061.3 | 1250.5 | 0.010 | 0.60 | >22 | 1111.0 |
| Fenobucarb | 827.0 | 879.3 | 665.1 | 693.9 | 728.3 | 810.8 | 0.008 | 0.31 | >22 | 742.4 |
| Procymidone | 1033.9 | 1158.7 | 844.0 | 959.0 | 962.6 | 1033.8 | 0.005 | 0.14 | >22 | 976.0 |
| Flutolanil | 1396.5 | 1590.6 | 1155.6 | 1383.0 | 1326.6 | 1410.2 | 0.004 | 0.07 | >22 | 1353.0 |
| β-HCH | 864.5 | 1080.6 | 947.0 | 915.5 | 925.9 | 959.7 | 0.002 | 0.03 | >22 | 940.6 |
| Tolclofos-methyl | 1149.7 | 1289.7 | 869.9 | 935.3 | 942.7 | 1146.8 | 0.012 | 0.38 | >22 | 1000.9 |
| Dieldrin | 1205.2 | 1278.8 | 1310.8 | 1122.8 | 1254.7 | 1248.4 | 0.001 | 0.04 | >22 | 1229.2 |
| Phytoavailable organic chemicals in soil | ||||||||||
| Dinotefuran | 511.6 | 427.8 | 396.0 | 271.4 | 255.3 | 491.9 | 0.033 | 0.92 | 20.8 | 335.2 |
| Imidacloprid | 40.2 | 28.6 | 20.2 | 11.9 | 11.3 | 34.9 | 0.060 | 0.88 | 11.6 | 17.5 |
| Clothianidin | 64.0 | 44.5 | 35.4 | 20.6 | 19.0 | 56.2 | 0.057 | 0.89 | 12.3 | 29.3 |
| Thiacloprid | 20.0 | 12.9 | 8.5 | 4.9 | 4.6 | 16.5 | 0.068 | 0.86 | 10.2 | 7.5 |
| Fosthiazate | 857.1 | 533.4 | 390.3 | 215.3 | 171.8 | 727.4 | 0.073 | 0.92 | 9.5 | 314.3 |
| Metalaxyl | 946.7 | 565.5 | 406.2 | 250.2 | 212.9 | 761.9 | 0.066 | 0.87 | 10.5 | 357.0 |
| Fenobucarb | 426.5 | 268.4 | 300.6 | 118.2 | 96.0 | 402.9 | 0.070 | 0.90 | 9.9 | 179.6 |
| Procymidone | 45.2 | 24.6 | 23.6 | 9.3 | 8.2 | 38.1 | 0.079 | 0.88 | 8.8 | 15.4 |
| Flutolanil | 101.4 | 44.4 | 40.5 | 14.5 | 12.2 | 77.3 | 0.095 | 0.87 | 7.3 | 26.0 |
| β-HCH | 33.7 | 21.9 | 16.3 | 11.4 | 10.5 | 27.6 | 0.051 | 0.84 | 13.6 | 15.3 |
| Tolclofos-methyl | 5.4 | 2.4 | 1.8 | 0.6 | 0.5 | 4.1 | 0.109 | 0.90 | 6.3 | 1.2 |
| Dieldrin | 1.6 | 1.2 | 0.7 | 0.8 | 0.6 | 1.3 | 0.037 | 0.71 | 18.9 | 0.9 |
a) The concentration of total organic chemicals were expressed in µg/kg per dry soil, and those of phytoavailable organic chemicals were expressed in µg/L.
The concentrations of total organic chemicals were approximately constant during the experiment, although the concentrations decreased by 30% for fosthiazate and by 20% for metalaxyl. The mean concentrations of total organic chemicals calculated from the regression formula were in the range of 1000–1300 µg/kg, except for fenobucarb, procymidone, and β-HCH which had concentrations of 742, 976, and 941 µg/kg, respectively.
The initial concentrations of organic chemicals in the soil solution were quite different: 900 µg/L for fosthiazate and metalaxyl; 500 µg/L for dinotefuran and fenobucarb; 20–100 µg/L for imidacloprid, clothianidin, thiacloprid, procymidone, flutolanil, and β-HCH; and 2–5 µg/L for tolclofos-methyl and dieldrin. The concentrations in the soil solution had greater differences among tested organic chemicals than did the total concentrations in soil; concentrations decreased during the experiment with half-lives of around 6–20 days. The mean concentrations of chemicals in the soil solution calculated using the regression formula were 180–360 µg/L for dinotefuran, fosthiazate, metalaxyl, and fenobucarb; 7.5–30 µg/L for imidacloprid, clothianidin, thiacloprid, procymidone, flutolanil, and β-HCH; and 1 µg/L for tolclofos-methyl and dieldrin.
2. Organic chemical concentrations in shoots and roots of 16 plantsShoot and root dry weights and transpiration rates are shown in Table 4. Shoot dry weights varied 1.2–5 times among plant species; those of Allium wakegi, Apium graveolens, and Capsicum grossum were low. The root dry weights of all species were approximately the same, except that A. wakegi, A. graveolens, and Lactuca sativa were low, and those of Zea mays and Solanum lycopersicum were high. Transpiration rates were low for A. wakegi, A. graveolens, and C. grossum and high for Brassica oleracea, Brassica rapa, and Chrysanthemum coronarium.
| Plant | Dry weight (dw-g per pot) | Transpiration rate (L/21days per pot) | |
|---|---|---|---|
| Shoot | Root | ||
| H. distichon | 7.59 ij | 1.91 e | 1.42 efg |
| Z. mays | 7.12 hi | 3.90 f | 0.83 b |
| G. max | 6.29 gh | 1.65 de | 1.25 de |
| P. vulgaris | 4.24 de | 1.22 bcd | 0.74 b |
| B. oleracea | 9.55 k | 1.40 cd | 1.70 h |
| B. rapa | 7.73 ij | 1.58 cde | 1.55 gh |
| C. coronarium | 5.51 fg | 1.63 de | 1.68 h |
| L. sativa | 5.01 ef | 0.81 ab | 0.71 b |
| A. wakegi | 2.67 ab | 0.64 a | 0.36 a |
| A. graveolens | 1.71 a | 0.73 ab | 0.40 a |
| S. lycopersicum | 8.60 jk | 2.03 e | 1.49 fg |
| C. grossum | 2.90 abc | 0.75 ab | 0.52 a |
| C. sativus | 7.57 ij | 1.21 bcd | 1.37 ef |
| C. maxima | 8.23 ij | 1.16 bcd | 1.11 cd |
| S. oleracea | 3.40 bcd | 1.20 bcd | 1.03 c |
| B. vulgaris | 4.10 cde | 1.11 abc | 1.06 c |
Data were compared using one-way ANOVA followed by Tukey’s multiple comparison test (p<0.05). Within a column, means followed by the same letter are not significantly different.
The shoot and root concentrations of test chemicals are shown in Table 5. The shoot concentrations of dinotefuran, imidacloprid, clothianidin, and thiacloprid in B. oleracea, B. rapa, and C. coronarium were approximately 2–5 times higher than those in the other plant species. The concentrations of these chemicals in Spinacia oleracea were also high; however, the concentration of thiacloprid was below the detection limit. The concentrations of fosthiazate, metalaxyl, fenobucarb, and flutolanil in C. coronarium were about 10 times those in other plant species. The concentrations of dieldrin were clearly higher in cucurbits such as Cucumis sativus and Cucurbita maxima, at 10–50 times higher than in other species. There were no marked differences in the shoot concentrations of procymidone and β-HCH between plant species. However, as compared with the root concentrations of each species-although there were differences of several magnitudes in the concentrations of dinotefuran, imidacloprid, clothianidin, thiacloprid, fosthiazate, and metalaxyl in shoots-differences between the plant species were smaller for shoot concentrations. The concentrations of fenobucarb, procymidone, flutolanil, β-HCH, tolclofos-methyl, and dieldrin in C. coronarium were 5–50 times higher than in other plant species.
| Plants | Concentratin (mg/kg) | |||||||||||
|---|---|---|---|---|---|---|---|---|---|---|---|---|
| Dinotefuran | Imidacloprid | Clothianidin | Thiacloprid | Fosthiazate | Metalaxyl | Fenobucarb | Procymidone | Flutolanil | β-HCH | Tolclofos-methyl | Dieldrin | |
| Shoot | ||||||||||||
| H. distichon | 5.03 def | 0.32 cde | 0.86 ef | 0.11 abc | 0.47 ab | 1.04 abc | 0.24 a | 2.11 f | 0.15 a | 1.84 de | <0.02a) | 0.32 a |
| Z. mays | 4.06 cde | 0.21 abc | 0.31 abc | 0.13 bcd | 2.90 bc | 2.37 c | 0.95 a | 1.66 ef | 0.57 b | 1.36 bcd | <0.02a) | 0.19 a |
| G. max | 4.76 def | 0.36 de | 0.05 a | 0.20 de | 1.55 abc | 2.41 c | 0.58 a | 1.85 ef | <0.02a) | 1.36 bcd | <0.02a) | 0.32 a |
| P. vulgaris | 0.66 a | <0.02a) | <0.02a) | <0.02a) | 0.62 ab | 0.13 a | 0.14 a | 0.26 a | <0.02a) | 1.05 abc | <0.02a) | 0.12 a |
| B. oleracea | 9.52 g | 0.54 fg | 0.81 def | 0.47 g | 3.15 c | 2.47 c | 0.24 a | 2.09 f | 0.05 a | 1.77 de | <0.02a) | 0.15 a |
| B. rapa | 6.22 f | 0.38 de | 0.88 f | 0.27 e | 1.47 abc | 0.87 ab | 0.15 a | 2.20 f | <0.02a) | 1.54 cd | <0.02a) | 0.13 a |
| C. coronarium | 8.53 g | 1.10 h | 1.35 g | 0.68 f | 12.70 e | 9.29 d | 4.80 b | 0.98 cd | 0.86 c | 0.85 ab | 0.06 b | 0.13 a |
| L. sativa | 0.67 a | 0.14 a | 0.07 a | 0.05 ab | 0.12 a | 0.26 ab | <0.02a) | 0.35 ab | 0.04 a | 0.52 a | <0.02a) | 0.11 a |
| A. wakegi | 4.23 de | 0.29 bcd | 0.52 cd | 0.02 a | 1.02 abc | 0.10 a | 0.57 a | 2.07 f | 0.41 b | 1.86 de | <0.02a) | 0.61 b |
| A. graveolens | 5.65 ef | 0.27 abcd | 0.55 cd | 0.11 abc | 7.69 d | 1.09 abc | 5.74 b | 0.20 a | <0.02a) | <0.02a) | 0.04 ab | 0.08 a |
| S. lycopersicum | 5.39 ef | 0.60 g | 0.57 cde | 0.15 cd | 0.99 abc | 0.04 a | 0.54 a | 1.82 ef | 0.12 a | 0.94 ab | <0.02a) | 0.27 a |
| C. grossum | 3.44 bcd | 0.44 ef | 0.22 ab | <0.02a) | 0.45 ab | 0.20 a | 0.08 a | 1.26 de | 0.04 a | 0.96 ab | <0.02a) | 0.18 a |
| C. sativus | 2.58 bc | 0.24 abcd | 0.28 abc | 0.09 abc | 0.77 ab | 0.93 ab | 0.37 a | 1.62 ef | <0.02a) | 1.72 de | 0.03 a | 2.18 c |
| C. maxima | 2.40 b | 0.24 abcd | 0.20 a | 0.12 bcd | 2.30 abc | 1.36 abc | 1.24 a | 0.89 bcd | <0.02a) | 0.87 ab | <0.02a) | 5.05 d |
| S. oleracea | 6.11 f | 0.56 fg | 1.54 g | <0.02a) | 0.14 a | 0.10 a | 0.05 a | 0.42 abc | 0.12 a | 2.25 e | <0.02a) | 0.14 a |
| B. vulgaris | 5.04 def | 0.17 ab | 0.49 bc | 0.03 a | 1.56 abc | 1.68 bc | 0.15 a | 0.90 bcd | 0.17 a | 1.01 abc | <0.02a) | 0.07 a |
| Root | ||||||||||||
| H. distichon | 0.16 abc | 0.03 a | 0.03 a | 0.03 a | 0.07 abc | 0.06 a | 0.15 ab | 0.24 ab | 0.21 ab | 1.07 a | 0.04 a | 9.19 ab |
| Z. mays | 0.39 d | 0.07 bc | 0.05 ab | 0.07 abcd | 0.20 bcde | 0.20 cd | 0.28 abc | 0.53 ab | 0.33 ab | 2.26 a | 0.40 a | 7.93 ab |
| G. max | 0.16 abc | 0.20 d | 0.13 c | 0.33 e | 0.17 de | 0.39 f | 0.39 abc | 1.37 abc | 0.21 ab | 3.87 ab | 0.70 a | 17.23 abc |
| P. vulgaris | 0.29 cd | 0.08 bc | 0.06 ab | 0.12 d | 0.12 abcd | 0.17 bc | 0.15 ab | 0.63 abc | 0.05 a | 1.94 a | 0.34 a | 3.63 a |
| B. oleracea | 0.10 ab | 0.06 abc | 0.04 a | 0.08 bcd | 0.06 a | 0.07 a | 0.17 ab | 0.46 ab | 0.26 ab | 5.36 ab | 0.57 a | 13.60 ab |
| B. rapa | 0.11 ab | 0.05 abc | 0.04 a | 0.07 abc | 0.08 abc | 0.11 ab | 0.12 a | 0.39 ab | 0.26 ab | 2.60 a | 0.31 a | 9.17 ab |
| C. coronarium | 0.06 ab | 0.07 bc | 0.05 ab | 0.09 cd | 0.26 ef | 0.07 a | 8.96 e | 14.08 e | 4.19 d | 37.93 d | 34.22 b | 85.00 e |
| L. sativa | 0.12 ab | 0.08 c | 0.03 a | 0.04 ab | 0.07 abc | 0.09 a | 0.04 a | 0.66 abc | 0.39 ab | 5.99 ab | 0.66 a | 46.37 d |
| A. wakegi | 1.24 e | 0.17 d | 0.15 c | 0.09 bcd | 0.32 f | 0.27 de | 1.59 abcd | 1.78 abc | 0.85 bc | 12.14 c | 0.74 a | 18.46 abc |
| A. graveolens | 0.41 d | <0.02a) | <0.02a) | <0.02a) | 0.18 cde | 0.07 a | 2.05 d | 5.01 d | 0.41 ab | 5.45 ab | 3.58 a | 12.26 ab |
| S. lycopersicum | 0.27 cd | 0.07 bc | 0.06 ab | 0.08 bcd | 0.11 abcd | 0.12 ab | 0.10 a | 0.55 abc | 0.39 ab | 4.34 ab | 0.42 a | 13.61 ab |
| C. grossum | 0.27 cd | 0.04 ab | 0.03 a | 0.03 a | 0.06 ab | 0.06 a | 0.16 ab | 0.26 ab | 0.18 ab | 2.78 a | 0.20 a | 9.83 ab |
| C. sativus | 0.05 a | 0.06 abc | 0.03 a | 0.08 abcd | 0.32 f | 0.35 ef | 1.76 bcd | 2.48 c | 1.41 c | 5.68 ab | 2.34 a | 29.49 c |
| C. maxima | 0.20 bc | 0.06 abc | 0.06 ab | 0.08 abcd | 0.59 g | 0.50 g | 1.86 cd | 2.17 bc | 0.94 bc | 5.86 ab | 2.02 a | 21.92 bc |
| S. oleracea | 0.07 ab | 0.08 c | 0.08 b | 0.07 abc | <0.02a) | 0.10 ab | 0.09 a | 0.73 abc | 0.20 ab | 8.51 bc | 0.16 a | 18.35 bc |
| B. vulgaris | 0.07 ab | 0.06 abc | 0.05 ab | 0.05 abc | 0.04 a | 0.06 a | 0.11 a | 0.21 a | 0.04 a | 1.02 a | 0.11 a | 8.73 ab |
Data were compared using one-way ANOVA followed by the Tukey’s multiple comparison test (p<0.05). Within a column, means followed by the same letter are not significantly different. a) Under the detection limit.
The trends for interspecific differences in concentration were not the same for shoots and roots. In fact, B. oleracea, B. rapa, C. coronarium, and S. oleracea had high shoot concentrations of chemicals with low log KOW, such as dinotefuran, imidacloprid, clothianidin, and thiacloprid; however, their root concentrations were not high. Chrysanthemum coronarium also had high shoot concentrations of fosthiazate, metalaxyl, fenobucarb, and flutolanil, which had intermediate log KOW. In C. coronarium, the root concentrations of fenobucarb and flutolanil were high, but those of fosthiazate and metalaxyl were not. In brief, for C. coronarium, the concentrations of chemicals with log KOW lower than that of metalaxyl were high in the shoot and low in the root; those with high log KOW, such as β-HCH, tolclofos-methyl, and dieldrin, were low in the shoot and high in the root; and those of fenobucarb and flutolanil with intermediate log KOW were high in both the shoot and root. Cucumis sativus and C. maxima had high concentrations of dieldrin in the shoots and medium concentrations in the roots. This result was consistent with previous reports in which shoot concentrations of dieldrin in Cucurbitaceae were particularly high.21)
The concentrations of organic chemicals in shoots and roots differed among the plant species. To determine the factors important for these differences, we considered two processes: uptake from the soil solution to the root and root–shoot translocation. We defined the uptake amount of chemicals per root (i.e., the amount of chemicals in the whole plant per dry weight of the root [mg/kg root]) as the uptake of chemicals from the soil (or soil solution) to the root (Table 6), and the shoot–root concentration ratio (S/R conc. ratio) as the translocation of chemicals from root to shoot (Table 7).
| Plants | The uptake amount of chemicals per root (mg/kg roota)) | |||||||||||
|---|---|---|---|---|---|---|---|---|---|---|---|---|
| Dinotefuran | Imidacloprid | Clothianidin | Thiacloprid | Fosthiazate | Metalaxyl | Fenobucarb | Procymidone | Flutolanil | β-HCH | Tolclofos-methyl | Dieldrin | |
| H. distichon | 20.43 de | 1.30 bcde | 3.46 ef | 0.42 abcde | 1.92 a | 4.18 abc | 0.97 a | 8.48 efg | 0.60 a | 7.45 def | 0.05 a | 1.45 a |
| Z. mays | 7.72 abc | 0.39 ab | 0.55 ab | 0.24 abc | 5.29 abc | 4.29 abc | 1.73 a | 3.01 ab | 1.05 ab | 2.48 ab | 0.03 a | 0.39 a |
| G. max | 18.31 de | 1.40 cde | 0.18 a | 0.76 de | 5.84 abc | 9.07 bc | 2.12 a | 6.96 def | 0.04 a | 5.30 bcde | 0.04 a | 1.63 a |
| P. vulgaris | 2.64 abc | 0.05 a | 0.04 a | 0.04 a | 2.19 a | 0.46 a | 0.49 a | 0.92 ab | 0.04 a | 3.71 abc | 0.05 a | 0.44 a |
| B. oleracea | 65.46 g | 3.73 g | 5.56 g | 3.21 g | 21.63 d | 16.95 d | 1.63 a | 14.41 h | 0.34 a | 12.38 g | 0.10 a | 1.32 a |
| B. rapa | 30.76 f | 1.86 ef | 4.31 fg | 1.33 f | 7.22 abc | 4.27 abc | 0.73 a | 10.84 g | 0.10 a | 7.57 deg | 0.08 a | 0.84 a |
| C. coronarium | 30.04 ef | 3.85 g | 4.75 fg | 2.37 g | 45.17 e | 32.36 e | 16.95 c | 3.47 abc | 3.42 c | 5.39 bcde | 1.37 b | 1.05 a |
| L. sativa | 4.23 abc | 0.87 abcd | 0.46 ab | 0.32 abcd | 0.73 a | 1.58 a | 0.11 a | 2.16 ab | 0.24 a | 3.23 abc | 0.11 a | 0.85 a |
| A. wakegi | 19.35 de | 1.25 bcde | 2.23 cde | 0.10 ab | 4.26 ab | 0.41 a | 2.42 a | 8.83 efg | 1.76 b | 8.02 ef | 0.08 a | 3.07 a |
| A. graveolens | 13.60 bcd | 0.63 abc | 1.27 abcd | 0.25 abc | 17.90 cd | 2.53 ab | 13.32 bc | 0.47 a | 0.09 a | 0.13 a | 0.42 a | 0.23 a |
| S. lycopersicum | 23.19 def | 2.54 f | 2.40 de | 0.64 cde | 4.19 ab | 0.19 a | 2.31 a | 7.74 defg | 0.51 a | 3.98 bcd | 0.06 a | 1.32 a |
| C. grossum | 13.63 bcd | 1.71 def | 0.86 abc | 0.05 ab | 1.76 a | 0.78 a | 0.31 a | 4.89 bcd | 0.14 a | 3.72 abc | 0.05 a | 0.91 a |
| C. sativus | 16.28 cd | 1.53 cde | 1.78 bcd | 0.55 bcde | 4.84 abc | 5.83 abc | 2.31 a | 10.17 fg | 0.10 a | 10.86 fg | 0.20 a | 14.14 b |
| C. maxima | 18.19 d | 1.75 def | 1.43 abcd | 0.91 ef | 17.43 bcd | 10.03 c | 9.34 b | 6.52 cde | 0.12 a | 6.48 cde | 0.13 a | 37.70 c |
| S. oleracea | 17.55 cd | 1.62 def | 4.43 fg | 0.05 ab | 0.40 a | 0.30 a | 0.15 a | 1.22 a | 0.35 a | 6.53 cde | 0.04 a | 0.52 a |
| B. vulgaris | 18.62 d | 0.63 abc | 1.82 bcd | 0.12 ab | 6.04 abc | 6.42 abc | 0.56 a | 3.40 abc | 0.62 a | 3.75 abc | 0.08 a | 0.34 a |
Data were compared using one-way ANOVA followed by Tukey’s multiple comparison test (p<0.05). Within a column, means followed by the same letter are not significantly different. a) Amount of chemicals in whole plant per dry weight of root
| Plants | Shoot- root concentration ratios | |||||||||||
|---|---|---|---|---|---|---|---|---|---|---|---|---|
| Dinotefuran | Imidacloprid | Clothianidin | Thiacloprid | Fosthiazate | Metalaxyl | Fenobucarb | Procymidone | Flutolanil | β-HCH | Tolclofos-methyl | Dieldrin | |
| H. distichon | 34.02 ab | 12.50 ef | 24.58 d | 4.05 c | 6.55 a | 17.08 abc | 1.64 d | 8.85 e | 0.72 ab | 1.76 e | 0.035 c | |
| Z. mays | 10.48 a | 3.13 a | 6.54 ab | 1.76 b | 13.93 a | 11.30 ab | 3.30 e | 3.14 bc | 1.74 b | 0.61 c | 0.024 bc | |
| G. max | 31.49 ab | 1.86 a | 0.35 a | 0.63 ab | 9.24 a | 6.23 a | 1.47 cd | 1.37 ab | 0.37 abc | 0.019 b | ||
| P. vulgaris | 2.28 a | 5.32 a | 0.78 a | 0.98 abcd | 0.41 a | 0.59 bc | 0.034 c | |||||
| B. oleracea | 92.63 d | 9.18 cd | 22.68 d | 5.92 d | 58.06 b | 34.19 c | 1.37 bcd | 4.75 cd | 0.19 a | 0.35 abc | 0.011 ab | |
| B. rapa | 61.63 bcd | 7.81 cd | 22.83 d | 3.96 c | 17.72 a | 7.76 a | 1.25 bcd | 5.83 d | 0.08 a | 0.60 bc | 0.014 ab | |
| C. coronarium | 148.59 e | 15.54 f | 26.42 d | 7.44 e | 54.65 b | 130.31 d | 0.59 abc | 0.07 a | 0.22 a | 0.02 a | 0.002 a | 0.002 a |
| L. sativa | 5.85 a | 1.69 a | 2.40 ab | 1.46 ab | 1.68 a | 2.92 a | 0.56 a | 0.10 a | 0.09 a | 0.002 a | ||
| A. wakegi | 3.47 a | 1.77 a | 3.57 ab | 0.28 a | 3.18 a | 0.36 a | 0.36 ab | 1.18 ab | 0.49 a | 0.16 a | 0.034 c | |
| A. graveolens | 13.90 a | 45.95 b | 16.58 abc | 2.94 e | 0.04 a | 0.012 b | 0.007 ab | |||||
| S. lycopersicum | 20.41 a | 8.36 cd | 9.90 bc | 1.81 b | 8.77 a | 0.36 a | 5.19 f | 3.39 c | 0.31 a | 0.22 a | 0.020 bc | |
| C. grossum | 12.76 a | 10.81 de | 8.94 ab | 7.12 a | 3.41 a | 0.49 abc | 5.04 cd | 0.20 a | 0.35 abc | 0.018 bc | ||
| C. sativus | 55.77 bcd | 4.04 ab | 8.78 ab | 1.08 ab | 2.39 a | 2.68 a | 0.21 a | 0.65 a | 0.31 abc | 0.013 b | 0.074 d | |
| C. maxima | 12.32 a | 3.90 ab | 3.56 ab | 1.63 ab | 3.88 a | 2.78 a | 0.67 abcd | 0.42 a | 0.15 a | 0.231 e | ||
| S. oleracea | 93.07 d | 6.69 bc | 18.53 cd | 1.03 a | 0.72 abcd | 0.57 a | 0.60 a | 0.27 ab | 0.008 ab | |||
| B. vulgaris | 68.63 cd | 3.02 a | 10.05 bc | 0.68 ab | 47.55 b | 32.09 bc | 1.40 cd | 4.79 cd | 4.41 c | 1.01 d | 0.008 ab | |
Data were compared using one-way ANOVA followed by Tukey’s multiple comparison test (p<0.05). Within a column, means followed by the same letter are not significantly different.
High shoot concentrations of chemicals necessitate a high uptake by the root from the soil solution, and also high root–shoot translocation. If translocation is low and uptake is high, the root concentration will be high, but the shoot concentration will be low. Conversely, if uptake is low and translocation is high, the concentration of chemicals in the shoot will not be high because of a lack of supply from the root.
Brassica oleracea, B. rapa, and C. coronarium—which had 2–5 times higher shoot concentrations of dinotefuran, imidacloprid, clothianidin, and thiacloprid than the other species (Table 5)—had both high uptake (much uptake per root) and translocation (high S/R conc. ratios) of these chemicals. In other words, B. oleracea, B. rapa, and C. coronarium effectively took up these chemicals from the soil solution and transported them to the shoot. This seemed to result in high shoot concentrations of dinotefuran, imidacloprid, clothianidin, and thiacloprid and low root concentrations in B. oleracea, B. rapa, and C. coronarium. In S. oleracea, there were higher S/R conc. ratios of dinotefuran, imidacloprid, and clothianidin than in the other species. This high translocation ability compensated for the medium uptake of these chemicals, and their shoot concentrations in S. oleracea were high. Hordeum distichon was nearly equal to B. oleracea, B. rapa, and C. coronarium in the translocation of imidacloprid, clothianidin, and thiacloprid, but was inferior in their uptake. As a result, H. distichon had medium shoot concentrations of these chemicals as compared with other test plants.
Chrysanthemum coronarium had shoot concentrations of fosthiazate, metalaxyl, fenobucarb, and flutolanil about 10 times those of the other plant species; C. coronarium showed superior uptake of chemicals with a middle range of log KOW values. However, the translocation of fosthiazate and metalaxyl was high, but that of fenobucarb and flutolanil was not. Therefore, it seems that the superior uptake of C. coronarium was the leading factor in the higher shoot concentrations of these chemicals, although the translocation of fenobucarb and flutolanil was not high.
Shoot concentrations of dieldrin in C. sativus and C. maxima were 10–50 times those of the other plant species, likely due to their evidently superior uptake and translocation. Cucurbitaceae have a specific transport mechanism for highly hydrophobic organic chemicals such as dieldrin; it was previously suggested that they have transport proteins that play an important role in root–shoot translocation of dieldrin.22,23)
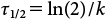
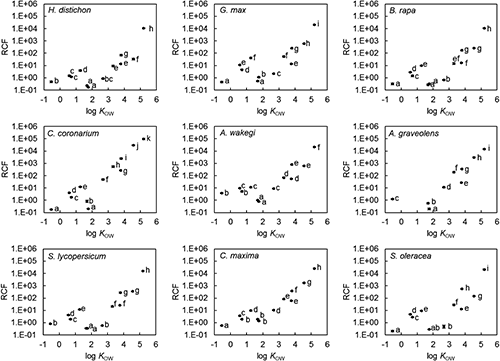
2. Bioconcentration factors of organic chemicals in roots and shootsIn the preceding section, we discussed differences in the uptake and translocation of organic chemicals among plant species. Here, we consider the effects of the properties of chemicals on their uptake and translocation by plants. It is thought that organic chemicals in the soil are taken up by roots through a soil solution and then transported from the roots to the shoots. Therefore, we regarded the soil solution as a medium in soil cultivation conditions. In this experiment, because the concentrations in the soil solution differed widely among the chemicals (Table 3), we could not simply compare their concentrations in shoots or roots. When the concentrations of chemicals in media differ, the bioconcentration factor (BCF) is widely used to compare uptake or translocation.20,24–26) We used two kinds of BCFs to compare the uptake and translocation of plants. We defined the root concentration factor (RCF) as the concentration in the root divided by the concentration in the soil solution and the shoot concentration factor (SCF) as the concentration in the shoot divided by the concentration in the soil solution. Furthermore, we chose one plant per family from among the 16 test plant species (resulting in seven species): H. distichon (Poaceae), Glycine max (Fabaceae), B. rapa (Brassicaceae), C. coronarium (Asteraceae), S. lycopersicum (Solanaceae), C. maxima (Cucurbitaceae), and S. oleracea (Amaranthaceae). We plotted the log KOW of the chemicals against the RCF (Fig. 1) or SCF (Fig. 2) and examined the relationships between the chemical properties and BCFs.
From low to high log KOW, although the RCF values tended to decrease for fosthiazate, metalaxyl, and fenobucarb, the RCF values for the other chemicals increased exponentially. Moreover, the pattern for each chemical was roughly similar among the test plants. In general, organic chemicals are thought to be taken up by roots mainly by sorption, and if this sorption is strong, then log KOW is high. In a previous report, RCF values also increased exponentially with increasing log KOW.2) Therefore, we suggest that the plant uptake of these organic chemicals was mainly controlled by their hydrophobicity, as indicated by log KOW values.
The SCF values remained around 101 for chemicals of log KOW −0.5 to 1 (dinotefuran to thiacloprid), decreased from 100 to 10−1 for chemicals of log KOW 1.5–2.5, and, in H. distichon, G. max, B. rapa, A. wakegi, S. lycopersicum, and S. oleracea, tended to increase from 102 to 104 for chemicals having log KOW>3 (procymidone to dieldrin). The SCF values in C. maxima were constant at 101 for chemicals of low to intermediate log KOW, and those for chemicals of high log KOW increased as they did for the above plant species. In C. coronarium and A. graveolens, the SCF values varied little in the range of 101 to 102 for chemicals of low to high log KOW. The pattern of each graph did not show similar trends among the plants, and there were unclear relationships between translocation and log KOW. Plant metabolism is an important factor for the plant uptake model of organic chemicals.27) In our study, however, the degree to which plants metabolized each organic chemical was not considered because it was difficult to confirm the material balance of the chemicals in the soil culture experiment. Therefore, to determine the detailed relationships between translocation and log KOW of organic chemicals in plant species, further studies are needed with precise experiments using hydroponic medium or radioisotope-labeled chemicals.
3. General discussionThe shoot concentrations of each chemical were different among the plant species, and we found combinations of plant species and organic chemicals with high shoot concentrations. Brassica oleracea, B. rapa, and C. coronarium had high shoot concentrations of chemicals with low log KOW such as dinotefuran, imidacloprid, clothianidin, and thiacloprid. Only C. coronarium also had high shoot concentrations of chemicals with intermediate log KOW, such as fosthiazate, metalaxyl, fenobucarb, and flutolanil. Cucumis sativus and C. maxima had high shoot concentrations of, specifically, dieldrin, which has high log KOW. It is also thought that a structural specificity may influence chemicals with low log KOW (i.e., dinotefuran, imidacloprid, clothianidin, and thiacloprid) because these are all neonicotinoid chemicals.
We compared the concentrations of organic chemicals in roots and shoots, not in edible parts. Moreover, we did not take into account the various MRLs for combinations of plant species and organic chemicals. Although the possibility of exceeding the MRLs cannot be determined directly using our data, the results will be useful in considering plant residue for pesticides remaining in the soil.
Plant uptake and the translocation of organic chemicals were related conventionally to log KOW by data obtained in hydroponic experiments. If the RCF and SCF values can be correlated with the log KOW, concentrations of certain organic chemicals in roots and shoots can be predicted from their concentrations in the soil solution. The concentrations in roots may be predicted to a certain extent because the RCF values can be related to log KOW—RCF values increased with increasing log KOW. However, for shoots, root–shoot translocation seemed to depend on log KOW because the S/R conc. ratio decreased with increasing log KOW, but the relationship between the SCF value and log KOW was not clear and showed different patterns according to plant species. Henceforth, it will be necessary to plan a more detailed study of plant physiological factors, for example, root morphology (fineness or surface area), lipid contents, chemical metabolism activity, and the possible existence of carriers that may cause differences in the concentration of organic chemicals among plant species.
This research was supported by the Environmental Research and Technology Development Fund (5-1302 and 5-1703) of the Ministry of the Environment, Japan.