Abstract
While pcp genes are well known in Gram-negative bacteria to code for the enzymes responsible for pentachlorophenol (C6HCl5O; PCP) degradation, little is known about PCP-degrading genes in Gram-positive bacteria. Here we describe a novel gene operon possibly responsible for catalyzing the degradation of PCP in the Gram-positive bacterium Nocardioides sp. strain PD653, which is capable of mineralizing hexachlorobenzene (C6Cl6; HCB) via PCP. Transcriptome analysis based on RNA-Seq revealed overexpressed genes in strain PD653 following exposure to HCB. Based on in silico annotation, three open reading frames (ORFs) were selected as biodegrading enzyme candidates. Recombinant E. coli cells expressing candidate genes degraded approximately 9.4 µmol L−1 PCP in 2 hr. Therefore, we designated these genes as hcbB1, hcbB2, and hcbB3. Interestingly, PCP-degrading activity was recorded when hcbB3 was coexpressed with hcbB1 or hcbB2, and the function of HcbB3 was expected to be similar to chlorophenol 4-monooxygenase (TftD).
Introduction
Pentachlorophenol (C6HCl5O; PCP) has been widely used as a biocide, wood preservative, and disinfectant and as an ingredient in anti-fouling paint.1) The toxicity of PCP to a wide variety of organisms, both plant and animal, is due to interference with oxidative phosphorylation and is particularly acute and chronic in fish. The indiscriminate use of PCP has led to the contamination of water and soil ecosystems. In 2015, PCP (and its salts and esters) was added to Annex A of the Stockholm Convention as a new persistent organic pollutant (POP).2)
Bioremediation is expected to be an effective way to eliminate PCP residue at the contaminated site. Numerous PCP-degrading microorganisms have been reported,3) and a few strategies to evaluate the PCP-degrading microbial community in situ based on molecular biological techniques have been established.4,5) Sphingobium chlorophenolicum ATCC 39723 is one of the most studied model bacteria capable of mineralizing PCP.6) In the PCP metabolism, strain ATCC 39723 recruits PcpB, a single flavin-containing protein PCP-4 monooxygenase (AAF15368; encoded by pcpB), and PcpD, a 2,3,5,6-tetrachloro-p-benzoquinone (TCBQ) reductase (AAA68938; encoded by pcpD) for the para-hydroxylation of PCP to 2,3,5,6-tetrachloro-p-hydroquinone (TeCH).7) It was reported that pcpB or its allele had been detected in sphingomonads isolated from geographically separated contaminated sites, suggesting the widespread distribution of this gene.8,9) In contrast, in other bacterial genera, it remains unclear whether PCP degradation is done by the Pcp enzyme or its orthologs, which in any case implies the presence of another catabolic gene involved in the initial dechlorination of PCP.10–12)
Nocaridoides sp. strain PD653 was isolated as the first bacterium mineralizing hexachlorobenzene (C6Cl6; HCB) via PCP under aerobic conditions.13) Recently, hcbA genes involved in catalyzing the aerobic dechlorination of HCB have been identified in PD653 genome. On the other hand, pcp genes were not found by polymerase chain reaction (PCR) amplification or by analysis of the draft genome sequence.13,14) This suggests that another enzyme system contributes to PCP metabolism. Within this context, the aim of this study was the isolation and characterization of a PD653 gene(s) coding for enzymes involved in the degradation of PCP.
Materials and Methods
1. Bacterial strains and culture conditionsHCB was purchased from Dr. Ehrenstorfer GmbH (Augsburg, Germany). PCP and 2,6-dichloro-p-benzoquinone (DiCH) were purchased from Wako Pure Chemical Industries (Osaka, Japan). TeCH and TCBQ were purchased from Tokyo Chemical Industry Co., Ltd. (Tokyo, Japan). The bacterial strains and plasmids used in this study are listed in Table 1. Mineral-salt medium (MM) and the preculture medium were prepared as previously described.14) Luria-Bertani (LB) was used as a growth medium for E. coli cells. E. coli DH5α (TOYOBO, Osaka, Japan) and BL21 (DE3) (Novagen, Madison, WI, USA) were used as host strains for the pACYCDuet-1 plasmids and their derivatives. The recombinants were cultured in LB medium supplemented with 32 µg mL−1 chloramphenicol.
Table 1. Bacterial strains and plasmids used in this study
| Strain or plasmid | Relevant characteristicsa) | Reference or origin |
|---|
| Strains | | |
| Nocardioides sp. PD653 | HCB+ | 13 |
| E. coli DH5α | F−, l−, f80ΔlacZDM15, Δ(lacZYA-argF)U169, deoR, recA1, endA1, hsdR17(rk−, mk+), phoA, supE44, thi-1, gyrA96, relA1 | TOYOBO |
| E. coli BL21(DE3) | F− ompT hsdS B(rB− mB−) gal dcm λ(DE3); T7 RNA polymerase gene under the control of the lacUV promoter | Novagen |
| Plasmids | | |
| pGEM-T easy | Apr lacZ, pMB1-derived replicon, TA cloning vector | Promega |
| pACYCDuet-1 | Cmr pACYC184-derived p15A replicon, T7 promoter, two MCS, expression vector | Novagen |
| pA1B-2B | Cmr, pA1B with PCR-amplified DNA fragment of ORF2 in MCS2 | This study |
| pA1B-3B | Cmr, pA1B with PCR-amplified DNA fragment of ORF3 in MCS2 | This study |
| pA2B-3B | Cmr, pA2B with PCR-amplified DNA fragment of ORF3 in MCS2 | This study |
| pA1B | Cmr, pACYCDuet-1with PCR-amplified DNA fragment of ORF1 in MCS1 | This study |
| pA2B | Cmr, pACYCDuet-1with PCR-amplified DNA fragment of ORF2 in MCS1 | This study |
| pA3B | Cmr, pACYCDuet-1with PCR-amplified DNA fragment of ORF3 in MCS1 | This study |
a) HCB+, able to degrade hexachlorobenzene (HCB); Apr, ampicillin resistant; Cmr, chloramphenicol resistant.
Total RNA was extracted as described previously.14) Briefly, frozen cell culture samples were thawed and incubated with 5 mg L−1 lysozyme for 5 min and then disrupted with glass beads and Sepasol-RNA I (Nacalai Tesque, Kyoto, Japan). DNA traces were removed using recombinant DNase (TaKaRa, Tokyo, Japan). The RNA quality was checked by performing 1% native agarose gel electrophoresis. The RNA concentration was quantified by ND-8000 (Nano Drop; Thermo Fisher, Lafayette, CO, USA).
3. RNA-seq analysisStrain PD653 was grown to the mid-exponential phase (OD600=1.0) in a pre-culture medium, harvested by centrifugation at 8,000×g for 10 min at 4°C, and washed with MM. Washed cells were suspended in 1 mL of MM and inoculated into 9 mL of the same medium supplemented with 35.11 µmol L−1 of HCB (mother solution of HCB in acetone) in 50 mL glass-stoppered Erlenmeyer flasks. As a control, cultures were supplemented with 50 µL of acetone. The flask cultures were incubated at 30°C for 8 hr under agitation at 180 rpm (in triplicate). Bacterial cells were collected by centrifugation at 8,000×g for 10 min at 4°C. The bacterial pellet was immediately frozen in liquid nitrogen and subsequently stored at −80°C, followed by total RNA extraction.
Ribosomal RNA was removed using a RiboZero bacteria kit (Illumina KK, Tokyo, Japan) according to the manufacturer’s recommendation. Then mRNA was used as a template to prepare an mRNA library with the NEBNext Prep Kit for Illumina (New England BioLabs, Ipswich, MA, USA). The protocol was modified as follows: Random hexamer primers were used for reverse transcription. After the second strand synthesis, double-stranded cDNA was fragmented to an average length of 300 bp using a Covaris S2 sonication system (Covaris, Woburn, CA, USA). One hundred cycles of paired-end sequencing were carried out using a HiSeq2500 system according to the manufacturer’s specifications (Illumina). After the sequencing reactions were complete, the Illumina analysis pipeline (CASAVA 1.8.0) was used to process the raw sequencing data. The RNA-seq reads were trimmed using CLC Genomics Workbench ver. 9.5. with the following parameters: Phred quality score >30; 15 terminal nucleotides from the 5′ end and 2 nucleotides from the 3′ end were removed, as well as truncated reads of less than 30 nucleotides in length. Trimmed reads were mapped to all of the genes in Nocardioides sp. PD653 (accession numbers: BDJG01000001–BDJG01000087) using CLC Genomics Workbench ver. 9.5. (Qiagen, Valencia, CA, USA) with the following parameters: length fraction=0.7; similarity fraction=0.9; maximum number of hits for a read=1. The expression level of each gene was calculated by counting the mapped reads to each gene and was normalized by calculating reads per kilobase million (RPKM) values. Original sequence reads were deposited to the DRA/SRA database with the accession number PRJDB6176 in DDBJ.
4. Nucleotide and amino acid sequence analysis of PCP-degrading gene candidatesDeduced amino acid sequences were compared to known ones using blastp (https://blast.ncbi.nlm.nih.gov/Blast.cgi).
5. Cloning and expression of PCP-degrading gene candidates in E. coli cellsPrimers synthesized to amplify ORFs of the candidate genes (ORF1–3) are shown in Table 2. These primers were used to amplify ORF1–3 full sequences with a KOD Plus Neo DNA polymerase (TOYOBO) using PD653 genomic DNA as a template. Purified PCR products were then inserted in the NcoI site (MCS1) of pACYCDuet-1 (Novagen) by in-fusion cloning (Clontech) according to the manufacture’s instruction. Three recombinant plasmids were obtained: pA1B, pA2B, and pA3B for ORF1, ORF2, and ORF3, respectively. Plasmid pA1B-2B, containing ORF1 at MCS1 and ORF2 at the second multicloning site (MCS2) of pACYCDuet-1, was formed by amplifying ORF2 by PCR using primers hcbB2_NdeI_F and hcbB2_XhoI_R. The PCR-amplified fragment containing ORF2 was inserted into the NdeI-XhoI site at the MCS2 of pA1B by in-fusion cloning. The plasmid pA1B-3B (containing ORF1 at MCS1 and ORF3 at MCS2) was constructed by amplifying ORF3 by PCR using primers hcbB3_NdeI_F and hcbB3_XhoI_R and then inserted into the NdeI-XhoI site of pA1B. Plasmid pA2B-3B (containing ORF2 at MCS1 and ORF3 at MCS2) was constructed by amplifying the fragment containing ORF3 by PCR using primers hcbB3_NdeI_F and hcbB3_KpnI_R and then inserted into the NdeI–KpnI site of pA2B. The recombinant plasmids were sequenced and transformed into E. coli BL21 (DE3). E. coli cells harboring the expression vectors were inoculated into LB medium and shaken overnight at 210 rpm and 37°C. The overnight culture was inoculated into fresh LB medium containing 0.25 mmol L−1 isopropyl-β-thiogalactoside (IPTG). The initial OD600 was adjusted to 0.6, and gene expression was induced in a culture kept at 37°C and shaken at 210 rpm for 4 hr. The induced cells were then harvested by centrifuging at 1,600×g and 4°C for 10 min and washed with phosphate-buffered saline (PBS). As a control, E. coli BL21 (DE3) harboring an empty pACYCDuet-1 plasmid was induced and washed.
Table 2. Primers used in this study
| Specific primers used for amplification of candidate genes involved in degradation of PCP | Reference |
|---|
| hcbB1_NcoI_F | AGGAGATATACCATGAACGAGGCAGAGCACAAAG | This study |
| hcbB1_NcoI_R | TGGCTGCTGCCCATGTCATGACTTTCCGTAAACCC | This study |
| hcbB2_NcoI_F | TGGCTGCTGCCCATGCTAATTGGCCCACGACGG | This study |
| hcbB2_NcoI_R | AGGAGATATACCATGACCTCCATGTCGTCCGTC | This study |
| hcbB2_NdeI_F | AAGGAGATATACATATGACCTCCATGTCGTCCG | This study |
| hcbB2_XhoI_R | CTTTACCAGACTCGACTAATTGGCCCACGACGG | This study |
| hcbB3_NcoI_F | AGGAGATATACCATGATGATCCGGACCGGGGAA | This study |
| hcbB3_NcoI_R | TGGCTGCTGCCCATGCTAACGCGCTGCGGCGGA | This study |
| hcbB3_NdeI_F | AAGGAGATATACATATGATCCGGACCGGGGAAC | This study |
| hcbB3_XhoI_R | CTTTACCAGACTCGACTAACGCGCTGCGGCGGA | This study |
| hcbB3_KpnI_R | TTACCAGACTCGAGGCTAACGCGCTGCGGCGGA | This study |
| RT-PCR and RT-qPCR primers | |
|---|
| hcbB1_RT_F | ACGTGGTCTACGCCTTTGAC | This study |
| hcbB2_RT_F | TCTTGGACAGCTACCACGTATG | This study |
| hcbB2_RT_R | CACGAAAGCTACTTGTTCTCCC | This study |
| hcbB3_q_F | GAGCTTCAGGATCTGATGACCT | This study |
| hcbB3_q_R | CCGTCGAACTTCCTGATGAT | This study |
| rpoB_q_F2 | CTGATCGGCAACGAGAAGTGG | This study |
| rpoB_q_R2 | TGAACTCCGCGGAGACGTAG | This study |
| rpoB_q_F | AGATCTCCGAACCACTCGAA | 14 |
| rpoB_q_R | TGTTGATCTTGTAGCGACCG | 14 |
Washed recombinant E. coli cells were suspended in 1 mL of MM and inoculated at OD600=3.0 (a dry weight cell concentration of 1.17 g L−1) in triplicate into 4 mL of MM supplemented with 9.4 µmol L−1 PCP in a glass-stoppered Erlenmeyer flask. The cultures were shaken at 210 rpm and incubated at 37°C for 4 hr. Triplicate samples were collected at different time points, supplemented with 10 mL of acetonitrile, and centrifuged at 19,000×g for 10 min. The PCP concentrations in the supernatant were analyzed by HPLC.
6.2. Detection of the metabolite of PCPE. coli BL21 (DE3)/pA1B-3B was cultured overnight in LB medium. The culture was inoculated to a new LB medium containing 1 mmol L−1 IPTG with initial OD600=0.6, shaken at 210 rpm, and incubated at 30°C for 4 hr. Twenty milliliters of an induced culture of E. coli BL21 (DE3)/pA1B-3B was harvested and suspended in 5 mL of PBS. The cell suspension was sonicated by an ultrasonic processor (VP-300N, TAITECH, Saitama, Japan) for 20 sec×6, with 20 sec intervals, on ice. The disrupted cells were centrifuged at 10,000×g and 4°C for 30 min, and the resulting supernatant was used as a clear lysate. The clear lysate was supplemented with 37.5 µmol L−1 PCP. Samples were shaken at 210 rpm and 30°C for 1 hr. After incubation, the sample was acetylated by adding 1.5 mL of 1 M K2CO3 and 0.5 mL of acetanhydride for 10 min at room temperature. Samples were subsequently extracted using ethyl acetate and analyzed via GC-MS.
6.3. Detection of the metabolites of TeCH and TCBQE. coli BL21 (DE3)/pA2B-3B was cultured overnight in LB medium. Five milliliters of the culture at OD600=0.6 was inoculated to 45 mL of a new LB medium containing 1 mmol L−1 IPTG. The cells were shaken at 210 rpm and induced at 37°C for 4 hr, then harvested and suspended in 1 mL of MM. The cell suspension was inoculated into 9 mL of the same medium supplemented with 0.5 mmol L−1 TeCH. Samples were incubated at 37°C for 2 hr under 210 rpm agitation. Seven-hundred-microliter samples were collected at several time points. To these were added with 100 µL of a 1/1 (vol/vol) mixture of CH3CN and 1 mol L−1 HCl to stop the reaction. Then samples were centrifuged at 19,000×g for 10 min. The supernatants were subjected to HPLC analysis.
The 10 mL culture of strain PD653 at a late exponential phase (OD600=1.0) was harvested and washed with MM. Washed cells were resuspended in 5 mL of MM (OD600=2.0) and transferred to a 50 mL glass-stoppered Erlenmeyer flask. This culture was supplemented with 0.5 mmol L−1 TCBQ and shaken at 180 rpm and 30°C for 8 hr. Aliquots (700 µL) were gathered at 0.5, 1, 2, 4, and 8 hr, and 100 µL of a 1/1 (vol/vol) mixture of CH3CN and 1 mol L−1 HCl was added to stop the reaction. The sample solutions were prepared and analyzed as described above. As a control, heat-killed cells were incubated and analyzed.
7. Analytical methodsChloroaromatic compounds were measured using an HPLC (Hewlett-Packard series 1100; Hewlett-Packard, Waldbornn, Germany) equipped with a UV detector as described previously.14) For the detection of PCP, TCBQ, and TeCH, the UV absorption wavelengths were monitored at 210, 292, and 304 nm, respectively. The mobile-phase composition was 60 : 40 acetonitrile/0.1% aqueous phosphoric acid. Mass spectra of TCHQ were acquired using an ACQUITY UltraPerformance Liquid Chromatography (UPLC) system (Waters, Milford, MA, USA) equipped with a Micromass Quattro micro API tandem quadruple system (Waters). Mass spectra were acquired using a Z-spray source in electrospray ionization mode and total ion current mode. The electrospray ionization conditions used to analyze TCHQ were a capillary voltage of 3.3 kV, a cone voltage of 32 V, a source temperature of 80°C, a desolvation temperature of 200°C, a cone gas flow rate of 50 L h−1, and a desolvation gas flow of 800 L h−1. TCHQ was detected in negative ion mode using an m/z range of 75 to 500. The UPLC and electrospray ionization mass spectrometry systems were controlled using MassLynx 4.1 software (Waters). Separation was performed using a Poroshell 120 EC-C18 column (150 mm long, 4.6 mm inner diameter; Agilent Technologies, Tokyo, Japan) at 40°C. The pump was set in an isocratic mode at a flow rate of 0.4 mL/min using the mobile phase composed of 20 mM ammonium acetate-acetonitrile and 20 mM ammonium acetate aqueous solution (60 : 40 v/v, pH 6.8). The mass spectrum of acetylated TeCH was acquired via GC-MS as described previously.13)
8. Synthesis of TCHQTCHQ was synthesized according to Hancock et al.15) Briefly, TCBQ was dissolved to ice-cooled 2 mol L−1 NaOH and stirred; then 2 mol L−1 HCl was added dropwise until the pH reached 5 to 6, and deep purple crystals were precipitated. These crystals were suction filtered with a Kiriyama funnel, washed with ice-cooled distilled water, and dried in vacuo. The 13C NMR spectra of synthesized TCHQ were recorded on a JEOL ECX 400 (JEOL, Tokyo, Japan). The chemical shifts (δ) were referenced to the residual solvent peak as the internal standard (DMSO-d6, 39.5 ppm). δC (100.5 MHz, DMSO-d6) 176.0, 166.4, 164.7, 145.0, 132.2, and 106.8.
9. Analysis of the operonic structure and hcbB3 expressionResting cells of strain PD653 were prepared in a manner similar to that described in the RNA-seq analysis section and inoculated into MM supplemented with 10 mg L−1 chloroaromatic compounds including HCB, PCP, TeCH, and DiCH. The flask cultures were incubated at 30°C under agitation at 180 rpm, then triplicate flask cultures were withdrawn at 0, 2, 4, and 8 hr. Cells of strain PD653 exposed to aromatic compounds were harvested by centrifugation at 8,000×g for 10 min at 4°C, stored at −80°C, and subjected to RNA extraction. cDNA was synthesized from 147 ng of total RNA by reverse transcription using a ReverTra Ace qPCR RT Master Mix (TOYOBO) following the manufacture’s recommendations.
The presence of a polycistronic mRNA transcribed from hcbB genes was determined via PCR using cDNA prepared from bacterial cultures supplemented with HCB, and primer pairs were used to amplify the intergenic regions between ORF1 and ORF2 (hcbB1_RT_F and hcbB2_RT_R) or ORF2 and ORF3 (hcbB2_RT_F and hcbB3_q_R), respectively (Table 2). The rpoB_q_F and rpoB_q_R for rpoB (accession no. GAW54585), a housekeeping gene encoding the RNA polymerase β-subunit, was used as a positive control in the RT-PCR experiments. PCR amplification was carried out using Go-Taq DNA polymerase as follows: one cycle at 95°C for 2 min, followed by 30 cycles at 95°C for 2 min, 60°C for 30 sec and 72°C for 1.5 min, and finally one cycle at 72°C for 1.5 min. The PCR products were separated by electrophoresis on a 1.5% (wt/vol) agarose gel.
The expression of ORF3 in PD653 exposed to chloroaromatic compounds relative to the control was analyzed via qPCR using a LightCycler96 instrument (Roche Diagnostics Applied Science, Indianapolis, IN, USA) with a THUNDERBIRD SYBR qPCR mix (TOYOBO). Primer sets were designed to amplify ORF3 (hcbB3_q_F and hcbB3_q_R) and rpoB14) (rpoB_q_F2 and rpoB_q_R2). The following reaction conditions were applied with 20 µL of reaction volume: one cycle at 95°C for 1 min, followed by 40 cycles at 95°C for 15 sec, 55°C for 30 sec, and 72°C for 60 sec. After 40 cycles of amplification, melting curve analyses starting from 65 to 90°C (0.2°C s−1) were performed to certify the purity of each amplicon. To validate the specificity of each primer set, the resulting amplicons were analyzed by electrophoresis on 1.5% agarose gel, then sequenced after cloning into pGEM-T easy vector. The standard curve of amplification was linear over 5 log dilutions (r2=0.999, slope −3.55 for hcbB3; r2=0.993, slope −3.16 for rpoB). Gene expression was calculated relative to the internal reference rpoB gene using the cycle threshold (2−ΔΔCt) method.
Results
1. Prediction of PCP catabolic genes by RNA-seq analysisOf the 5087 genes, 47 showed a greater than fourfold difference in mRNA levels between the PD653 cells exposed to HCB and those of the non-exposed control (p>0.05, Fig. S1). Most of the genes (38/47) located in contig 11 (GenBank accession no. BDJG01000011.1) and the three putative gene clusters consisting of PD653_1060–1072, PD653_1108–1125, PD653_1131–1145, and PD653_1156–1161 were induced (Table S1). Three coding sequences, PD653_1112–1114, were annotated as a pyridoxine 5′-phosphate oxidase, sugar phosphate isomerases/epimerases, and an aromatic ring hydroxylase.
2. Nucleotide and amino acid sequence analysis of candidate genesThe closest related protein of PD653_1112 (ORF1) was putative pyridoxine/pyridoxamine 5′-phosphate oxidase (accession no. KMO83753) from Mycobacterium chlorophenolicum, with 65% homology (query cover 80%, E value 1e-58). The closest related protein of PD653_1113 (ORF2) was a xylose isomerase-like TIM barrel (accession no. KMO83752) from Mycobacterium chlorophenolicum (query cover 89%, identity 50%, E value 9e-78). The deduced amino acid sequence of PD653_1114 (ORF3) showed 54% homology with the TftD catalyzing the sequential hydroxylation of 2,4,5-trichlorophenol to 2,5-dichlorohydroquinone and then to 5-chlorohydroxyquinol (UniProtKB/Swiss-Prot: O87009.2) in Burkholderia cepacia AC1100.11,17,18)
3. Biotransformation of PCP by recombinant E. coliThe PCP dissipation activity of the recombinant E. coli cell cultures obtained for the different constructions was studied. One could observe that none of the E. coli cultures transformed with the three recombinant plasmids containing each of the three genes was able to dissipate PCP. Coexpression of ORF1 and ORF2 (pA1B-2B) did not confer the ability to the recombinant E. coli culture to dissipate PCP. In contrast, coexpression of ORF1 and ORF3 (pA1B-3B) led to significant PCP-dissipation activity in the E. coli recombinant culture. Indeed, within 2 hr, the PCP added at 9.4 µmol L−1 was entirely dissipated (Fig. 1), giving a degradation rate of 4.1 nmol mg−1 h−1 on a dry cell weight basis. In addition, the coexpression of pA2B-3B was found to also provide PCP-dissipating ability to recombinant E. coli. The pA2B-3B PCP kinetics of dissipation was similar to that of pA1B-3B (data not shown). These results suggest that ORF3 encodes the protein catalyzing the dissipation of PCP, and ORF1 and ORF2 encode the component mediating the activity. Thus, we designated ORF1, ORF2, and ORF3 as hcbB1, hcbB2, and hcbB3, respectively. Despite many trials, we could not detect PCP transformation products (data not shown).
4. Identification of intermediate metabolites during the dissipation of PCP and TeCHWe hypothesize that the hcbB gene may code for the enzyme catalyzing the transformation of PCP to TeCH. To test this hypothesis, we searched for TeCH in the cleared lysate of induced cell cultures able to dissipate PCP. MS spectra identical to those of acetylated TeCH were obtained at the same retention time. This indicates that hcbB genes code for an enzyme system that catalyzes the conversion of PCP to TeCH (Fig. S2).
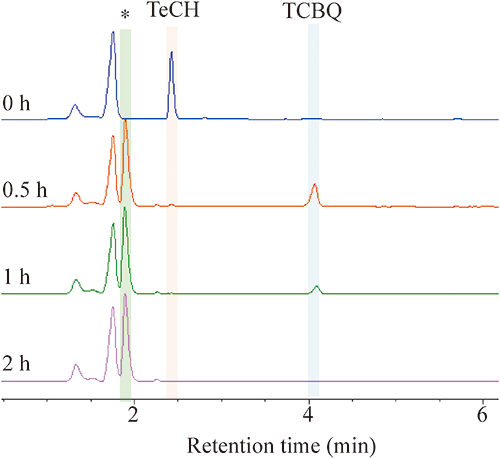
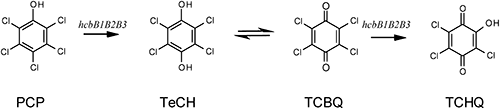
The cell suspensions were inoculated with TeCH (0.5 mM). Within 0.5 hr of incubation, the solution showed a yellow and then deep purple color. TCBQ and an unknown transformation product (TP) were detected by HPLC analysis (Fig. 2). The UV-visible spectrum of this TP exhibited adsorptions at 220 nm, 295 nm, and 537 nm. This TP has the same retention time and the same wavelengths of adsorption as the authentic standard of TCHQ analyzed in UPLC-MS. The mass spectrum of the authentic TCHQ was identical to the unknown metabolite, which was typical for a molecule containing three chlorines, with a prominent deprotonated molecular ion at m/z 225, 227, and 229 (Fig. S3). Therefore, this unknown TP is TCHQ. Together, these results indicate that TeCH was converted to TCBQ and then to TCHQ via hcbB genes (Fig. 3). Unfortunately, we cannot detect TCHQ from the PD653 resting cell.
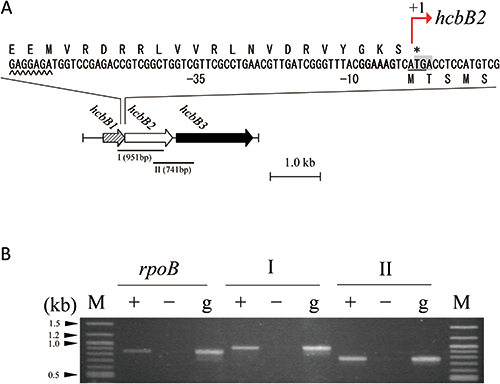
5. The operonic structure and hcbB gene inducibilityTo examine whether the three genes identified are transcribed polycistronically, the intergenic regions hcbB1–hcbB2 (region I) and hcbB2–hcbB3 (region II) were analyzed via RT-PCR, using as a template total RNA extracted from resting cells of strain PD653 cells exposed to HCB for 2 hr (Fig. 4A). Both intergenic regions were successfully amplified, suggesting that all three genes were transcribed as a single mRNA molecule (Fig. 4B).
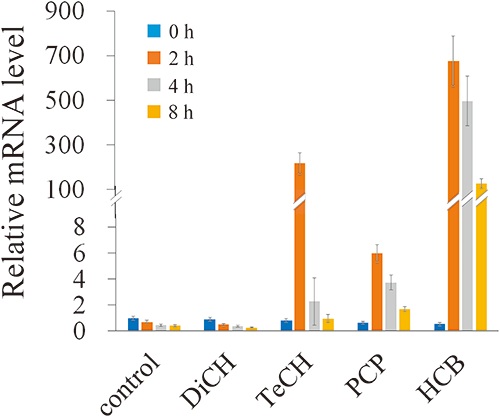
In order to confirm the RNA-seq data and to investigate the effect of HCB and of various chloroaromatic compounds formed during its transformation, the expression of hcbB3 was monitored via RT-qPCR. One could observe a significant upregulation of hcbB3 upon exposure to HCB relative to the control (Fig. 5). Indeed, after 2, 4, and 8 hr exposure to HCB, the expression of hcbB3 was, respectively, 675-, 497-, and 127-fold higher than in the control not exposed to HCB. In addition to this, it was observed that within 2 hr of exposure to TeCH, the hcbB3 expression increased 217-fold as compared to control. Therefore, hcbB3 expression is upregulated not only by HCB but also by TeCH, one of its TPs. The expression of hcbB3 in the cells exposed to PCP increased up to 5.9-fold at 2 hr. Exposure to DiCH did not affect the transcript levels of hcbB3.
Discussion
It is well known that pcp genes are widely distributed in sphingomonads. In addition, pcpB sequences and its variant have been detected from environmental DNA extracted from the PCP-contaminated site.19) Although PCP-degrading Gram-positive bacteria have been isolated from contaminated environments,20–23) almost nothing is known regarding the genes and enzymes involved in PCP metabolism. To the best of our knowledge, it has only been evidenced in Mycobacterium chlorophenolicum PCP-I that the membrane protein associated with cytochrome P-450 are involved in the hydroxylation of PCP.24) Orser et al. showed that pcpB probes did not hybridize with digested genomic DNA of this strain in a Southern blot analysis.10) This suggests that the Gram-positive actinobacteria such as Mycobacterium chlorophenolicus may have an enzyme system different from the pcp described in Gram-negative bacteria.
RNA-seq results led to the determination the PCP-degrading candidates. Three genes coding for the PCP-degrading enzyme system are located in the same genomic region, where hcbB3 and hcbB1 were separated by hcbB2 (Fig. 4A). The translational termination codon of hcbB1 was found to overlap (by three nucleotides) the initiation codon of hcbB2 (Fig. 4A), suggesting that these two genes may be translationally coupled. This gene structure is consistent with those of hcbA2 and hcbA3, which encode putative flavin reductase.14)
The deduced amino acid sequence of HcbB3 was similar to that of chlorophenol 4-monooxygenase (TftD), but not to that of PCP 4-monooxygese (PcpB); thus it is likely that HcbB3 belongs to the two component-flavin diffusible monooxygenase (TC-FDM) family protein. This hypothesis is supported by the evidence that the coexpression (hcbB3_hcbB1 or hcbB3_hcbB2) led to the transformation of PCP to TCHQ via TeCH. TftD catalyzes the two-step hydroxylation of 2,4,6-trichlorophenol to 5-chlorohydroxyquinol via 2,5-dichlorophenol,25) thus TftD and HcbB3 have a comparable biochemical function. PCP metabolic pathways implying TCHQ formation have been reported for Mycena avenacea TA 848026) and white-rot basidiomycete Coriolus versicolor.27) We propose the pathway for the degradation of PCP catalyzed by hcbB genes (Fig. 3); however, we could not detect TCHQ in strain PD653, possibly because it has a short half-life being rapidly transformed by PD653 into lower metabolites. In order to fill the missing link between the metabolic function of the wild-type strain and the genotypes identified in this study, establishing a method for gene manipulation in the genus Nocardioides is our ongoing work.
We serendipitously discovered that hcbB2 improves the PCP-degrading activity in the coexpression with hcbB3. Since TC-FDMs have been characterized as key catabolic enzymes of aromatic compounds,28–33) we hypothesized that hcbB1 and hcbB2 encode the flavin reductase component that supplies reduced flavins to allow HcbB3 to degrade PCP. Two potential flavin reductases, HcbB1 and HcbB2, did not share homology with TftC, a flavin reductase component of TftD. Nevertheless, it was demonstrated that the coexpression of either HcbB1 or HcbB2 with HcbB3 showed significant PCP-degrading activity. A possible explanation for this is the low specificity of HcbB3 to recognize its partner flavin reductase component. Indeed, in vitro assays demonstrated that TftD was able to utilize FADH2 supplied from not only histidine-tagged TftC but also Fre, an E. coli general flavin reductase.28) Recent reports also showed a lack of molecular specificity in the recognition of its partner flavin reductase.32,33) To fully determine the specificity of recognition among HcbB1–HcbB3 and HcbB2–HcbB3, the protein purification and further analysis of biochemical properties should be conducted in the future.
The transcriptional properties obtained from RNA-seq were in consistent with the RT-qPCR study showing that hcbB3 was significantly upregulated by HCB. Given that PD653 metabolizes PCP via TeCH and that TeCH induced the expression of hcbB3 (Fig. 5), the upregulation of hcbB3 in the presence of PCP might result from the metabolism by PD653. In many cases, the substrate inducing the catabolic gene expression is not the initial substrate but a degradation intermediate.34–36) However, it is interesting that hcbB3 was induced by the initial substrate HCB. Because of its toxicity, one cannot use HCB to induce catabolic gene expression. However, non-toxic inducers such as plant secondary metabolites (PSMs) are known to induce bph operons, which is involved in the degradation of polychlorinated biphenyls (PCBs), and have been applied to remediate soils contaminated with PCBs.37–39) A similar approach might be developed to search for a non-toxic inducer to optimize the PCP bioremediation process. The induction of hcbB3 expression can be used as a molecular marker to track natural compounds enhancing the PCP-degrading activity. It is noteworthy that two putative transcriptional regulators, MalT (PD653_1110) and GntR (PD653_1108), were found upstream from the hcbB operon (Table S1). As GntR-type regulators, PaaX40) involved in phenyl acetic acid degradation by E. coli strain W, PhcS41) and AphS42) involved in phenol degradation pathway in Comamonas testosteroni strains R5 and TA441, respectively, and BphS43) involved in the polychlorinated biphenyl degradation pathway in Pseudomonas sp. strain KKS102 have been described. These GntR family regulators exert their effects as the repressors of gene expression. To further investigate whether the genes encoding putative regulators are responsible for PCP metabolism in strain PD653, the deletion and complementation of these genes, as well as hcbB genes, are necessary.
Acknowledgment
This work was supported by a grant from the MEXT-Supported Program for the Strategic Research Foundation at Private Universities 2013–2017 (grant no. S1311017), JSPS Research Fellowships for Young Scientists (17J00825), and the Co-operative Research Programme, Trade and Agriculture (TAD/PROG) OECD/2010. We are grateful to Messrs. T. Hara and H. Konno, graduate students of Tokyo University of Agriculture, for their help for measurement of 13C-NMR.
References
- 1) P. G. Jorens and P. J. C. Schepens: Hum. Exp. Toxicol. 12, 479–495 (1993).
- 2) http://chm.pops.int/TheConvention/ThePOPs/TheNewPOPs/tabid/2511/Default.aspx (Accessed 5 Sep., 2017)
- 3) L. Bosso and G. Cristinzio: Rev. Environ. Sci. Biotechnol. 13, 387–427 (2014).
- 4) S. Mahomood, G. I. Paton and J. I. Prosser: Environ. Microbiol. 7, 1349–1360 (2005).
- 5) M. Lanthier, B. Tartakovsky, R. Villemur, G. DeLuca and S. R. Guiot: Appl. Environ. Microbiol. 68, 4035–4043 (2002).
- 6) D. L. Saber and R. L. Crawford: Appl. Environ. Microbiol. 50, 1512–1518 (1985).
- 7) M. Cai and L. Xun: J. Bacteriol. 184, 4672–4680 (2002).
- 8) M. A. Tiirola, H. Wang, L. Paullin and M. S. Kulomaa: Appl. Environ. Microbiol. 68, 4495–4501 (2002).
- 9) K. T. Leung, S. Campbell, Y. Gan, D. C. White, H. Lee and J. T. Trevors: FEMS Microbiol. Lett. 173, 247–253 (1999).
- 10) C. S. Orser, C. C. Lange, L. Xun, T. C. Zahrt and B. J. Schneider: J. Bacteriol. 175, 411–416 (1993).
- 11) L. Xun: J. Bacteriol. 178, 2645–2649 (1996).
- 12) J. H. A. Apajalathi and M. S. Salkinoja-Salonen: J. Bacteriol. 169, 5125–5130 (1987).
- 13) K. Takagi, A. Iwasaki, I. Kamei, K. Satsuma, Y. Yoshioka and N. Harada: Appl. Environ. Microbiol. 75, 4452–4458 (2009).
- 14) K. Ito, K. Takagi, A. Iwasaki, N. Tanaka, Y. Kanesaki, F. Martin-Laurent and S. Igimi: Appl. Environ. Microbiol. 83, e00824-17 (2017).
- 15) J. W. Hancock, C. E. Morrell and D. Rhum: Tetrahedron Lett. 3, 987–988 (1962).
- 16) S. Canaan, G. Sulzenbacher, V. Roig-Zamboni, L. Scapuccini-Calvo, F. Frassinetti, D. Maurin, C. Cambillau and Y. Bourne: FEBS Lett. 579, 215–221 (2005).
- 17) J. S. Karns, J. J. Kilbane, S. Duttagupta and A. M. Chakrabarty: Appl. Environ. Microbiol. 46, 1176–1181 (1983).
- 18) B. N. Webb, J. W. Ballinger, E. Kim, S. M. Belchik, K. S. Lam, B. Youn, M. S. Nissen, L. Xun and C. Kang: J. Biol. Chem. 285, 2014–2027 (2010).
- 19) M. Beaulieu, V. Bécaert, L. Deschènes and R. Villemur: Microb. Ecol. 40, 345–356 (2000).
- 20) T. Verma and N. Singh: J. Basic Microbiol. 53, 277–290 (2013).
- 21) S. K. Karn, S. K. Chakrabarti and M. S. Reddy: Biodegradation 22, 63–69 (2011).
- 22) J. H. A. Apajalahti, P. Kärpänoja and M. S. Salkinoja-Salonen: Int. J. Syst. Bacteriol. 36, 246–251 (1986).
- 23) R. Chandra, A. Raj, H. J. Purohit and A. Kapley: Chemosphere 67, 839–846 (2007).
- 24) J. S. Uotila, M. S. Salkinoja-Salonen and J. H. A. Apajalahti: Biodegradation 2, 25–31 (1991).
- 25) M. R. Gisi and L. Xun: J. Bacteriol. 185, 2786–2792 (2003).
- 26) S. Kremer, O. Sterner and H. Anke: Z. Naturforsch. C Bio. Sci. 47c, 561–566 (1992).
- 27) Y. Iimura, P. Hartikainen and K. Tatsumi: Appl. Microbiol. Biotechnol. 45, 434–439 (1996).
- 28) M. A. Prieto and J. L. García: J. Biol. Chem. 269, 22823–22829 (1994).
- 29) L. L. Perry and G. J. Zylstra: J. Bacteriol. 189, 7563–7572 (2007).
- 30) J. Min, J. J. Zhang and N. Y. Zhou: Appl. Environ. Microbiol. 82, 714–723 (2016).
- 31) T. M. Louie, C. M. Webster and L. Xun: J. Bacteriol. 184, 3492–3500 (2002).
- 32) C. W. Chu, B. Liu, N. Li, S. G. Yao, D. Cheng, J. D. Zhao, J. G. Qiu, X. Yan, Q. He and J. He: Appl. Environ. Microbiol. 83, e01490-17 (2017).
- 33) M. G. Cheng, Q. Meng, Y. J. Yang, C. W. Chu, Q. Chen, Y. Li, D. Cheng, Q. Hong, X. Yan and J. He: Appl. Environ. Microbiol. 83, e03241-16 (2017).
- 34) Y. Ohtsubo, Y. Nagata, K. Kimbara, M. Takagi and A. Ohta: Gene 256, 223–228 (2000).
- 35) J. R. van der Meer, W. M. de Vos, S. Harayama and A. J. Zehnder: Microbiol. Mol. Biol. Rev. 56, 677–694 (1992).
- 36) M. A. Schell: Gene 36, 301–309 (1985).
- 37) T. T. M. Pham, N. J. P. Rodriguez, M. Hijri and M. Sylvestre: PLoS One 10, e0126033 (2015).
- 38) E. S. Golbert and D. E. Crowley: Appl. Microbiol. Biotechnol. 50, 489–494 (1998).
- 39) A. C. Singer, E. S. Gilbert, E. Luepromchai and D. E. Crowley: Appl. Microbiol. Biotechnol. 54, 838–843 (2000).
- 40) A. Ferrandez, J. L. Garcia and E. Diaz: J. Bacteriol. 179, 2573–2581 (1997).
- 41) M. Teramoto, S. Harayama and K. Watanabe: J. Bacteriol. 183, 4227–4234 (2001).
- 42) H. Arai, S. Akahira, T. Ohishi and T. Kudo: Mol. Microbiol. 33, 1132–1140 (1999).
- 43) Y. Ohtsubo, M. Delawary, K. Kimbara, M. Takagi, A. Ohta and Y. Nagata: J. Biol. Chem. 276, 36146–36154 (2001).