Technical Reports
Proficiency testing by the National Metrology Institute of Japan for quantification of pesticide residues in grain samples from 2012 to 2018
2019 Volume 44 Issue 3 Pages 192-199

Details
2019 Volume 44 Issue 3 Pages 192-199
From 2012 to 2018, proficiency testings (PTs) were carried out to support the analytical skill development of participants. Grains were sprayed with various target pesticides and used as material samples for PTs. It was found that 27–56% and 10–43% of participants used the Japanese official multiresidue method and a solid-phase extraction technique with the Quick, Easy, Cheap, Effective, Rugged, and Safe (modified QuEChERS, known as “STQ” in Japan) method, respectively. Reported results were evaluated using two types of z-scores: one was based on consensus values calculated from the analytical results reported by the participants, and the other was based on values obtained by the National Metrology Institute of Japan (NMIJ). Acceptable z-scores based on the consensus values and NMIJ reference values were achieved by 78–95% and 67–94% of the participants, respectively. Many laboratories improved their z-scores by continuing participation in our PT.
It is important to analyze the pesticides in foods to monitor contamination and to investigate the relationship between exposure and health risks. The quality of analytical results can be evaluated effectively using proficiency testing (PT), which is also useful for improving measurement quality and resolving analytical problems.1–3) PT is recommended for testing and calibration laboratories in the International Standards Organization (ISO)/International Electrotechnical Commission (IEC) 17025: 2005,4) and the Guidelines of Codex Alimentarius (CAC/GL-27)5) require laboratories involved in the import and export control of foods to participate in appropriate PT.
Some PT for the analysis of pesticide residues in food has been carried out worldwide, and many Japanese laboratories have participated, especially in PT held by the Hatano Research Institute6) and the Food Analysis Performance Assessment Scheme (FAPAS) of the Food and Environment Research Agency.7) The National Metrology Institute of Japan (NMIJ) has been organizing PT since 2012 for the quantification of pesticide residues in food.1,8–10) The NMIJ PT has been carried out seven times so far, and Table 1 summarizes these PT sessions. These target pesticides described in Table 1 were selected because they are widely used in Japan and most of their stabilities have been confirmed.11–14) The grains, such as brown rice, wheat, and soybean, were selected as food matrices because little other PT has been performed by using grains, despite the fact that a large amount of grain is consumed in the world. Our PT program has three advantages9): 1. As test samples contain the target pesticides, the method performances, including extraction efficiency, can be evaluated accurately relative to the pesticide-spiked samples used in many other PT programs. 2. Performance is evaluated using two types of z-scores, one based on consensus values calculated from the analytical results reported by participants and one based on reference values obtained by the NMIJ.1,8,10) 3. A follow-up lecture is held for information exchange about PT results, quality control, the analytical method, and so on.
| Survey years | Matrices | Target pesticides | The total number of participants | The number of participants (for each pesticide) | MRLs (mg/kg)a) | Contained concentrations (mg/kg) |
|---|---|---|---|---|---|---|
| 2012 | Soybean | Chlorpyrifos | 43 | 39 | 0.3 | 0.0116 |
| Diazinon | 39 | 0.1 | 0.0218 | |||
| Fenitrothion | 40 | 0.2 | 0.0879 | |||
| Permethrin | 37 | 0.05 | 0.0199 | |||
| 2013 | Brown rice | Etofenprox | 58 | 52 | 0.5 | 0.142 |
| Fenitrothion | 56 | 0.2 | 0.158 | |||
| Isoprothiolane | 52 | 10 | 1.01 | |||
| 2014 | Husked wheat | Diazinon | 72 | 70 | 0.1 | 0.0660 |
| Etofenprox | 64 | 0.5 | 0.123 | |||
| Fenitrothion | 68 | 10 | 0.284 | |||
| Malathion | 69 | 10 | 0.0513 | |||
| 2015 | Brown rice | Etofenprox | 86 | 74 | 0.5 | 0.236 |
| Fenitrothion | 82 | 0.2 | 0.0986 | |||
| Thiamethoxam | 55 | 0.3 | 0.142 | |||
| 2016 | Soybean | Chlorpyrifos | 89 | 86 | 0.3 | 0.0316 |
| Fenitrothion | 86 | 0.2 | 0.141 | |||
| 2017 | Brown rice | Etofenprox | 33 | 33 | 0.5 | 0.163 |
| Fenitrothion | 33 | 0.2 | 0.129 | |||
| Isoprothiolane | 30 | 10 | 1.22 | |||
| 2018 | Husked wheat | Etofenprox | 38 | 36 | 0.5 | 0.273 |
| Fenitrothion | 37 | 10 | 0.618 | |||
| Malathion | 36 | 10 | 0.146 |
a) MRLs=maximum residue limits, which is stipulated in a Positive List System for Agricultural Chemical Residues in Foods introduced in May 2006 in Japan; The contained concentrations were obtained by NMIJ analysis.
In this technical report, an overview of the NMIJ PT results is given, specifically, the availability of test samples, comparisons of consensus and NMIJ reference values, factors potentially influencing the analytical results, and the effects of participation in this PT program.
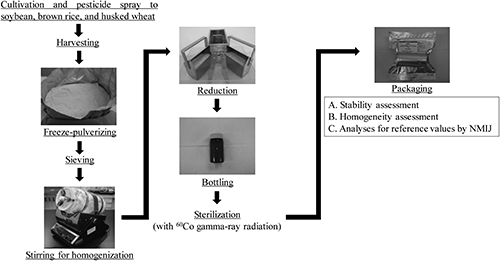
The raw grain materials (soybean, brown rice, and husked wheat) used for PT samples were grown and sprayed with various target pesticides (the conditions of pesticide spraying are shown in the supplemental information). Only fenitrothion was included in all PT samples, so as to observe the changes in the analytical results of participants. After harvesting, the samples were freeze-pulverized, homogenized, placed into clean glass bottles, and sterilized with 60Co γ-radiation (15 kGy) (Fig. 1). Until analysis, samples were stored in the dark at a temperature of about −30°C. Homogeneity was evaluated in accordance with ISO Guide 3515) (Fig. 1, A) in 10 bottles randomly selected from a total set of 80–288 bottles; two subsamples were taken to quantify the target pesticides. The stability of the target pesticides was assessed before and after the test samples were delivered to the participants (Fig. 1, B). Test samples were sent by refrigerated car to each participant, and a laboratory code number and information about sample handling were delivered at the same time as a cover letter. Each participant also electronically received a report form prepared by the NMIJ, and completed result reports had to be submitted electronically to the NMIJ.
Many Japanese testing laboratories (Table 1), including food manufacturers, public research organizations, and analytical instrument companies, have participated in our PT. The number of target pesticides for the analysis could be selected by participants; that is, even one target pesticide was allowable. The person in charge of pesticide analysis in each laboratory varied in years of experience, viz. from a few months after joining the laboratory to more than ten years.
3. Analytical methods used by participantsParticipants were requested to analyze with the method of their choice, and they analyzed target pesticides by any of the following methods: the Japanese official multiresidue method16); a solid-phase extraction technique with the Quick, Easy, Cheap, Effective, Rugged, and Safe (modified QuEChERS, known as “STQ” in Japan) method17); QuEChERS18); supercritical fluid extraction (SFE), the Japanese official group and single (for a specific group or pesticide)16); or an original method developed by the participants.
4. Analysis by the NMIJAnalyses were carried out based on a modified Japanese official method for providing the reference values by the NMIJ (Fig. 1, C). The details of the procedure have been described in previous papers,1,16) thus this paper gives only brief descriptions as follows: the homogenization method (in acetonitrile) for extraction, the solid-phase extraction (SPE), such as an octadecylsilanized silica gel and graphite carbon/aminopropylsilanized silica gel layered cartridge for the clean-up process, and the gas or liquid chromatograph with mass spectrometer (GC/MS or LC/MS) for measurement were used for the analysis.1) Further, the NMIJ analyzed samples using isotope dilution mass spectrometry (IDMS), which is a potential primary measurement method.19–22)
5. Statistical analysis for the calculation of z-scoresThe analytical performances were evaluated using z-scores. The z-score was calculated using Eq. 123,24):
 | (1) |
where xi and X represent the result reported by each participant and the consensus value calculated from the participants’ results, respectively, and NIQR represents a normalized interquartile range: 0.7413×(quartile 3–quartile 1).25) This evaluation method based on the consensus value calculated from participants’ results is used in many PT programs.
The z-score based on the NMIJ reference value (zNMIJ) was calculated using Eq. 21,8–10):
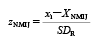 | (2) |
where XNMIJ represents the NMIJ reference value, and SDR represents between-laboratory precision calculated using a modified Horwitz equation26) and XNMIJ. The results of each z-score were interpreted as follows23,24):
A recovery test is necessary to evaluate analytical methods, which is typically done by adding compounds to (“spiking”) matrix samples, such as blank food. However, solute–matrix interactions of the native pesticides in food samples may render this approach unsuitable. That is, the recovery yields of spiked pesticides may be satisfactory, but native pesticides contained in the sample may have failed to be extracted adequately. Using samples containing the target pesticides as prepared above allows a necessary examination of the analytical method, including the extraction efficiency.
Although it is difficult to prepare the exact desired concentration due to the influence of the weather, the target pesticides were sprayed to be the maximum residue limits (MRLs) stipulated in the Positive List System for Agricultural Chemical Residues in Foods introduced in May 2006 in Japan.16) Comparisons of the MRL concentrations16) with the contained concentration analyzed by the NMIJ for each PT are shown in Table 1. Based on these results, it is considered that our samples were useful for PT, since most of the contained concentrations were ca. 2/3–1/10 of the MRLs. With regard to sample homogeneity, no statistically significant differences in pesticide concentrations between bottles were observed for any PT samples.1,8–10) For every PT, the results of the stability assessment indicated that the differences in concentrations before and after distribution of the samples to participants were not significant.1,8–10) Our samples were beneficial for participants wishing to evaluate their method performance, including extraction efficiency.
2. Comparison of consensus and NMIJ reference valuesTo enhance the reliability of NMIJ analytical data, we participate in Comité Consultatif pour la Quantité de Matière (CCQM) comparisons (to assess the analytical capabilities of National Metrology Institutes) and domestic proficiency tests. From the results of these tests, we proved the accuracy of our analytical data for the analysis of various pesticides, such as organophosphorus and pyrethroid in foods, and ensured international conformity (for example, one of the results is shown in a previous report27)).
The analytical results of consensus values calculated from participant results and NMIJ reference values are compared in Table 2 for each PT. Based on the ratio of NMIJ values to consensus values, the NMIJ values were up to about 30% greater than the corresponding consensus values for most pesticides. This can be mainly attributed to the different quantification method used.1,8–10) Most participants used an external or internal standard method to determine the concentration values, and the recovery yields of the target compounds will influence the results if not adequately corrected for. This is distinct from the IDMS method used by the NMIJ.1,8–10) Compared with external or internal standard methods, IDMS generally delivers greater accuracy and precision.28) Multiple factors, such as matrix effects and water-soaking time, can also be considered reasons for the difference between values. The uncertainties for NMIJ values were significantly smaller than the NIQR, and this result indicates that the NMIJ can analyze target pesticides more precisely than the participants.
| Survey years | Matrices | Target pesticides | Reference values (mg/kg)a) | Expanded uncertainties (mg/kg) | Consensus values (mg/kg)b) | NIQR (mg/kg)c) | Reference values/Consensus values |
|---|---|---|---|---|---|---|---|
| 2012 | Soybean | Chlorpyrifos | 0.0116 | 0.0016 | 0.0100 | 0.0029 | 1.2 |
| Diazinon | 0.0218 | 0.0014 | 0.0203 | 0.0060 | 1.1 | ||
| Fenitrothion | 0.0879 | 0.0116 | 0.0807 | 0.0213 | 1.1 | ||
| Permethrin | 0.0199 | 0.0040 | 0.0181 | 0.0060 | 1.1 | ||
| 2013 | Brown rice | Etofenprox | 0.142 | 0.009 | 0.132 | 0.021 | 1.1 |
| Fenitrothion | 0.158 | 0.004 | 0.154 | 0.029 | 1.0 | ||
| Isoprothiolane | 1.01 | 0.05 | 0.914 | 0.179 | 1.1 | ||
| 2014 | Husked wheat | Diazinon | 0.0660 | 0.0015 | 0.0570 | 0.0133 | 1.2 |
| Etofenprox | 0.123 | 0.0047 | 0.110 | 0.0200 | 1.1 | ||
| Fenitrothion | 0.284 | 0.010 | 0.249 | 0.0552 | 1.1 | ||
| Malathion | 0.0513 | 0.0036 | 0.0394 | 0.0121 | 1.3 | ||
| 2015 | Brown rice | Etofenprox | 0.236 | 0.008 | 0.204 | 0.045 | 1.2 |
| Fenitrothion | 0.0986 | 0.0034 | 0.101 | 0.026 | 1.0 | ||
| Thiamethoxam | 0.142 | 0.007 | 0.133 | 0.023 | 1.1 | ||
| 2016 | Soybean | Chlorpyrifos | 0.0316 | 0.0008 | 0.0236 | 0.0044 | 1.3 |
| Fenitrothion | 0.141 | 0.006 | 0.126 | 0.027 | 1.1 | ||
| 2017 | Brown rice | Etofenprox | 0.163 | 0.004 | 0.140 | 0.024 | 1.2 |
| Fenitrothion | 0.129 | 0.004 | 0.104 | 0.019 | 1.2 | ||
| Isoprothiolane | 1.22 | 0.047 | 1.10 | 0.220 | 1.1 | ||
| 2018 | Husked wheat | Etofenprox | 0.273 | 0.011 | 0.229 | 0.037 | 1.2 |
| Fenitrothion | 0.618 | 0.021 | 0.529 | 0.113 | 1.2 | ||
| Malathion | 0.146 | 0.010 | 0.114 | 0.040 | 1.3 |
a) The reference values were obtained by NMIJ. b) The consensus values were calculated from the analytical results reported by participants. c) NIQR=normalized interquartile range
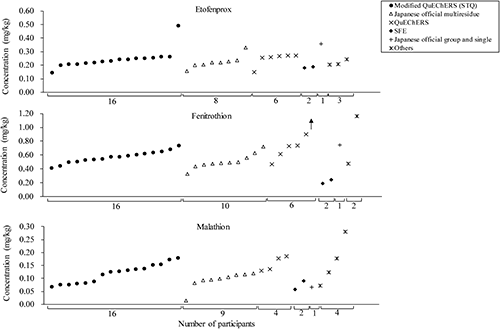
On the result forms, participants had to report not only the obtained results but also answers to the questions that may affect the analytical results, such as years of experience in pesticide residue analysis, information about the calibration standard (including whether it was with or without matrix matching), analytical methods and conditions, and internal quality control method. There were no significant differences among these factors and the concentrations reported by participants, except for the concentrations of fenitrothion obtained by supercritical fluid extraction (SFE) in the 2018 PT, as shown in Fig. 2. It is difficult to discuss this result because few participants used SFE. However, if the same trends are observed in future PT sessions, the accuracy of SFE method should be studied. There was no clear explanation for the highest concentration observed in the results for etofenprox using modified QuEChERS (STQ).
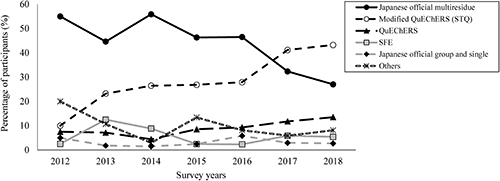
The changes in the percentage of users of extraction and clean-up methods for fenitrothion are shown in Fig. 3 as an example. Many of the participants used the Japanese official multiresidue or modified QuEChERS (STQ) method, and in recent years, modified QuEChERS (STQ) users have increased because this method uses a smaller volume of solvent, the concentration process by an evaporator is not necessary, and quick analysis is possible.1,9) As described above, there were no significant differences among the reported values obtained with different types of analytical methods except with SFE in the 2018 PT. However, to provide a more accurate comparison of the method performances, it is necessary to evaluate the results of each method obtained by the same laboratory with use of the common reagents, apparatus, and GC/MS or LC/MS system.9) Therefore, as described in a previous study,9) we compared the analytical results obtained using the Japanese official multiresidue, modified QuEChERS (STQ), and QuEChERS methods with IDMS to accurately evaluate the performance of each method, and the results obtained by those methods for the analysis of etofenprox, fenitrothion, and thiamethoxam contained in the brown rice 2015 PT samples were comparable.
As described above, although statistical differences were not detected, matrix effects and the water-soaking process can affect the results, even if only a little.1) A matrix effect was observed in our measurement by GC/MS, and the differences for the results between matrix-matched and matrix-free calibrations were 0.3–9.1% even though IDMS was applied. As described in a previous study,29) it is necessary to use matrix-matched calibration solutions for accurate quantification of the pesticides in foods by GC/MS even if isotope-labeled pesticides are used. In our PT, 32–47% of participants did not consider matrix effects in their measurements. Further, since most participants used an external or internal standard method to determine the concentration values, the obtained results could be greatly affected by the matrix effects compared with IDMS. It is considered that a study of the matrix effects is required to obtain more reliable results. The water-soaking process is performed to enhance the extraction efficiency of pesticides having a lower log P (octanol–water partition coefficient) from food samples.10,30,31) In our PT, 7–21% of participants did not perform this process. In a previous study,31) for isoprothiolane in brown rice, there was a significant difference between the obtained concentrations with water-soaking and without water-soaking. On the other hand, it was suggested that the malathion contained in the husked wheat sample might be degraded during the water-soaking process.10) The water-soaking process is effective for extraction, although optimization of that condition is necessary.
4. Evaluation of participants’ analytical performances by z-scoresThe z-scores in 2018, calculated using Eq. 1 and 2, are illustrated in Fig. 4. The number of participants for each z-score category, that is, z≤|2|, |2|<z<|3|, and |3|≤z, is shown in Table 3. From these results, the percentage of participants with “questionable (|2|<z<|3|)” and “unsatisfactory (|3|≤z)” were calculated as follows: 0–25% (0–18% for z-score; 3–25% for zNMIJ-score) and 2–17% (3–17% for z-score; 2–13% for zNMIJ-score), respectively. For those whose results were questionable and unsatisfactory, the following problems were inferred from the reports submitted by participants (the details are also described in previous papers1,9)): (1) calculation errors; (2) an error in the unit conversion; (3) inappropriate calibration standard solutions; (4) quantification at a concentration lower than the quantification limit of one’s method; (5) insufficient removal of interferences in the clean-up process; (6) insufficient separation in the GC or LC measurement; (7) inadequate maintenance of measurement instruments, such as GC/MS or LC/MS/MS; and/or (8) insufficient method validation.

| Survey years | Matrices | Target pesticides | The number of participantsa) | |||||
|---|---|---|---|---|---|---|---|---|
| z≤|2| | |2|<z<|3| | |3|≤z | zNMIJ≤|2| | |2|<zNMIJ<|3| | |3|≤zNMIJ | |||
| 2012 | Soybean | Chlorpyrifos | 34 | 3 | 2 | 35 | 2 | 2 |
| Diazinon | 37 | 0 | 2 | 34 | 3 | 2 | ||
| Fenitrothion | 35 | 3 | 2 | 33 | 3 | 4 | ||
| Permethrin | 31 | 3 | 3 | 26 | 7 | 4 | ||
| 2013 | Brown rice | Etofenprox | 45 | 5 | 2 | 49 | 2 | 1 |
| Fenitrothion | 49 | 4 | 3 | 50 | 3 | 3 | ||
| Isoprothiolane | 46 | 4 | 2 | 41 | 7 | 4 | ||
| 2014 | Husked wheat | Diazinon | 61 | 5 | 4 | 61 | 5 | 4 |
| Etofenprox | 54 | 4 | 6 | 57 | 2 | 5 | ||
| Fenitrothion | 55 | 8 | 5 | 54 | 7 | 7 | ||
| Malathion | 57 | 7 | 5 | 55 | 7 | 7 | ||
| 2015 | Brown rice | Etofenprox | 61 | 7 | 6 | 63 | 4 | 7 |
| Fenitrothion | 73 | 2 | 7 | 70 | 4 | 8 | ||
| Thiamethoxam | 44 | 3 | 8 | 45 | 4 | 6 | ||
| 2016 | Soybean | Chlorpyrifos | 67 | 4 | 15 | 67 | 11 | 8 |
| Fenitrothion | 73 | 4 | 9 | 70 | 9 | 7 | ||
| 2017 | Brown rice | Etofenprox | 28 | 3 | 2 | 29 | 3 | 1 |
| Fenitrothion | 26 | 6 | 1 | 27 | 5 | 1 | ||
| Isoprothiolane | 26 | 1 | 3 | 23 | 3 | 4 | ||
| 2018 | Husked wheat | Etofenprox | 31 | 3 | 2 | 32 | 3 | 1 |
| Fenitrothion | 32 | 1 | 4 | 31 | 2 | 4 | ||
| Malathion | 33 | 2 | 1 | 24 | 9 | 3 | ||
a) The z-scores were based on the consensus values calculated from participant results; The zNMIJ-scores were based on the reference value provided by NMIJ.
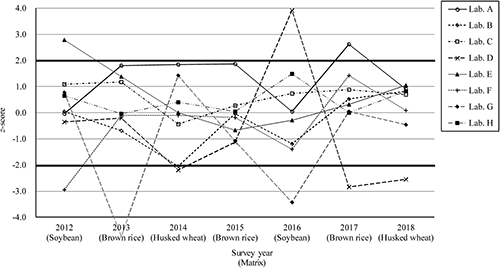
Fenitrothion has been selected as the target pesticide for all of our PT sessions to verify the improvement effect of z-scores. The history of z-scores for fenitrothion of eight laboratories who participated all of our PT sessions from 2012 to 2018 is summarized in Fig. 5. The variability of z-scores in each survey year was not dependent on the kind of matrix or concentration level of the target pesticides. The following were observed from the z-score changes for these eight laboratories: (1) all results were z≤|2| (Laboratories C and H); (2) z-scores were improved by reviewing the participant’s analytical process (Laboratories E and F); (3) although z-scores were continuously satisfactory, the results were questionable or unsatisfactory at a certain time—after that, z-scores were improved, as is the case for the participants of (2) (Laboratories A, B, and G); or (4) z-scores were not improved because that participant analyzed pesticides the same way each time (Laboratory D). From these results (and including the multiple participating laboratories not shown in Fig. 5), since the improvements in z-scores were observed by many laboratories, the effectiveness of our PT was shown.
As described above, performances are evaluated using two separate z-scores. Participants can evaluate their relative position against other participants using z-scores (based on the consensus values calculated from participant results); however, the participant’s z-score is influenced by the skill of the other participants. Thus, participants are advised to refer to the zNMIJ-score, which is based on the reference values with IDMS provided by the NMIJ.
The NMIJ carried out PT for pesticide residue analysis in grain samples from 2012 to 2018 with original test samples that allowed participants to evaluate their analytical skills based on two z-scores. Since our PT has been carried out over a long period of time, various discussions based on large quantities of compiled data became possible, such as the availability of test samples, the consideration of various factors that can influence the analytical results, and comparisons of analytical methods. In addition, the improvements in analytical results due to continuing participation can be observed in our programs, which indicates the effectiveness of our PT for obtaining reliable analytical results.