Technical Report
Ecological effect assessment by species sensitivity distribution for 38 pesticides with various modes of action
2021 Volume 46 Issue 4 Pages 366-372

Details
2021 Volume 46 Issue 4 Pages 366-372
Species sensitivity distributions (SSDs) of 38 pesticides with various modes of action were analyzed as a higher-tier ecological effect assessment based on collected acute toxicity data. Then the 5% hazardous concentrations (HC5) based on each SSD were calculated as the predicted no-effect concentrations for aquatic ecosystems. The differences between HC5 and registration criteria were small (within ten-fold) for 35 of the 38 pesticides. However, there were more than ten-fold differences for a fungicide and two herbicides. These results suggest that the current effect assessment scheme could underestimate the effect of such pesticides. This could be caused by differences in sensitivity of specific properties of the mode of action.

In Japan, pesticide registration criteria concerning toxicity to aquatic organisms are set by Japan’s Ministry of Environment under the Agricultural Chemicals Regulation Law.1) To determine the criteria, acute toxicity tests are conducted for fish (basically, Cyprinus carpio), daphnids (Daphnia magna), and algae (Raphidocelis subcapitata), and then the minimum value of the 50% effect concentration (EC50) or 50% lethal concentration (LC50) is divided by an uncertainty factor that considers the species sensitivity difference (default 10, but depends on the data number for fish and crustaceans, and 1 for algae). The Agricultural Chemicals Regulation Law was revised in 2018, and the method of assessing pesticide registration criteria was also revised.2) Toxicity tests using aquatic plants such as Lemna sp. in addition to algae will be introduced in the setting of revised criteria for herbicides. The uncertainty factor applied to the algal EC50 was changed from 1 to 10 by default, which is then reduced depending on the number of algal species tested. However, registration criteria for the new method have not yet been developed, and the present paper considered the existing criteria.
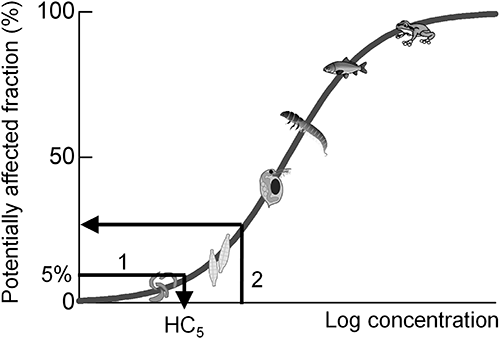
Species sensitivity to environmental contaminants varies markedly, and this variation can be described by the statistical distribution (often a log-normal distribution) estimated from sampled toxicity data (EC50s or LC50s) and visualized as a cumulative distribution function (called species sensitivity distribution, SSD; Fig. 1).3) The SSD has been used to determine hazardous concentrations for the protection of ecosystems and to reveal ecological risks. The 5th percentile of a distribution (called the 5% hazardous concentration, HC5) has been used in the US,4) Europe,5,6) and Australia7) for deriving threshold concentrations that protect most species in a community (Fig. 1, arrow 1). The HC5 values as threshold concentrations were validated by comparing them with the result of semi-field experiments (microcosm/mesocosm), which have provided more realistic ecological effects of pesticides.8–12) The SSD has also been used for quantitative ecological risk assessment of pesticides, such as diazinon13) and aldicarb14) insecticides, atrazine herbicide,15) and pesticide mixtures.16) Our previous studies8,17,18) also conducted probabilistic ecological risk assessment of several paddy insecticides and herbicides. The potentially affected fraction (PAF) is an index of the magnitude of ecological risk (Fig. 1, arrow 2). The PAF represents the effect on species diversity, which is a quantitative index of the biodiversity effect.
Nagai previously analyzed the SSDs of 68 pesticides commonly used in Japanese paddy fields based on collected acute toxicity data.19) The study showed that variation in species sensitivity greatly depends on the chemical mode of action (MoA). In addition, robust evidence of the relationship between sensitive species and herbicide MoA was found from the analysis of toxicity data for 120 herbicides.20) However, pesticides with only some MoAs have sufficient toxicity data to assess differences in species sensitivity. Thus, there are many pesticides with MoAs whose sensitivity differences have not yet been analyzed. The main objective of the present study is to analyze SSDs with various MoAs using newly collected toxicity data. For that purpose, the acute SSDs of 38 pesticides were analyzed, and then HC5 values and registration criteria were compared to check the validity of the registration criteria.
The SSDs for 38 pesticides (15 insecticides, 7 fungicides, and 16 herbicides) were analyzed (Tables 1–3). The MoAs (Tables 1–3) were derived from the Insecticide Resistance Action Committee,21) the Fungicide Resistance Action Committee,22) and the Herbicide Resistance Action Committee.23) The pesticide registration criteria concerning toxicity to aquatic organisms were derived from Japan’s Ministry of Environment1) (Tables 1–3). When registration criteria had not yet been developed, the equivalent values for comparison purposes were calculated based on toxicity values for the standard test species.
| Insecticides | MoAa) | Registration criteria (µg/L) | Arthropods | HC5 (µg/L) | HC50 (µg/L) | ||
|---|---|---|---|---|---|---|---|
| ln Mean | ln SD | n | |||||
| Methomyl | 1A | 1.5 | 4.47 | 2.08 | 18 | 2.7 (0.61–7.7) | 88 (39–200) |
| Acephate | 1B | 5500 | 11.10 | 1.52 | 11 | 5000 (920–14000) | 66000 (29000–150000) |
| Trichlorfon | 1B | 0.11 | 3.96 | 1.96 | 17 | 2.0 (0.35–6) | 53 (22–130) |
| Malathion | 1B | 0.3 | 2.92 | 2.65 | 31 | 0.23 (0.052–0.68) | 19 (8.2–42) |
| Methidathion | 1B | 0.11 | 4.03 | 1.96 | 9 | 2.0 (0.15–8.1) | 56 (17–190) |
| Flupyradifurone | 4D | 6.1 | 6.88 | 3.39 | 5 | 2.3 (0.00062–61) | 970 (38–25000) |
| Fenbutathin-oxide | 12B | 0.2 | 10.53 | 3.13 | 6 | 160 (0.35–2400) | 37000 (2800–490000) |
| BPPS | 12C | 1.3 | 8.50 | 2.95 | 8 | 31 (0.4–290) | 4900 (680–35000) |
| Chlorfenapyr | 13 | 0.7 | 1.96 | 1.15 | 8 | 0.99 (0.18–2.4) | 7.1 (3.3–15) |
| Bensultap | 14 | 20 | 6.05 | 2.81 | 7 | 3.2 (0.03–32) | 420 (53–3300) |
| Amitraz | 19 | 26 | 7.90 | 1.83 | 8 | 120 (8–470) | 2700 (800–9200) |
| Tolfenpyrad | 21 | 0.099 | 1.47 | 1.85 | 5 | 0.16 (0.0019–0.96) | 4.3 (0.75–25) |
| Indoxacarb | 22 | 60 | 4.94 | 1.56 | 6 | 9.1 (0.43–36) | 140 (39–500) |
| Spiromesifen | 23 | 9.2 | 5.22 | 0.71 | 5 | 52 (9.4–100) | 180 (94–360) |
| Cyenopyrafen | 25 | 0.29 | 3.93 | 1.77 | 5 | 2.2 (0.03–12) | 51 (9.4–270) |
a) IRAC20); 1A, 1B: acetylcholinesterase inhibitors; 4D: nicotinic acetylcholine receptor competitive modulators; 12B, 12C: inhibitors of mitochondrial ATP synthase; 13: uncouplers of oxidative phosphorylation via disruption of the proton gradient; 14: nicotinic acetylcholine receptor channel blockers; 19: octopamine receptor agonists; 21: mitochondrial complex I electron transport inhibitors; 22: voltage-dependent sodium channel blockers; 23: inhibitors of acetyl CoA carboxylase; 25: mitochondrial complex II electron transport inhibitors.
| Fungicides | MoAa) | Registration criteria (µg/L) | Fungi | HC5 (µg/L) | HC50 (µg/L) | ||
|---|---|---|---|---|---|---|---|
| ln Mean | ln SD | n | |||||
| Hydroxyisoxazole | A3 | 2800 | 8.57 | 3.51 | 5 | 10 (0.0021–300) | 5300 (190–150000) |
| Orysastrobin | C3 | 120 | 7.61 | 0.71 | 5 | 570 (100–1100) | 2000 (1000–4000) |
| Kasugamycin | D3 | 6600 | 9.25 | 1.11 | 5 | 1400 (99–4200) | 10000 (3600–30000) |
| Isoprothiolane | F2 | 920 | 9.65 | 1.15 | 5 | 2000 (120–6100) | 16000 (5200–46000) |
| Ipconazole | G1 | 150b) | 6.29 | 1.80 | 5 | 22 (0.28–120) | 540 (97–3000) |
| Tricyclazole | I1 | 2100 | 10.19 | 0.71 | 5 | 7500 (1300–15000) | 27000 (14000–53000) |
| Ferimzone | U | 620 | 8.55 | 0.76 | 5 | 1300 (220–2800) | 5200 (2500–11000) |
a) FRAC21); A3: DNA/RNA synthesis (proposed); C3: complex III, cytochrome bc1 (ubiquinol oxidase) at Qo site (cyt b gene); D3: protein synthesis (ribosome, initiation step); F2: phospholipid biosynthesis, methyltransferase; G1: C14-demethylase in sterol biosynthesis (erg11/cyp51); I1: reductase in melanin biosynthesis; U: unknown mode of action. b) Registration criteria have not yet been developed, therefore a calculated value based on the LC50 and EC50 for fish, crustacean, and algae (using default uncertainty factors) is shown.
| Herbicides | MoAa) | Registration criteria (µg/L) | Primary producers | HC5 (µg/L) | HC50 (µg/L) | ||
|---|---|---|---|---|---|---|---|
| ln Mean | ln SD | n | |||||
| Cyhalofop-butyl | 1 | 33 | 7.07 | 0.93 | 7 | 240 (50–500) | 1200 (600–2300) |
| Sethoxydim | 1 | 7200 | 10.38 | 0.88 | 10 | 7200 (2500–13000) | 32000 (19000–53000) |
| Flucetosulfuron | 2 | 7900 | 10.53 | 0.80 | 6 | 9200 (1900–19000) | 37000 (19000–72000) |
| Trifluralin | 3 | 24 | 3.65 | 1.19 | 9 | 5.1 (1.1–12) | 38 (18–80) |
| Pendimethalin | 3 | 14 | 5.62 | 2.13 | 11 | 7.5 (0.7–30) | 280 (87–880) |
| 2,4-D | 4 | 9800 | 10.28 | 2.67 | 15 | 330 (31–1500) | 29000 (8600–97000) |
| MCPA | 4 | 6100 | 10.11 | 1.61 | 13 | 1600 (330–4300) | 25000 (11000–54000) |
| Glyphosate | 9 | 6200 | 10.74 | 0.82 | 13 | 12000 (5200–19000) | 46000 (31000–69000) |
| Glufosinate | 10 | 10000 | 10.45 | 2.81 | 11 | 290 (13–1800) | 35000 (7400–160000) |
| Chloronitrofen | 14 | —b) | 4.57 | 2.19 | 7 | 2.2 (0.056–13) | 96 (19–480) |
| Asulam | 18 | 9000 | 9.85 | 1.64 | 11 | 1200 (190–3400) | 19000 (7700–46000) |
| Diquat | 22 | 13 | 3.95 | 1.98 | 10 | 1.8 (0.16–6.9) | 52 (16–160) |
| Chlorpropham | 23 | 370 | 7.96 | 1.49 | 15 | 230 (63–540) | 2900 (1500–5600) |
| Benzobicyclon | 27 | 34 | 6.38 | 0.10 | 6 | 500 (410–540) | 590 (550–640) |
| Dichlobenil | 29 | 150 | 7.44 | 2.29 | 12 | 36 (3.2–150) | 1700 (520–5600) |
| Oxaziclomefone | 0 | 830 | 7.94 | 1.01 | 6 | 480 (66–1200) | 2800 (1200–6500) |
a) HRAC22); 1: inhibition of acetyl CoA carboxylase; 2: inhibition of acetolactate synthase; 3: microtubule assembly inhibition; 4: auxin mimics; 9: inhibition of EPSP synthase; 10: inhibition of glutamine synthetase; 14: inhibition of protoporphyrinogen oxidase; 18: inhibition of dihydropteroate synthase; 22: photosystem-I-electron diversion; 23: inhibition of microtubule organization; 27: inhibition of 4-hydroxyphenyl-pyruvate-dioxygenase; 29: inhibition of cellulose synthesis; 0: unknown. b) Registration expired.
Information on the acute (defined as a test duration of 1–7 days and endpoint of growth rate for primary producers and immobility/mortality for animals) effect of pesticides was collected from open literature. The literature includes the Pesticide Handbook,24) Pesticide Manual,25) the assessment report of the pesticide registration criteria concerning toxicity to aquatic organisms by Japan’s Ministry of Environment,1) various risk assessment reports by national and international agencies, the ECOTOX database of the US Environmental Protection Agency (EPA), and other publicly accessible documents written in Japanese. Data collection from the ECOTOX database was limited when the original paper in scientific journals was available. The reliability of the information was categorized into four classes according to the Organization for Economic Cooperation and Development (OECD) Manual for the Assessment of Chemicals26): 1=reliable without restrictions, 2=reliable with restrictions, 3=not reliable, and 4=not assignable. The detailed method of classification was described in a previous paper.19) Collected acute toxicity data (EC50 and LC50) were entered into a database.
3. SSD analysisThe SSD analysis was conducted using the collected datasets on toxicity according to the method described by Nagai.19) Only data evaluated belonging to as reliability classes 1 or 2 were used for SSD analysis. The data for insecticides were separated into arthropods and other species, because arthropods are the most sensitive to insecticides among the taxonomic groups, and the SSD showed a clear separation of arthropods from other species.9) The data for herbicides were separated into primary producers and other species, because primary producers are the most sensitive to herbicides among the taxonomic groups and the SSD showed a clear separation of primary producers from others.10) The data for fungicides were separated into aquatic fungi (including fungus-like organisms) and other species, because aquatic fungi are generally the most sensitive to fungicides among the taxonomic groups.27) It should be noted that all species data were used for fungicide SSD analysis in a previous study,19) because the sensitivity difference among the taxonomic groups was not clear at that time.11) The minimum data requirement for SSD analysis in the present study was set to five genera28) for each most-sensitive taxonomic group. All data were reduced to genus-level data according to the US EPA guideline.4)
The genus-level dataset on the most-sensitive taxonomic group was fitted to a log-normal distribution using the maximum likelihood method.29) The maximum likelihood parameters of the distribution, logarithmic mean (referred as ln Mean) and logarithmic standard deviation (referred as ln SD), were obtained by fitting. The values of HC5 and the 50th percentile of SSD (HC50) were calculated (Fig. 1, arrow 1) as follows:
 |
where the Kp values are derived from a normal distribution table, for example, K5=−1.65 for HC5 and K50=0 for HC50. The 90% confidence intervals (from the 5th to the 95th percentiles) associated with HC5 and HC50 were calculated by the method of Aldenberg and Jaworska.30) In their method, Kp values can vary based on the noncentral t-distribution depending on the data number (n). For example, the 5th and 95th percentiles of HC5 can be calculated using K5 values of −4.20 and −0.82, respectively, when n=5.
The values of HC5 were compared with the registration criteria (Tables 1–3). In addition, the ecological effect level (described as the PAF) for the pesticide concentration equivalent to the registration criteria was calculated using each SSD and the registration criteria (Fig. 1, arrow 2).
The typical SSD curves for the insecticide malathion, the fungicide ferimzone, and the herbicide glufosinate are shown in Fig. 2. The SSDs showed a clear separation of sensitive (arthropods for malathion, aquatic fungi for ferimzone, and primary producers for glufosinate) and insensitive taxonomic groups. The results of SSD analysis of 38 pesticides are summarized in Tables 1–3. The sensitivity of each genus of freshwater aquatic organisms is listed in Supplemental Table S1, and each SSD curve is shown in Supplemental Fig. S1. The following numbers of genera used for SSD analysis indicate the reliability of SSD: 5–31 for insecticides, 5 for fungicides, and 6–15 for herbicides. The HC5 values indicate the predicted no-effect concentration, which were 0.16–5,000 µg/L for insecticides, 10–7,500 µg/L for fungicides, and 1.8–12,000 µg/L for herbicides. The HC50 values indicate the geometric mean of toxicities: 4.3–66,000 µg/L for insecticides, 540–27,000 µg/L for fungicides, and 38–46,000 µg/L for herbicides. The values of ln SD indicate the slopes of the SSD: 0.71–3.39 for insecticides, 0.71–3.51 for fungicides, and 0.10–2.81 for herbicides.

The HC5 values, which correspond to the predicted no-effect concentration for aquatic ecosystems, and pesticide registration criteria were compared (Fig. 3). In particular, the cases where the registration criteria were more than tenfold higher than the HC5 were focused, because such cases indicate substantial underestimation of toxicity in the registration criteria. The differences between them were small (tenfold or less) for 35 of the 38 pesticides. This suggests that the current registration criteria are an appropriate index of the threshold level for toxicity to aquatic ecosystems for such pesticides. However, the differences for the fungicide hydroxyisoxazole and two herbicides glufosinate and 2,4-D were more than tenfold. An aquatic fungus Rhizophydium, a cyanobacterium Pseudanabaena, and an aquatic vascular plant Myriophyllum were the most sensitive to hydroxyisoxazole, glufosinate, and 2,4-D, respectively (Supplemental Table S1). The differences in species sensitivity (described as ln SD in Tables 1–3) were large (more than 2.5) for these three pesticides. Ecological effect assessment of pesticides that have large ln SD values should be considered cautiously.

The ecological effect level (described as the PAF) under the registration criteria was calculated using each SSD and the registration criteria. The PAF values ranged from <0.1% to 42.8%, with a median of 4.8%, average of 10.9%, and standard deviation of 13.1%. Thus, half of the registration criteria corresponded to an effect level of <5% and the other half to an effect level of >5%, which is consistent with the previous analysis of 68 pesticides.19) This result indicates that the ecological effect levels under the registration criteria were not consistent among the pesticides.
The SSD approach can be applied to both developing registration criteria (Fig. 1, arrow 1) and the quantification of ecological risk (Fig. 1, arrow 2). First, the contribution of SSD analysis to the development of registration criteria (Fig. 1, arrow 1) is discussed. A previous study19) showed that the relationships between registration criteria and HC5 were specific to the MoA, and the differences for 18 of the 68 pesticides were more than tenfold. In particular, the registration criteria at that time were not appropriate for insecticides with specific MoAs (GABA-gated chloride channel blockers, nicotinic acetylcholine receptor competitive modulators, and nicotinic acetylcholine receptor allosteric modulators). This was attributed to the fact that aquatic insects are much more sensitive than D. magna to these insecticides. Then, the additional data requirement of acute toxicity to aquatic insect Chironomus was introduced to assess the effect of these insecticides in Japan.31)
An aquatic fungus Rhizophydium was the most sensitive to hydroxyisoxazole in the present study. Although pesticide regulations have yet to be based on ecological risk assessment using fungal toxicity data, this has been suggested as a challenge for the future. The guidance document for risk assessment of plant protection products for aquatic organisms in the European Union32) suggests that further research into potential effects on fungi is needed and that the selection of relevant species for which standardized ecotoxicity tests may be developed should be identified as a research need.
For herbicides which are less toxic to algae and duckweed Lemna such as 2,4-D, testing an additional aquatic vascular plant Myriophyllum is required for ecological risk assessment in the European Union.32) However, differences in species sensitivity among vascular plants have not yet been sufficiently investigated due to the lack of a method for testing a wide range of aquatic plant species. Therefore, we have recently developed a novel bioassay method for simultaneously determining the difference in species sensitivity of five species of vascular plants.33) The five species of vascular plants were shown to be more sensitive than algae and duckweed to herbicide 2,4-D. This economical and efficient bioassay would be useful for improving the development of registration criteria.
A cyanobacterium Pseudanabaena was the most sensitive to glufosinate in the present study. As part of the revised criteria in 2018, algal species (a green alga Desmodesmus, diatom Navicula, and cyanobacteria Synechococcus and Anabaena) can be optionally subjected to testing in addition to a standard algal species Raphidocelis. However, the cyanobacterium Synechococcus was not sensitive to glufosinate (Supplemental Table S1), and Pseudanabaena is generally more sensitive than Synechococcus.34) Therefore, Pseudanabaena is a potential cyanobacteria test species.
Next, quantification of the ecological risk of pesticides using SSD as the PAF (Fig. 1, arrow 2) is discussed. Monitoring the actual environmental concentration of pesticides and risk assessment as a post-registration study is important for risk management. Quantification of the ecological risk is a useful tool for risk management in addition to comparison between environmental concentration and registration criteria. A technical guidance document for SSD analysis with a Microsoft Excel worksheet for calculating the PAF (in Japanese only) was recently published.35) The SSD parameters for 68 pesticides are already provided in this worksheet, and the PAF can be calculated by selecting the pesticide name and inputting the environmental concentration (µg/L). Moreover, a cumulative ecological risk assessment tool (NIAES-CERAP) considering the mixture toxicity of multiple pesticides has also been published.36) These risk assessment tools make it easy to conduct quantitative ecological risk assessment.
One of the most important limitations of SSD application is the lack of sufficient toxicity data for SSD analysis. However, this study determined the SSD parameters of 38 pesticides covering pesticides with a wide range of MoAs. These SSD parameters will be available for ecological risk assessment tools35,36) in the future. Therefore, the future application of SSDs for ecological risk assessment and the management of pesticides is expected to increase.
This research was partly supported by the sponsored research “Technical development of aquatic ecological risk assessment of pesticides” by the Ministry of the Environment, Japan.
The online version of this article contains supplementary materials (Supplemental Table S1 and Fig. S1), which are available at http://www.jstage.jst.go.jp/browse/jpestics/.