Abstract
The uptake experiments with pesticides were performed to clarify differences among plant species, and the influence of growth stages and conditions on the uptake and translocation ability of pesticides. There were 2–10-fold differences among plant species in the root and shoot concentrations of each pesticide, and shoot concentrations of pesticides in Brassica rapa L. var. perviridis were relatively high. In addition, the changes in shoot concentrations with growth stage of B. rapa were affected by root system development. The influence of temperature on uptake and translocation ability differed for each pesticide, while uptake and translocation ability were high for short day lengths. This indicated that plant uptake and translocation of pesticides were affected by root system development and growth conditions such as temperature and day length, not only the relationships to the chemical’s properties and behavior of organic chemicals in the soil.
Introduction
In Japan, agricultural chemicals used for primary crops and those persisting in soil have been detected in succeeding crops at levels exceeding the maximum residue limits.1) Affected production areas can be forced to take emergency measures, such as self-imposed halts on shipments or extensive inspection of soils and crops. It is necessary to clarify the plant uptake of organic chemicals to prevent problems such as crop contamination.
The plant uptake of organic chemicals is generally explained by relationships to the chemical’s properties, especially those that determine the logarithm of the n-octanol–water partition coefficient (log KOW). In a hydroponic experiment, as hydrophobicity increased (log KOW increased), organic chemicals were concentrated in roots, while the relationship between translocation to shoots and log KOW produced a bell-shaped curve.2–5) Based on the relationship between chemicals’ log KOW and accumulation in roots or translocation to aboveground tissues via xylem, a number of plant uptake models for organic chemicals have been developed.6–11)
In addition, several studies of organic chemical uptake in soil have focused on relationships between plant concentrations and the behavior of organic chemicals in soil.12,13) Despite plant growth stage and conditions having important effects on plant physiological reactions, the influence of these on pesticide uptake has not been investigated. The purposes of our studies were to clarify differences among plant species, and the influence of different growth stages and growth conditions on the uptake and translocation ability of pesticides. Here, I review the results of our research.
1. Differential uptake and translocation of pesticides by several plant species
14)There are numerous screening data concerning the concentration in soils and residue in crops or vegetables of pesticides applied to soils. However, these screenings focus on pesticide residues in edible parts, and so the parts with concentrations measured differ, in some cases in fruit and in other cases leaves and stems. Moreover, in these screenings, the cultivation periods differ with the different growing speeds of crops or vegetables, so the periods of pesticide uptake from soils by plants also differ. In our study, we investigated the differences in pesticide concentrations in root and shoot using 16 plant species under the same growing conditions. The tested plants were grown for the same period (21 days) in the soil to which was applied the 10 tested pesticides which have wide log KOW level (Table 1), and the concentrations in roots and shoots were compared.
Table 1. Physicochemical properties of pesticides.
| Chemicals |
Pesticide type |
Substance group |
Octanol–water partition coefficient (log KOW) |
|
a)
|
b)
|
c)
|
| Dinotefuran |
Insecticide |
Neonicotinoid |
−0.549 |
−0.549 |
−0.549 |
| Imidacloprid |
Insecticide Veterinary substance |
Neonicotinoid |
0.57 |
0.57 |
0.57 |
| Clothianidin |
Insecticide |
Neonicotinoid |
0.7 |
0.7 |
0.905 |
| Thiacloprid |
Insecticide Molluscicide |
Neonicotinoid |
0.74 |
1.26 |
1.26 |
| Fosthiazate |
Insecticide Nematicide |
Organophosphate |
1.68 |
1.68 |
1.68 |
| Metalaxyl |
Fungicide |
Phenylamide |
1.75 |
1.75 |
1.65 |
| Fenobucarb |
Insecticide |
Carbamate |
2.67 |
2.67 |
2.78 |
| Procymidone |
Fungicide |
Dicarboximide |
3.14 |
3.30 |
3.3 |
| Flutolanil |
Fungicide |
Phenylbenzamide |
3.17 |
3.77 |
3.17 |
| Tolclofos-methyl |
Fungicide |
Chlorophenyl |
4.56 |
4.56 |
4.56 |
a) Values obtained from The Pesticide Manual (16th ed.).15) b) Values obtained from The 2011 Pesticide Handbook.16) c) Values obtained from the Footprint Pesticide Database of IUPAC.17) Reprinted from Ref. 14.
As the results, there were 2–10-fold differences among plant species in the root and shoot concentrations of each pesticide (Table 2). Notably, the shoot concentrations of leafy vegetables such as Brassica rapa L. var. perviridis and Chrysanthemum coronarium L. were higher than those in the other plant species. Therefore, was used B. rapa as a test plant to compare the influence of growth stage and growth conditions on the uptake and translocation abilities of four of the pesticides with relatively high values of log KOW: fenobucarb, procymidone, flutolanil, and tolclofos-methyl.
Table 2. Concentration of pesticides in shoots and roots for each plant.
| Plants |
Concentration (mg/kg-DW) |
| Dinotefuran |
Imidacloprid |
Clothianidin |
Thiacloprid |
Fosthiazate |
Metalaxyl |
Fenobucarb |
Procymidone |
Flutolanil |
Tolclofos-methyl |
| Shoot |
| Hordeum distichon L. |
5.03 def |
0.32 cde |
0.86 ef |
0.11 abc |
0.47 ab |
1.04 abc |
0.24 a |
2.11 f |
0.15 a |
<0.02 |
| Zea mays L. |
4.06 cde |
0.21 abc |
0.31 abc |
0.13 bcd |
2.90 bc |
2.37 c |
0.95 a |
1.66 ef |
0.57 b |
<0.02 |
| Glycine max Merrill |
4.76 def |
0.36 de |
0.05 a |
0.20 de |
1.55 abc |
2.41 c |
0.58 a |
1.85 ef |
<0.02 |
<0.02 |
| Phaseolus vulgaris L. |
0.66 a |
<0.02a) |
<0.02 |
<0.02 |
0.62 ab |
0.13 a |
0.14 a |
0.26 a |
<0.02 |
<0.02 |
| Brassica oleracea L. var. capitata |
9.52 g |
0.54 fg |
0.81 def |
0.47 g |
3.15 c |
2.47 c |
0.24 a |
2.09 f |
0.05 a |
<0.02 |
| Brassica rapa L. var. peruviridis |
6.22 f |
0.38 de |
0.88 f |
0.27 e |
1.47 abc |
0.87 ab |
0.15 a |
2.20 f |
<0.02 |
<0.02 |
| Chrysanthemum coronarium L. |
8.53 g |
1.10 h |
1.35 g |
0.68 f |
12.70 e |
9.29 d |
4.80 b |
0.98 cd |
0.86 c |
0.06 b |
| Lactuca sativa L. |
0.67 a |
0.14 a |
0.07 a |
0.05 ab |
0.12 a |
0.26 ab |
<0.02 |
0.35 ab |
0.04 a |
<0.02 |
| Allium wakegi Araki |
4.23 de |
0.29 bcd |
0.52 cd |
0.02 a |
1.02 abc |
0.10 a |
0.57 a |
2.07 f |
0.41 b |
<0.02 |
| Apium graveolens L. var. dulce |
5.65 ef |
0.27 abcd |
0.55 cd |
0.11 abc |
7.69 d |
1.09 abc |
5.74 b |
0.20 a |
<0.02 |
0.04 ab |
| Solanum lycopersicum Mill. |
5.39 ef |
0.60 g |
0.57 cde |
0.15 cd |
0.99 abc |
0.04 a |
0.54 a |
1.82 ef |
0.12 a |
<0.02 |
| Capsicum grossum L. |
3.44 bcd |
0.44 ef |
0.22 ab |
<0.02 |
0.45 ab |
0.20 a |
0.08 a |
1.26 de |
0.04 a |
<0.02 |
| Cucumis sativus L. |
2.58 bc |
0.24 abcd |
0.28 abc |
0.09 abc |
0.77 ab |
0.93 ab |
0.37 a |
1.62 ef |
<0.02 |
0.03 a |
| Cucurbita maxima Duch. |
2.40 b |
0.24 abcd |
0.20 a |
0.12 bcd |
2.30 abc |
1.36 abc |
1.24 a |
0.89 bcd |
<0.02 |
<0.02 |
| Spinacia oleracea L. |
6.11 f |
0.56 fg |
1.54 g |
<0.02 |
0.14 a |
0.10 a |
0.05 a |
0.42 abc |
0.12 a |
<0.02 |
| Beta vulgaris L. var. cicla |
5.04 def |
0.17 ab |
0.49 bc |
0.03 a |
1.56 abc |
1.68 bc |
0.15 a |
0.90 bcd |
0.17 a |
<0.02 |
| Root |
| Hordeum distichon L. |
0.16 abc |
0.03 a |
0.03 a |
0.03 a |
0.07 abc |
0.06 a |
0.15 ab |
0.24 ab |
0.21 ab |
0.04 a |
| Zea mays L. |
0.39 d |
0.07 bc |
0.05 ab |
0.07 abcd |
0.20 bcde |
0.20 cd |
0.28 abc |
0.53 ab |
0.33 ab |
0.40 a |
| Glycine max Merrill |
0.16 abc |
0.20 d |
0.13 c |
0.33 e |
0.17 de |
0.39 f |
0.39 abc |
1.37 abc |
0.21 ab |
0.70 a |
| Phaseolus vulgaris L. |
0.29 cd |
0.08 bc |
0.06 ab |
0.12 d |
0.12 abcd |
0.17 bc |
0.15 ab |
0.63 abc |
0.05 a |
0.34 a |
| Brassica oleracea L. var. capitata |
0.10 ab |
0.06 abc |
0.04 a |
0.08 bcd |
0.06 a |
0.07 a |
0.17 ab |
0.46 ab |
0.26 ab |
0.57 a |
| Brassica rapa L. var. peruviridis |
0.11 ab |
0.05 abc |
0.04 a |
0.07 abc |
0.08 abc |
0.11 ab |
0.12 a |
0.39 ab |
0.26 ab |
0.31 a |
| Chrysanthemum coronarium L. |
0.06 ab |
0.07 bc |
0.05 ab |
0.09 cd |
0.26 ef |
0.07 a |
8.96 e |
14.08 e |
4.19 d |
34.22 b |
| Lactuca sativa L. |
0.12 ab |
0.08 c |
0.03 a |
0.04 ab |
0.07 abc |
0.09 a |
0.04 a |
0.66 abc |
0.39 ab |
0.66 a |
| Allium wakegi Araki |
1.24 e |
0.17 d |
0.15 c |
0.09 bcd |
0.32 f |
0.27 de |
1.59 abcd |
1.78 abc |
0.85 bc |
0.74 a |
| Apium graveolens L. var. dulce |
0.41 d |
<0.02 |
<0.02 |
<0.02 |
0.18 cde |
0.07 a |
2.05 d |
5.01 d |
0.41 ab |
3.58 a |
| Solanum lycopersicum Mill. |
0.27 cd |
0.07 bc |
0.06 ab |
0.08 bcd |
0.11 abcd |
0.12 ab |
0.10 a |
0.55 abc |
0.39 ab |
0.42 a |
| Capsicum grossum L. |
0.27 cd |
0.04 ab |
0.03 a |
0.03 a |
0.06 ab |
0.06 a |
0.16 ab |
0.26 ab |
0.18 ab |
0.20 a |
| Cucumis sativus L. |
0.05 a |
0.06 abc |
0.03 a |
0.08 abcd |
0.32 f |
0.35 ef |
1.76 bcd |
2.48 c |
1.41 c |
2.34 a |
| Cucurbita maxima Duch. |
0.20 bc |
0.06 abc |
0.06 ab |
0.08 abcd |
0.59 g |
0.50 g |
1.86 cd |
2.17 bc |
0.94 bc |
2.02 a |
| Spinacia oleracea L. |
0.07 ab |
0.08 c |
0.08 b |
0.07 abc |
<0.02 |
0.10 ab |
0.09 a |
0.73 abc |
0.20 ab |
0.16 a |
| Beta vulgaris L. var. cicla |
0.07 ab |
0.06 abc |
0.05 ab |
0.05 abc |
0.04 a |
0.06 a |
0.11 a |
0.21 a |
0.04 a |
0.11 a |
Data were compared using one-way ANOVA followed by Tukey’s multiple comparison test (p<0.05). Within a column, means followed by the same letter are not significantly different. a) Under the detection limit. Reprinted from Ref. 14.
2. Relationship of growth stage of
B. rapa and pesticide-uptake ability
18)The relationships between log KOW and the ability of uptake or translocation were obtained via hydroponic experiments. The experiments had a short exposure time for organic chemicals and ignore the influence of plant growth, such as increased biomass. In addition, hydroponic experiments using precultured plants to take up organic chemicals did not show the influence of plant growth stage on the uptake and translocation ability of organic chemicals. When considering cropping systems, for example B. rapa which requires 30–60 days from sowing to harvesting, plants take up pesticides for a longer period than in hydroponic experiments. It is also possible that the uptake and translocation ability of pesticides are affected by plant growth and pesticide behavior in soil. The relationships between plant growth stage and pesticide-uptake ability were investigated via B. rapa cultivation in soil to which four pesticides (fenobucarb, procymidone, flutolanil, and tolclofos-methyl) were added.
2.1. Relationships between growth stage and pesticide concentrations in root and shoot
In the experiment, plant growth conditions remained the same from sowing onward, and the plant growth stage used was the vegetative stage from sowing to harvest. The B. rapa seedlings progressed from having only cotyledons to having two major leaves at 10 days and 2–4 major leaves at 18 days after sowing. These growth stages represent the first and second thinning-out periods for B. rapa cultivation. At the usual stage of harvesting (32–39 days after sowing) the seedlings had 8–16 major leaves; at 60 days, seedlings had 29–32 major leaves and had passed the appropriate stage of harvesting for food.
The root concentrations of fenobucarb, procymidone, and flutolanil were lowest at 10 days and highest at 18 days after sowing (Table 3). The root concentrations of the four pesticides tended to decrease gradually during 25–60 days after sowing. The root concentrations of tolclofos-methyl tended to increase during 10–18 days after sowing but did not change significantly. In addition, root concentrations of tolclofos-methyl tended to be lowest at 60 days after sowing. The shoot concentrations of fenobucarb, procymidone, and flutolanil were low at 10 days, high at 18 or 25 days, and declined until 60 days after sowing. Concentrations of tolclofos-methyl did not significantly differ in shoots during 10–39 days after sowing, and tolclofos-methyl was not detected at 60 days after sowing.
Table 3. Concentrations of pesticides in roots, shoots, and soil solution for each cultivation period.
| Day after sowing |
Concentrations |
| Fenobucarb |
Procymidon |
Flutolanil |
Tolclofos-methyl |
| Root (mg/kg-DW) |
| 10 days |
0.03±0.01 b |
0.11±0.04 b |
0.16±0.04 b |
0.34±0.06 ab |
| 18 days |
0.16±0.03 a |
0.37±0.06 a |
0.52±0.06 a |
0.69±0.11 a |
| 25 days |
0.12±0.02 ab |
0.36±0.07 ab |
0.32±0.05 ab |
0.47±0.08 ab |
| 32 days |
0.12±0.02 ab |
0.34±0.03 ab |
0.29±0.02 b |
0.40±0.04 ab |
| 39 days |
0.11±0.01 ab |
0.25±0.04 ab |
0.26±0.04 b |
0.36±0.06 ab |
| 60 days |
0.08±0.01 ab |
0.18±0.01 ab |
0.18±0.01 b |
0.15±0.01 b |
| Shoot (mg/kg-DW) |
| 10 days |
0.14±0.02 bc |
1.06±0.12 b |
0.030±0.005 b |
0.020±0.002 a |
| 18 days |
0.74±0.11 a |
2.45±0.58 ab |
0.083±0.020 a |
0.022±0.006 a |
| 25 days |
0.53±0.04 ab |
2.62±0.17 a |
0.086±0.007 a |
0.016±0.001 a |
| 32 days |
0.46±0.03 abc |
2.42±0.11 ab |
0.065±0.003 ab |
0.013±0.000 a |
| 39 days |
0.40±0.01 abc |
2.01±0.04 ab |
0.054±0.003 ab |
0.009±0.000 a |
| 60 days |
0.06±0.00 c |
1.45±0.13 ab |
0.017±0.002 b |
<0.002a) |
| Mean concentrations in soil solution (µg/L) |
| 10 days |
398.95 |
28.66 |
64.14 |
0.88 |
| 18 days |
369.50 |
25.99 |
57.99 |
0.79 |
| 25 days |
345.52 |
23.85 |
53.09 |
0.73 |
| 32 days |
323.09 |
21.90 |
48.61 |
0.66 |
| 39 days |
302.12 |
20.10 |
44.50 |
0.61 |
| 60 days |
247.03 |
15.54 |
34.15 |
0.47 |
Data were compared using one-way ANOVA followed by Tukey’s multiple comparison test (p<0.01). Within a column, means followed by the same letter are not significantly different. a) Under the detection limit. Reprinted and partially modified from Ref. 18.
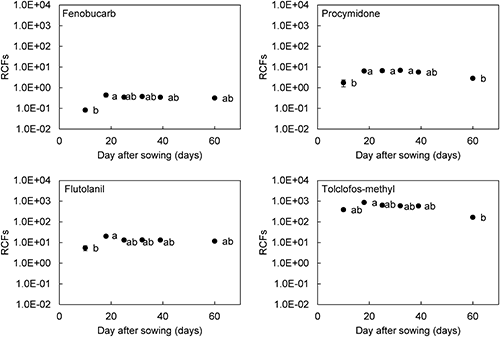
The concentration of pesticides in soil solution decreased immediately after adding pesticides to soil and continued to change with time after sowing (Table 3). The bioconcentration factor is widely used to compare the uptake and translocation ability for cases of different concentrations in the medium.19) In addition, it is assumed that plant roots take up organic chemicals including pesticides, from the soil through the soil solution.20,21) We used the root concentration factor (RCF) calculated by dividing the concentration in roots by the concentration in the soil solution to compare the uptake ability in each plant growth stage (Fig. 1). The RCF values of tested pesticides were constant 18–39 days after sowing, and then the pesticide-uptake ability of roots did not change from when the seedlings had 2–4 major leaves to the usual harvesting period. Therefore, we concluded that the decreasing trend for root concentrations of pesticides during this period was due to decreasing concentrations in the soil solution, not decreasing uptake ability by plants for physiological reasons. However, the low RCF values at 10 days after sowing indicated that B. rapa had lower pesticide-uptake ability at the seedling stage than at other growth stages. The 10-day period after sowing was soon after germination, so the root systems were not as developed as at 18 days. This indicates that root development was an important factor affecting pesticide-uptake ability from soil.
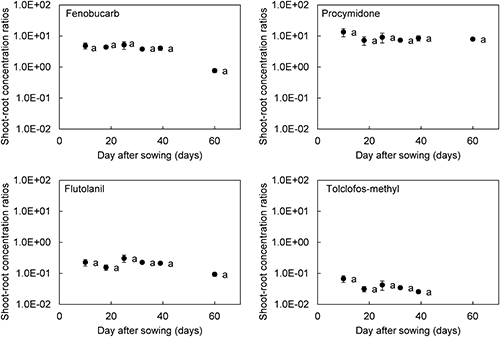
The translocation ability from root to shoot were compared by using the shoot–root concentration ratio, calculated by dividing shoot concentration by root concentration.14) Although the shoot–root concentration ratios of the pesticides for 60 days after sowing tended to decrease, they did not significantly differ (Fig. 2). It was confirmed that tested pesticides were distributed to shoots at a constant rate after being taken up by roots, regardless of growth stage. Therefore, the low pesticide concentrations in newly germinated B. rapa shoots were caused by the low uptake ability of pesticides by the root and not difficulty in root–shoot translocation. These results suggest that root system development was important for translocation from soil solution to the shoot and affected changes in the pesticide concentration in shoots.
3. Influence of
B. rapa growth conditions on plant uptake of pesticides
22)Brassica rapa were cultivated in soil mixed with four pesticides (fenobucarb, procymidone, flutolanil, and tolclofos-methyl) at different temperatures (15, 20, and 25°C), day lengths (8, 12, and 16 hr), and soil water contents (60%, 75%, and 90% water holding capacity). Then it was compared the influence of plant growth conditions on the uptake and translocation ability of pesticides.
3.1. Pesticide concentrations in root and shoot for each growth condition
The pesticide concentrations in shoots and roots are shown in Table 4. Although the root concentrations of tolclofos-methyl did not significantly differ among growth conditions, the concentrations of the other pesticides in roots at 25°C were higher than at 15°C and 20°C, and were high for the 8-hr photoperiod compared to other photoperiods. In addition, the root concentrations of fenobucarb and flutolanil tended to increase with rising soil water contents. The fenobucarb concentration in shoots at 15°C was higher than at 20°C and 25°C. However, the concentrations of procymidone, flutolanil, and tolclofos-methyl in shoots did not significantly differ with temperature. The shoot concentrations of the four pesticides were high for short days. The shoot concentrations of procymidone and flutolanil tended to increase with rising soil water content.
Table 4 Concentrations of pesticides in roots, shoots, and soil solution for each growth condition.
| Treatment |
Concentrations |
| Fenobucarb |
Procymidon |
Flutolanil |
Tolclofos-methyl |
| Root (mg/kg-DW) |
| Temperature |
15°C |
0.10±0.01 ab |
0.44±0.03 ab |
0.32±0.02 a |
0.43±0.01 a |
| 20°C |
0.08±0.01 a |
0.26±0.04 a |
0.22±0.03 a |
0.35±0.04 a |
| 25°C |
0.17±0.02 b |
0.67±0.06 b |
0.66±0.07 b |
0.33±0.02 a |
| Day length |
8 hr |
0.16±0.01 b |
0.66±0.06 b |
0.64±0.06 b |
0.40±0.03 a |
| 12 hr |
0.08±0.01 a |
0.26±0.04 a |
0.22±0.03 a |
0.35±0.04 a |
| 16 hr |
0.08±0.01 a |
0.31±0.03 a |
0.26±0.03 a |
0.32±0.03 a |
| Soil water contents |
60% |
0.08±0.01 a |
0.26±0.04 a |
0.22±0.03 a |
0.35±0.04 a |
| 75% |
0.18±0.01 b |
0.53±0.02 a |
0.47±0.03 b |
0.40±0.03 a |
| 90% |
0.14±0.02 ab |
0.54±0.07 a |
0.45±0.04 ab |
0.55±0.04 a |
| Shoot (mg/kg-DW) |
| Temperature |
15°C |
1.47±0.13 b |
2.08±0.15 a |
0.081±0.006 a |
0.007±0.0007 a |
| 20°C |
0.73±0.08 a |
2.34±0.24 a |
0.059±0.010 a |
0.008±0.0007 a |
| 25°C |
0.49±0.01 a |
2.89±0.13 a |
0.073±0.003 a |
0.006±0.0006 a |
| Day length |
8 hr |
1.40±0.08 b |
3.34±0.15 b |
0.145±0.007 b |
0.012±0.0009 b |
| 12 hr |
0.73±0.08 a |
2.34±0.24 a |
0.059±0.010 a |
0.008±0.0007 ab |
| 16 hr |
0.65±0.02 a |
2.21±0.05 a |
0.046±0.001 a |
0.007±0.0003 a |
| Soil water contents |
60% |
0.73±0.08 a |
2.34±0.24 a |
0.059±0.010 a |
0.008±0.0007 a |
| 75% |
0.58±0.13 a |
4.38±0.18 b |
0.135±0.019 b |
0.008±0.0003 a |
| 90% |
0.65±0.08 a |
4.30±0.12 b |
0.119±0.009 ab |
0.012±0.0007 a |
| Mean concentrations in soil solution (µg/L) |
| Temperature |
15°C |
365.28 |
34.89 |
84.22 |
1.39 |
| 20°C |
318.07 |
21.06 |
46.57 |
0.62 |
| 25°C |
252.46 |
18.65 |
46.86 |
0.64 |
| Soil water contents |
60% |
318.07 |
21.06 |
46.57 |
0.62 |
| 75% |
316.08 |
25.33 |
74.52 |
1.06 |
| 90% |
281.21 |
23.29 |
61.32 |
1.09 |
Data were compared using one-way ANOVA followed by Tukey’s multiple comparison test (p<0.01). Within a column, means followed by the same letter are not significantly different. Reprinted and partially modified from Ref. 22.
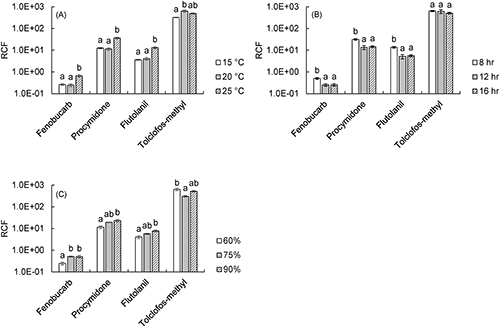
Because the mean concentrations of pesticides in soil solution differed according to temperature and soil water content (Fig. 4), the influence of growth conditions on root uptake ability of pesticides was compared using RCFs (Fig. 3).
The RCFs of fenobucarb, procymidone, and flutolanil were high for 25°C compared to other temperatures. Because plant roots can be considered as sorbents of pesticides, sorption to roots might be promoted at 25°C. In addition, the root weight and transpiration rate are regarded as plant physiological factors that influence the uptake of organic chemicals.23) At 25°C, although the root dry weight did not differ from those at other temperatures, the transpiration rate that equaled the uptake amount of the water by the root was high. Therefore, the root uptake of these pesticides might have increased with the sorption of pesticides to roots, and the amount of water taken up may have been promoted at 25°C. In addition, the RCFs of these three pesticides were high for the 8-hr (i.e., short day) photoperiod compared with other photoperiods. The root dry weight and transpiration rate were low for the short days, indicating that these factors did not affect the uptake ability of pesticides. If metabolism were promoted by long days, the pesticides might be metabolized in roots. As a result, root concentrations might decrease under long days, and the RCFs would be low. Consequently, the RCFs of these pesticides might be relatively high for short days. Moreover, the RCFs of these pesticides tended to increase with rising soil water content. These pesticides are more easily dissolved in water than tolclofos-methyl. Thus, the amount of water taken up might make a larger contribution to the uptake of these pesticides than for tolclofos-methyl, and thus the RCF increased under conditions of high soil water content due to a high transpiration rate. The RCF of tolclofos-methyl was not affected by growth conditions, and it is likely that plant physiological factors such as transpiration rate and metabolism did not influence the uptake ability for tolclofos-methyl.
Organic chemicals are translocated from root to shoot through the xylem by the transpiration stream. Thus, the transpiration stream concentration factor (TSCF) is widely used to describe the translocation of organic chemicals to shoots.2–5) The TSCF is defined as the ratio of the concentration in the xylem sap to that in the medium.2) It is difficult to directly measure the concentration in xylem sap, and so we estimated it by dividing the amount of pesticide in the shoot by the volume of water transpired24,25) (Fig. 4).
The TSCF of fenobucarb was high for the 15°C treatment, but the TSCF of procymidone increased with rising temperature. The TSCF of flutolanil did not significantly differ with temperature, indicating that temperature had little or no effect on its translocation to the shoot. The TSCF of tolclofos-methyl was high for 20°C and had no clear relationship with temperature. The above results suggest that the relationship between translocation ability and temperature varied according to the pesticide. Concerning the effect of photoperiod, the TSCFs of the four tested pesticides were higher for short days. Thus, pesticide metabolism in the shoot could be a plant physiological factor that lowered the TSCF, as also suggested for the RCF. Although the TSCFs of tolclofos-methyl were lower for 75% and 90% water holding capacity, the TSCFs of the other three pesticides remained constant for all soil water contents. Thus, translocation of fenobucarb, procymidone, and flutolanil depended on the transpiration rate for soil water treatments. Because tolclofos-methyl is highly hydrophobic, it is difficult to translocate from root to shoot. There might be little tolclofos-methyl in the shoot for the transpiration rate. It is likely that translocation of tolclofos-methyl basically depends on the transpiration rate.
Concluding remarks
Considering plant physiological factors such as root biomass and transpiration rate that may affect uptake and translocation of pesticides from soil, it was investigated the influence of growth stage and growth conditions on the ability of pesticide uptake and translocation. The plant uptake and translocation of pesticides were affected by root system development and growth conditions such as temperature and day length, not only the relationships to the chemical’s properties and behavior of pesticides in the soil. However, the changes in abilities of pesticide uptake and translocation for different temperatures or day lengths could not be explained only by difference in biomass and transpiration rate, indicating that pesticide metabolism might be affected by plant physiological factors of uptake and translocation. Further investigation is required to clarify the behavior of pesticides in plant tissues incorporating the perspective of crop cultivation, as for influence of growth conditions on the metabolism of pesticides in plants.
Acknowledgments
I would like to thank the Pesticide Science Society of Japan for presenting me with an honorary award. I am deeply grateful to Dr. Nobuyasu Seike (Institute for Agro-Environmental Sciences, NARO), Dr. Takashi Otani (NARO), and Dr. Yutaka Motoki (Food and Agricultural Materials Inspection Center) for helpful discussions and suggestions. This research was supported by the Environmental Research and Technology Development Fund (5-1302 and 5-1703) of the Ministry of the Environment, Japan.
References
- 1) S. Hori: Foods Food Ingredients J. Jpn. 212, 496–508 (2007) (in Japanese with English summary).
- 2) G. G. Briggs, R. H. Bromilow and A. A. Evans: Relationships between lipophilicity and root uptake and translocation of non-ionised chemicals by barley. Pestic. Sci. 13, 495–504 (1982).
- 3) F. C. Hsu, R. L. Marxmiller and A. Y. Yang: Study of root uptake and xylem translocation of cinmethylin and related compounds in detopped soybean roots using a pressure chamber technique. Plant Physiol. 93, 1573–1578 (1990).
- 4) F. Sicbaldi, G. A. Sacchi, M. Trevisan and A. A. M. DelRe: Root uptake and xylem translocation of pesticides from different chemical classes. Pestic. Sci. 50, 111–119 (1997).
- 5) J. G. Burken and J. L. Schnoor: Predictive relationships for uptake of organic contaminants by hybrid poplar trees. Environ. Sci. Technol. 32, 3379–3385 (1998).
- 6) S. Trapp, M. Matthies, I. Scheunert and E. M. Topp: Modeling the bioconcentration of organic chemicals in plants. Environ. Sci. Technol. 24, 1246–1252 (1990).
- 7) S. Trapp and M. Matthies: Generic one-compartment model for uptake of organic chemicals by foliar vegetation. Environ. Sci. Technol. 29, 2333–2338 (1995).
- 8) S. Trapp: Plant uptake and transport models for neutral and ionic chemicals. Environ. Sci. Pollut. Res. Int. 11, 33–39 (2004).
- 9) C. Turgut: Uptake and modeling of pesticides by roots and shoots of parrotfeather (Myriophyllum aquaticum). Environ. Sci. Pollut. Res. Int. 12, 342–346 (2005).
- 10) C. Collins, M. Fryer and A. Grosso: Plant uptake of non ionic organic chemicals. Environ. Sci. Technol. 40, 45–52 (2006).
- 11) T. E. McKone and R. L. Maddalena: Plant uptake of organic pollutants from soil: bioconcentration estimates based on models and experiments. Environ. Toxicol. Chem. 26, 2494–2504 (2007).
- 12) Y. Motoki, T. Iwafune, N. Seike, T. Otani and Y. Akiyama: Relationship between plant uptake of pesticides and water-extractable residue in Japanese soils. J. Pestic. Sci. 40, 175–183 (2015).
- 13) F. Clostre, P. Letourmy, B. Turpin, C. Carles and M. Lesueir-Jannoyer: Soil type and growing conditions influence uptake and translocation of Organochlorine (Chlordecone) by Cucurbitaceae species. Water Air Soil Pollut. 225, 2153 (2014).
- 14) S. Namiki, T. Otani, Y. Motoki, N. Seike and T. Iwafune: Differential uptake and translocation of organic chemicals by several plant species from soil. J. Pestic. Sci. 43, 96–107 (2018).
- 15) C. MacBean: “The Pesticide Manual,” 16th Ed., British Crop Protection Council, Surrey, 2012.
- 16) The 2011 Pesticide Handbook Editorial Committee: “The 2011 Pesticide Handbook” Japan Plant Protection Association, Tokyo, 2011 (in Japanese)
- 17) http://sitem.herts.ac.uk/aeru/iupac/ (Accessed 18 Jan., 2017)
- 18) S. Namiki, T. Otani, Y. Motoki and N. Seike: The influence of Brassica rapa var. perviridis growth conditions on the uptake and translocation of pesticides. J. Pestic. Sci. 43, 248–254 (2018).
- 19) J. C. White, Z. D. Parrish, M. Isleyen, M. P. N. Gent, W. Iannucci-Berger, B. D. Eitzer and M. I. Mattina: Influence of nutrient amendments on the phytoextraction of weathered 2,2-bis(p-chlorophenyl)-1,1-dichloroethylene by cucurbits. Environ. Toxicol. Chem. 24, 987–994 (2005).
- 20) T. E. McKone and R. L. Maddalena: Plant uptake of organic pollutants from soil: Bioconcentration estimates based on models and experiments. Environ. Toxicol. Chem. 26, 2494–2504 (2007).
- 21) E. L. Miller, S. L. Nason, K. G. Karthileyan and J. A. Pedersen: Root uptake of pharmaceuticals and personal care product ingredients. Environ. Sci. Technol. 50, 525–541 (2016).
- 22) S. Namiki, N. Seike and Y. Motoki: Relationship between growth stage of Brassica rapa var. perviridis and the abilities for uptake and translocation of pesticides in soil. J. Pestic. Sci. 44, 1–8 (2019).
- 23) S. Trapp: Calibration of a plant uptake model with plant- and site-specific data for uptake of chlorinated organic compounds into radish. Environ. Sci. Technol. 49, 395–402 (2015).
- 24) M. G. T. Shone, O. B. Bartlett and A. V. Wood: A Comparison of the uptake and translocation of some organic herbicides and a systemic fungicide by Barley. J. Exp. Bot. 25, 401–409 (1974).
- 25) S. Trapp: Modelling uptake into roots and subsequent translocation of neutral and ionisable organic compounds. Pest Manag. Sci. 56, 767–778 (2000).