Abstract
The matrix effects (ME) in simultaneous analysis of pesticide residue using liquid chromatography-tandem mass spectrometry (LC-MS/MS) were evaluated by comparing the slopes of matrix-matched and reagent-only calibrations of four types of vegetable samples. Both the sampling and measurement variances of the ME were also determined using one-way analysis of variance. Substantial ion suppression (ME<−20%) was observed in komatsuna, spinach, and tomato when a modified Japanese official method was implemented. The ME magnitude varied significantly due to sample variability for some pesticides, but it varied by no more than 4% as a result of analytical procedure variance. This study also showed that the addition of stable isotope-labeled internal standards at low concentrations improved the recovery of pesticides from samples at various residue levels. The findings of this study highlight the importance and practical application of internal standards and the matrix-matched calibration method in residue analysis using LC-MS/MS.
Introduction
Fungicides, insecticides, and herbicides (hereafter jointly referred to as pesticides) are important for stable and efficient crop production, and serve as countermeasures against diseases, pests, weeds, and other plant pathogens.1–3) Consumers may become exposed to the active ingredients in pesticides through pesticide-treated food products,4,5) although applied pesticides are gradually degraded and/or washed away by sunlight, microorganisms, and rainfall.6) In Japan, the Ministry of Health, Labour, and Welfare (MHLW) has banned the sale and processing of food commodities that contain residues at levels exceeding a maximum residue level (MRL) or a uniform limit (0.01 ppm) depending on the pesticide and the food combinations.
To ensure food safety, regular monitoring of pesticide residues in agricultural product by a simultaneous analysis plays a crucial role in accurately assessing exposure levels and ensuring compliance. Mass spectrometry coupled with chromatographic separation is a powerful tool for identifying analytes in sample extracts.7) Polar, nonvolatile, and thermally unstable compounds are more suitable for analysis using liquid chromatography-tandem mass spectrometry (LC-MS/MS) in electrospray ionization (ESI) mode than gas chromatography-tandem mass spectrometry8–10) and thus, LC-MS/MS is frequently adopted for a simultaneous analysis.11–13)
However, the changes in the target analyte ionization efficiency caused by the presence of compounds co-extracted from food samples, called the matrix effect (ME), remains problematic for the analysis using LC-MS/MS. This effect leads to a deterioration in the quality and reliability of data obtained from quantitative assays, because it can significantly affect the reproducibility, linearity, and accuracy of the method.14) Previous studies have suggested several ME mechanisms: 1) the matrix prevents the analyte from gaining access to the charge at the surface of the droplet, 2) the matrix competes with the analyte to gain charge, 3) the matrix increases the viscosity and surface tension of the droplets, which prevents further coulombic explosion and slows down solvent evaporation, and 4) the matrix interferes with the ability of the analyte to remain charged in the gas phase.15,16)
To satisfy the quality control and method validation requirements of analysis,7,17) minimizing the ME should be considered.18) The inclusion of a clean-up procedure for sample or dilution of the final solution are common approaches for reducing the ME in the pesticide residue analysis. However, for a simultaneous analysis, previous studies have shown that addition of some clean-up procedures, such as liquid-liquid partitioning and solid-phase extraction only led to a slight reduction in MEs.19–21) Moreover, lowering analyte concentrations in the final solution by dilution could limit the analytical scope and decrease the likelihood of analyte detection in devices with low recovery or sensitivity.22) On the other hand, the internal standard (IS) or matrix-matched calibration methods can compensate for MEs in a simultaneous analysis, and no change in the clean-up procedure is required.23) In the IS calibration method, a stable isotope-labeled (SIL) IS, which possesses almost equivalent physicochemical properties as the target analyte, is used to compensate for the ME. In the matrix-matched calibration method, the calibration standard is dissolved in the final solution of the blank sample, which is cleaned-up in the same manner as the test sample.
Obstacle for the application of the IS calibration method is low availability and high cost of SIL-ISs to satisfy the analyte multiplicity.19) Jiao et al. compared the capabilities of imidacloprid-d4, acetamiprid-d3, and thiamethoxam-d4 for compensating for the ME in eight neonicotinoid pesticides for the simultaneous analysis of pesticide residues in tea using LC-MS/MS.24) They suggested that acetamiprid-d3 would be the best SIL-IS for method evaluation among the three SIL-ISs but concluded that using an SIL-IS other than the corresponding pesticide to compensate for the ME would be a poor choice.24) Therefore, the selection of SIL-ISs that function with reasonable certainty and evaluation of the minimal amount of SIL-IS necessary to compensate for the ME are the important for applying this method to a routine simultaneous analysis with an acceptable low cost. However, it is still not clear that which pesticides are strongly affected by sample matrices and how much SIL-ISs should be used for peak compensation. Moreover, previous studies have defined MEs as being strongly influenced by the retention time (tR) rather than by the chemical structure of the analyte.18,19) Our previous study showed that the tR of the neonicotinoid pesticide and its SIL-IS differed by approximately 0.01 min.12) The effects of these differences between pesticides and SIL-ISs on ME remain to be elucidated.
In the matrix-matched calibration method, blank samples equivalent to test samples are not always available in most food-market screening tests. Thus, blank samples of not identical but same type of agricultural crops which are not treated with target pesticides are commonly used for matrix-matched calibration. In this situation, the consistency of the MEs from the test and blank samples is important to compensate for the ME. Kruve et al. reported that the relative standard deviation (RSD) of ME for five varieties of apples was as high as 34% for some pesticides.25) Kwon et al. showed that the calculated standard deviation values of 20 spinach, apple, and rice varieties, were below 10% for all target analytes, but that those of 20 orange varieties were greater than 20% for some pesticides analyzed using LC-MS/MS.26) The ME consistency could vary not only due to sample type but also due to measurement error, however, these studies only suggested sampling variance in a single analysis, and discussion of sampling and measurement variance on the ME among the same sample type has not yet been clarified.
In this study, the magnitude of ME on 25 analytes in the pesticide residue analysis for four vegetables (Japanese mustard spinach (komatsuna), spinach, tomato, and aubergine) of five varieties of each commodity cultivated on different farmland, prepared using a modified Japanese official method using LC-MS/MS, were clarified. Moreover, not only sampling variance but also measurement variance in the MEs were evaluated for the first time using one-way analysis of variance (ANOVA) to measure the extent and constancy of the MEs for 25 analytes. Subsequently, the consistency of ME between pesticides and their corresponding SIL-ISs for the IS calibration method was evaluated, and the application of external standard, IS and matrix-matched calibration methods for the simultaneous analysis of pesticide residues was assessed.
Materials and methods
1. Chemicals and samplesAcetonitrile, toluene, methanol, and ultrapure water used for the clean-up processes and LC-MS/MS analysis were purchased from Fujifilm Wako Pure Chemical Corporation (Tokyo, Japan). Pesticide standards were purchased from Fujifilm Wako Pure Chemical Corporation. PL pesticides surrogate mix VII (neonicotinoid-II 7 mix) including acetamiprid-d3, clothianidin-d3, dinotefuran-d3, imidacloprid-d4, nitenpyram-d3, thiacloprid-d4, and thiamethoxam-d3 were purchased from Hayashi Pure Chemical Industry (Osaka, Japan). Pirimiphos-methyl-(O,O-dimethyl-d6) (pirimiphos-methyl-d6), prometryn-(N2-isopropyl-d7) (prometryn-d7), and acephat-(acetyl-d3) (acephate-d3) were purchased from Honywell International Inc. (North Carolina, US). Atrazine-d5, cyanazine-d5, diuron-d6, flufenoxuron-d3, hexazinone-d6, (E, Z)-methomyl-d3 (methomyl-d3), (±)-triadimefon-d4, (triadimefon-d4), propoxur-d3, and propyzamide-d3 were purchased from CDN Isotopes, Inc. (Quebec, Canada). Fluopyram-(benzamide ring-d4) (fluopyram-d4), hexaconazole-(butyl-2,2,3,3,4,4,4-d7) (hexaconazole-d7), propiconazole-(phenyl-d3) (propiconazole-d3), and tebuconazole-(trimethyl-13C3) (tebuconazole-13C3) of Sigma-Aldrich® were purchased from Merck KGaA (Darmstadt, Germany). [13C6]-Boscalid (boscalid-13C6), [13C6]-Fluxapyroxad (Fluxapyroxad-13C6), and [13C, 2H3]-Mepronil (Mepronil-13C, d3) were obtained from Alsachim (Illkirch Graffenstaden, France). Triphenyl phosphate (TPP) of Dr.Efrenstorfer™ was purchased from LGC Limited (Teddington, UK).
Komatsuna, spinach, tomato, and aubergine were selected as food samples in this study as representative vegetable commodities. Five varieties of each commodity cultivated on different farmlands in Osaka were purchased from several local markets (cultivars unknown).
2. Sample preparation and clean-up procedure for vegetable food samplesThe clean-up procedure was performed according to a modified Japanese official method (multiresidue method I for agricultural chemicals by LC/MS (agricultural products)).27) The edible parts of the food samples, weighing more than 1 kg were thoroughly homogenized using a Robo-coupe Blixer BF3 (FMI, Ltd., Tokyo, Japan), and 20.0 g of the homogenized sample was added to 100 mL of acetonitrile in a conical flask. The mixture was agitated vigorously for 30 min on a shaker. The extract was then filtered through 5A (I.D. 70 mm) filter paper (Toyo Roshi Kaisha, Ltd., Tokyo, Japan) by suction filtration. The residue was rinsed three times with approximately 20 mL acetonitrile. The solvent extracts were then combined, and the volume was increased to 200 mL with acetonitrile. An 80 mL aliquot of the extraction solution was mixed with 10 g of sodium chloride and 20 mL of a 0.5 mol/L phosphate buffer (pH 7) in a 300 mL separation funnel. The mixture was vigorously agitated for 10 min and allowed to stand for approximately 10 min. After discarding the aqueous phase, the acetonitrile phase was dried over anhydrous sodium sulfate and filtered. The filtrate was concentrated using a rotary evaporator at 40°C and dried under a gentle stream of nitrogen. The residue was reconstituted in 5 mL of acetonitrile/toluene (3 : 1 v/v) and the resulting solution was loaded onto a graphite carbon/aminopropylsilanized silica gel-layered cartridge (InertSep® GC/NH2; GL Science, Tokyo, Japan), preconditioned with 10 mL of acetonitrile: toluene (3 : 1 v/v). After the target compounds were eluted using 15 mL acetonitrile/toluene (3 : 1 v/v), the eluate was concentrated and dried. The residue was reconstituted in methanol and analyzed using LC-MS/MS.
3. LC-MS/MS conditions for analysisLC-MS/MS analysis was performed on an LCMS-8050® system and the analytes were identified in the selected reaction monitoring (SRM) (ESI positive) mode (Shimadzu Corp., Kyoto, Japan). A Kinetex® C18 column (2.6 µm, 100×2.1 mm2; Phenomenex, California, USA) coupled with SecurityGuard™ ULTRA biphenyl guard cartridge (4×2.1 mm2, Phenomenex, California, USA) was used for analyte separation in LC. Solvents A (2 mmoL/L ammonium formate and 0.002% formic acid in ultrapure water) and B (2 mmol/L ammonium formate and 0.002% formic acid in methanol) were used as the mobile phase. A binary gradient mode was used to separate the tR of the analytes. The other LC-MS/MS conditions are listed in Supplemental Table S1. The method package No. 621 (Shimadzu) was used to determine the analyte parameters. For the analytes not listed in the package, the most intense SRM transition was selected for each analyte. The CE was tuned for the selected transition mass by injecting a mixture of pesticides and the SIL-IS standard solutions. The limits of determination and quantification were 0.00125 and 0.0025 mg/kg, respectively, for all pesticides. The SRM transitions for each analyte are listed in Table 1. The analytes are listed according to the order of tR.28)
Table 1. Liquid chromatography-tandem mass spectrometry parameters of the analytes.
| No. | Analyte | tR (min) | Precusor ion | Quantification ion | Confirmation ion | Q1 Pre bias (V) | CE (V) | Q3 Pre bias (V) |
|---|
| 1 | Acephate-d3 | 2.17 | 187.05 | 143.05 | 95.00 | −20 | −11 | −24 |
| 2 | Acephate | 2.18 | 184.00 | 143.00 | 49.15 | −20 | −10 | −27 |
| 3 | Dinotefuran-d3 | 2.65 | 206.05 | 132.20 | 90.15 | −16 | −13 | −22 |
| 4 | Dinotefuran | 2.66 | 203.00 | 129.30 | 114.30 | −11 | −13 | −24 |
| 5 | Nitenpyram-d3 | 2.90 | 274.15 | 192.20 | 126.00 | −11 | −15 | −27 |
| 6 | Nitenpyram | 2.91 | 271.00 | 189.30 | 126.00 | −11 | −13 | −19 |
| 7 | Methomyl-d3 | 3.01 | 166.10 | 88.00 | 106.05 | −12 | −10 | −13 |
| 8 | Methomyl | 3.02 | 163.00 | 87.90 | 106.15 | −18 | −10 | −16 |
| 9 | Thiamethoxam-d3 | 3.14 | 294.95 | 131.95 | 184.10 | −11 | −24 | −26 |
| 10 | Thiamethoxam | 3.14 | 291.95 | 132.10 | 181.05 | −12 | −20 | −23 |
| 11 | Imidacloprid-d4 | 3.45 | 260.10 | 213.10 | 179.15 | −10 | −17 | −20 |
| 12 | Clothianidin-d3 | 3.46 | 252.95 | 132.00 | 172.10 | −19 | −16 | −28 |
| 13 | Imidacloprid | 3.46 | 256.00 | 209.20 | 175.15 | −10 | −16 | −19 |
| 14 | Clothianidin | 3.47 | 250.05 | 132.10 | 169.15 | −10 | −20 | −21 |
| 15 | Acetamiprid-d3 | 3.64 | 226.00 | 59.05 | 59.05 | −17 | −16 | −23 |
| 16 | Acetamiprid | 3.65 | 223.10 | 126.05 | 56.15 | −12 | −20 | −11 |
| 17 | Thiacloprid-d4 | 3.84 | 257.10 | 126.10 | 126.10 | −10 | −22 | −26 |
| 18 | Thiacloprid | 3.85 | 252.95 | 99.05 | 90.00 | −10 | −44 | −17 |
| 19 | Cyanazine-d5 | 4.16 | 246.15 | 219.15 | 137.10 | −18 | −17 | −20 |
| 20 | Cyanazine | 4.18 | 240.80 | 214.00 | 104.00 | −27 | −17 | −22 |
| 21 | Propoxur-d3 | 4.29 | 213.15 | 111.05 | 93.00 | −16 | −16 | −17 |
| 22 | Propoxur | 4.31 | 209.90 | 168.15 | 93.10 | −22 | −9 | −18 |
| 23 | Hexazinone-d6 | 4.35 | 259.20 | 177.15 | 77.10 | −20 | −19 | −20 |
| 24 | Atrazine-d5 | 4.90 | 221.15 | 179.05 | 101.10 | −17 | −19 | −17 |
| 25 | Atrazine | 4.93 | 216.10 | 174.10 | 104.05 | −24 | −13 | −18 |
| 26 | Diuron-d6 | 5.04 | 239.10 | 78.10 | 52.15 | −18 | −23 | −30 |
| 27 | Diuron | 5.06 | 233.00 | 72.10 | 46.15 | −26 | −8 | −27 |
| 28 | Boscalid-13C6 | 5.75 | 349.10 | 313.10 | 278.05 | −13 | −21 | −30 |
| 29 | Boscalid | 5.76 | 343.00 | 306.95 | 270.95 | −18 | −11 | −21 |
| 30 | Propyzamide-d3 | 5.90 | 259.10 | 148.00 | 176.00 | −10 | −37 | −23 |
| 31 | Propyzamide | 5.90 | 256.00 | 145.05 | 173.00 | −13 | −35 | −28 |
| 32 | Fluxapyroxad-13C6 | 5.91 | 388.10 | 368.05 | 348.10 | −15 | −15 | −23 |
| 33 | Fluxapyroxad | 5.91 | 382.00 | 342.00 | 392.00 | −19 | −17 | −24 |
| 34 | Mepronil-13C, d3 | 5.94 | 274.15 | 123.10 | 232.15 | −20 | −24 | −20 |
| 35 | Mepronil | 5.95 | 270.20 | 228.00 | 119.05 | −14 | −9 | −24 |
| 36 | Triadimefon-d4 | 5.95 | 298.15 | 201.10 | 69.05 | −22 | −17 | −19 |
| 37 | Triadimefon | 5.97 | 294.10 | 196.95 | 225.00 | −15 | −15 | −20 |
| 38 | Fluopyram-d4 | 6.19 | 401.10 | 177.05 | 208.00 | −15 | −31 | −16 |
| 39 | Fluopyram | 6.21 | 397.00 | 145.00 | 173.00 | −12 | −39 | −27 |
| 40 | Prometryn-d4 | 6.22 | 249.20 | 159.05 | 207.15 | −19 | −25 | −14 |
| 41 | Prometryn | 6.25 | 242.10 | 158.00 | 200.15 | −20 | −12 | −16 |
| 42 | Tebuconazole-d3 | 6.90 | 311.15 | 125.00 | 70.05 | −12 | −35 | −21 |
| 43 | Tebuconazole | 6.90 | 308.20 | 125.05 | 151.15 | −16 | −38 | −23 |
| 44 | Propiconazole-d3 | 7.01 | 345.15 | 69.10 | 162.05 | −13 | −22 | −10 |
| 45 | Propiconazole | 7.02 | 342.00 | 158.90 | 69.10 | −17 | −28 | −16 |
| 46 | Hexaconazole-d7 | 7.13 | 321.15 | 70.05 | 159.00 | −12 | −23 | −25 |
| 47 | Hexaconazole | 7.15 | 314.10 | 70.00 | 159.00 | −16 | −22 | −27 |
| 48 | Triphenyl phospate | 7.18 | 327.05 | 152.05 | 77.05 | −25 | −40 | −24 |
| 49 | Pirimiphos-methyl-d3 | 7.32 | 312.15 | 108.05 | 164.15 | −12 | −33 | −17 |
| 50 | Pirimiphos-methyl | 7.36 | 306.10 | 164.10 | 108.15 | −17 | −18 | −17 |
| 51 | Flufenoxuron-d3 | 8.87 | 492.10 | 161.05 | 144.00 | −18 | −21 | −15 |
| 52 | Flufenoxuron | 8.88 | 489.00 | 158.10 | 140.90 | −15 | −21 | −29 |
The abbreviations are as follows: Retention time (tR) and collision energy (CE).
There are some methods for calculating the ME, which have been reported in previous studies.23) One of the major methods is to calculate the ME using the peak area of the analyte in reagent-only and matrix-matched solutions at a certain concentration.12,13,22,29) The other is to calculate the ME using the slope of the calibration curve of the analyte in the two solutions.26,30–32) When agricultural crops are tested, the concentration of pesticide residues is unknown prior to conducting the analysis. Therefore, understanding the MEs over a wide range of concentrations is essential to achieve reliable and precise results from simultaneous analysis of pesticide residues. Therefore, the latter method was selected to evaluate the ME on target analytes in this study as follows:
 | (1) |
To achieve the slope of calibration curve, the multi-level calibration curves with weighing (weighing factor=1/x2, x=concentrations) for both the reagent-only and matrix-matched calibrations were calculated using a linear regression. Including a zero point in the calibration method may underestimate/overestimate the ME at a low concentration, therefore, standard solutions containing the target analytes (5, 10, 25, 62.5, and 175 ng/mL) and the syringe spikes (100 ng/mL) were prepared to calculate the calibration curves in this study. The residuals of the five concentrations were not equivalent, which increased from low to high concentrations (Supplemental Fig. S1), and the results suggested that a weighted regression is more suitable to be applied to calculate calibration curves.33,34) The order of sample injections in the sequences was accorded to the previous study.26) Each sequence began with the reagent-only 0 standard (reagent blank) followed by the matrix-matched 0 standards (sample blank) for checking a presence of false detects. This pattern was repeated for the remaining reagents and samples from low to high concentrations to calculate the calibration curves. The ME determination was replicated four times for each sample.
In this study, TPP and hexazinone-d6 were added to all reagent-only and matrix-matched calibration standards at same concentration (100 ng/mL) as syringe spikes, therefore, the average ME on syringe spikes (MEss) were calculated using the former method for each sequence as follows:
 | (2) |
The measurement variance (σ02) caused by uncertainty in analysis and the sampling variance (σ12) due to the difference between the food samples contribute to the variance calculated from random samples.33) Calculation of these variances were performed according to the theory explained in Ref. 33. First, the mean square values within and between groups were determined using the following equations;
 | (3) |
 | (4) |
where, n and h represent the number of replicates and the sample varieties, respectively. xij is the jth measurement value of the ith sample. x̄i and x̄ represents the mean value of each sample and the grand mean, respectively. The mean square within identical sample is independent from the mean of each sample, thus σ02 could be estimated from Eq. (3). On the other hand, mean square between groups could be altered by both variability among samples and uncertainty in measurement, and is estimated by σ02 + nσ12. If there is a significant difference between the mean square values within and between groups, which means σ12≠0, the estimated sampling variance can be calculated by the following equation:
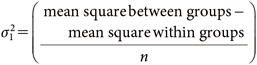 | (5) |
If there is no significant difference between the mean square values within and between groups, that is σ12=0, only σ02 is considered for a discussion of ME in this study. The estimated standard deviation (ESD=σ0) of each variance was calculated from the square root of the estimated variances of measurement and sampling.
6. Recovery test of pesticides from a vegetable food sampleRecovery tests at the three concentrations were performed in five replicates using a blank komatsuna sample. A pesticide standard solution was spiked into 20.0 g of the homogenized sample at 0.0025, 0.01, and 0.04 mg/kg concentration. The samples were processed following the clean-up procedure, and the residue was reconstituted in 2 mL of methanol (4 g/mL of methanol). A standard solution of SIL-IS was spiked into the final solution at 0.0025 mg/kg. The final solution was analyzed using LC-MS/MS and quantification was performed. The recovery was calculated using three methods: external standard, IS, and matrix-matched calibration. Each calibration curve was calculated with weighting (weighing factor=1/x2). For the external standard calibration method, the calibration curve of the analyte concentration versus the peak area in the methanol solution was investigated. For the matrix-matched calibration method, the calibration curve of the analyte concentration versus the peak area in the cleaned-up extract solution (4 g/mL of methanol) was investigated. For the IS calibration method, calibration curves were constructed using the concentration and peak area ratios of the pesticides to 0.0025 mg/kg of SIL-ISs. All calibration curves were investigated in the range of 5–175 ng/mL. Equivalent amounts of TPP and hexazinone-d6 were added to the final solution as syringe spikes (100 ng/mL). Recovery was calculated for all analytes using external standard and matrix-matched calibration methods. For the IS calibration method, the recoveries of propyzamide and propiconazole were not analyzed because discrimination of the pesticides from their SIL-IS was not possible using LC-MS/MS when these analytes were mixed in the final solution. These pesticides contain two chlorine atoms but their SIL-ISs contains only three d isotopes. The reason of this inability could be because the molecular mass of the pesticides and SIL-ISs were nearly identical due to the presence of natural isotopes of chlorine atoms, which has made LC-MS/MS difficult to discriminate them.
Results and discussion
1. Repeatability of LC-MS/MS analysis in evaluation of ME and recovery testThe response of the analyte from an identical sample may be altered depending on the day of the analysis due to environmental conditions and other unknown reasons even the measurement process and LC-MS/MS parameters are fixed. To obtain valid results and discuss the MEs of the tested vegetables, the LC-MS/MS performance was assessed throughout the experimental period. In this study, the suitability of TPP and hexazinone-d6 as syringe spikes was evaluated. First, TPP and hexazinone-d6 were added to all reagent-only and matrix-matched calibration standards immediately prior to analysis (100 ng/mL) in four replicates for each variety of vegetable sample. In the evaluation of ME, the RSD of the TPP and hexazinone-d6 response varied from 5 to 15% and 5 to 14%, respectively, depending on the vegetable sample (Table 2). The results showed that the LC-MS/MS performance was good throughout the study, as the repeatability of both TPP and hexazinone-d6 did not exceeded more than 20% for all vegetable samples.7) Although the difference in the response of TPP and hexazinone-d6 depending on the day of the analysis was small throughout the study, the peak areas of hexazinone-d6 showed a slight downward trend from the low to high concentrations of the calibration during the sequences (Supplemental Fig. S2-1). A similar trend was reported in a previous study for apple, spinach, orange, and rice samples cleaned up with modified QuEChERS method and LC-MS/MS.26) Kwon et al. suggested that this trend is presumably caused by the accumulation of co-injected matrix materials in the system or increasing analyte concentration in the calibration standards with sequence progression.26) In this study, the TPP response showed a slight increase at the beginning of the analysis, followed by a downward trend (Supplemental Fig. S2-2). The slight upward trend could be due to the accumulation of TPP in the LC-MS/MS system because the trend was not noticed after the initial approximately 10 injections of the sequence. Moreover, Mol et al. explained that substantial signal suppression or enhancement (ME<−20% and ME>20%) interfered with accurate determination using LC-MS/MS analysis.35) The MEss of TTP and hexazinone-d6 was calculated using Eq. (2) and the results show that the MEss of TPP and hexazinone-d6 was sufficiently low to be ignored because the MEss was between −7% and 3% (Table 2). Ideally, normalization of analyte peaks to the corresponding SIL-IS eliminates a trend in the sequence and ME, however, it is impractical due to availability, cost and other practical limitations in a simultaneous analysis.26) Overall, hexazinone-d6 was a better syringe spike than TPP in compensating for the slight downward trend in the sequence in this study.
Table 2. Repeatbility of peak areas (RSD) and matrix effect of triphenyl phosphate (TPP) and hexazinone-
d6 (ME
ss) (%).
| Komatsuna | Spinach | Tomato | Aubergine |
|---|
| TPP | RSD of peak response (%) | 13 | 15 | 14 | 5 |
| MEss (%) | Average | 1 | 1 | 1 | 0 |
| Max. | 2 | 3 | 2 | 2 |
| Min. | 0 | 0 | −1 | −1 |
| Hexazinone-d6 | RSD of peak response (%) | 14 | 5 | 5 | 5 |
| MEss (%) | Average | −5 | −3 | −4 | −2 |
| Max. | −2 | −2 | −2 | −1 |
| Min. | −7 | −3 | −5 | −3 |
In the recovery test, the RSD of hexazinone-d6 throughout the sequence was only 2% because the number of samples in the sequence was less than that in the ME evaluation. Therefore, compensation for the peak area of the target analyte by hexazinone-d6 was not conducted for the recovery test.
2. Difference in ME on pesticide and its SIL-IS in an identical sampleIn this study, the ME magnitude on 25 pesticides and their SIL-ISs were compared, and the similarity of the MEs on the pesticides and their SIL-ISs were assessed using a blank komatsuna sample. The sample was cleaned-up, and both the pesticide and its SIL-IS were spiked into the final solution for all analytes, except propyzamide and propiconazole. For these two combinations, the pesticides and SIL-ISs were spiked separately into the sample solution. The MEs on the pesticides and SIL-ISs were calculated using Eq. (1). A two-tailed t-test (t=2.31 (p=0.05), n=5) was used to determine the significance.33) The results showed that there was no significant difference in the MEs on the pesticides and SIL-ISs, except in some cases (Table 3). The MEs were significantly different between thiamethoxam, thiacloprid, diuron, boscalid, triadimefon and prometryn and their SIL-ISs. Peak area compensation by hexazinone-d6 did not alter the results, except for triadimefon-d6. This study showed that some pesticides and SIL-ISs can experience significantly different MEs, although their physicochemical properties are nearly identical. There was no significant difference in the number of isotopes between these six SIL-ISs and the remaining nineteen SIL-ISs, suggesting that the number of an isotope substitution is not responsible for the significant difference in ME between the pesticides and their SIL-ISs in this study. Nevertheless, the average difference in the MEs of the 25 pesticides and those of the SIL-IS was 2% with and without compensation of the peak area by hexazinone-d6. The maximum difference in the ME of boscalid and boscalid-d6 was only 8% when the peak area is compensated for hexazinone-d6. Although random errors in measurement may significantly alter magnitude of ME, this study suggests that pesticides and their SIL-ISs undergo MEs of a similar magnitude. This study also suggests that both d and/or 13C substituted SIL-ISs would work well with the IS calibration method. Overall, the MEs on the SIL-ISs were evaluated to estimate the ME patterns in the market samples in this study.
Table 3. Two tailed
t-test result of the average matrix effect (ME) on the target pesticides against the ME on the corresponding stable isotope-labeled (SIL) internal standards (ISs) with or without (w/o) compansation for peak area by hexazinone-
d6 (
t=2.306 (
p=0.05),
n=5). The
t-value in bold showed significant difference between the MEs. R represents the absolute value of the difference between ME on the pesticides and SIL-ISs. The analytes are listed according to the order of retention time.
28)| No. | Pesticide | SIL-IS | W/O hexazinone-d6 | With hexazinone-d6 |
|---|
| t-value | R (%) | t-value | R (%) |
|---|
| 1 | Acephate | Acephate-d3 | 0.292 | 0 | 0.374 | 0 |
| 2 | Dinotefuran | Dinotefuran-d3 | 1.863 | 1 | 2.154 | 2 |
| 3 | Nitenpyram | Nitenpyram-d3 | 1.673 | 2 | 1.469 | 2 |
| 4 | Methomyl | Methomyl-d3 | 1.555 | 1 | 1.071 | 1 |
| 5 | Thiamethoxam | Thiamethoxam-d3 | 2.919 | 4 | 2.699 | 6 |
| 6 | Imidacloprid | Imidacloprid-d4 | 1.898 | 2 | 1.919 | 2 |
| 7 | Clothianidin | Clothianidin-d3 | 1.313 | 2 | 1.457 | 1 |
| 8 | Acetamiprid | Acetamiprid-d3 | 0.023 | 0 | 0.019 | 0 |
| 9 | Thiacloprid | Thiacloprid-d4 | 3.252 | 5 | 3.725 | 5 |
| 10 | Cyanazine | Cyanazine-d5 | 1.974 | 2 | 2.008 | 2 |
| 11 | Propoxur | Propoxur-d3 | 0.579 | 0 | 0.688 | 1 |
| 12 | Atrazine | Atrazine-d5 | 1.111 | 1 | 1.561 | 1 |
| 13 | Diuron | Diuron-d6 | 8.089 | 5 | 12.136 | 6 |
| 14 | Boscalid | Boscalid-13C6 | 2.749 | 7 | 2.811 | 8 |
| 15 | Propyzamide | Propyzamide-d3 | 2.202 | 4 | 2.224 | 5 |
| 16 | Fluxapyroxad | Fluxapyroxad-13C6 | 0.067 | 0 | 0.068 | 0 |
| 17 | Mepronil | Mepronil-13C, d3 | 0.313 | 1 | 0.375 | 0 |
| 18 | Triadimefon | Triadimefon-d4 | 2.548 | 2 | 1.956 | 3 |
| 19 | Fluopyram | Fluopyram-d4 | 1.155 | 1 | 1.458 | 1 |
| 20 | Prometryn | Prometryn-d7 | 3.260 | 2 | 6.979 | 2 |
| 21 | Tebuconazole | Tebuconazole-13C3 | 0.137 | 1 | 0.211 | 1 |
| 22 | Propiconazole | Propiconazole-d3 | 1.891 | 3 | 1.634 | 2 |
| 23 | Hexaconazole | Hexaconazole-d7 | 0.542 | 1 | 0.412 | 1 |
| 24 | Pirimiphos-methyl | Pirimiphos-methyl-d6 | 0.384 | 0 | 0.291 | 0 |
| 25 | Flufenoxron | Flufenoxron-d3 | 0.316 | 0 | 0.957 | 0 |
The linearity of the calibration curves of the target analytes was also assessed to determine the LC-MS/MS performance in obtaining reliable MEs. The guideline states that the deviation of the back-calculated concentrations of the calibration standards from the true concentrations, using the calibration curve in the relevant region should not be more than ±20%.7) The matrix-matched calibration curve of methomyl-d3 for blank komatsuna sample is shown in Fig. 1. The calibration curve of methomyl-d3 satisfied the guideline as the deviation of the back-calculated concentrations was between −3% and 3% at all concentration levels in komatsuna sample (Supplemental Table S2). The deviations of the back-calculated concentrations from the true concentrations for all analytes and vegetable sample combinations, using the matrix-matched calibration curves are listed in Supplemental Table S2 and all calibration curves satisfied the guideline. When hexazinone-d6 was used to compensate for the peak response, the deviations were also satisfactory for all combinations. The r-squared (r2) values of calibration curves with or without peak compensation by hexazinone-d6 were greater than 0.990 and 0.989, respectively for all vegetable samples (Supplemental Table S3). Moreover, satisfactory results were obtained from the reagent-only calibration curves. These results showed that both the reagent-only and the matrix-matched calibration curves could be used to accurately calculate ME in any cases.
4. Evaluation of the MEs on SIL-ISs in four types of vegetable samplesThe MEs on the SIL-ISs in komatsuna, spinach, tomato, and aubergine with or without peak compensation by hexazinone-d6 were calculated using Eq. (1). Each calculation was repeated four times for each sample. Figure 2 shows the MEs on the SIL-ISs in five varieties of all vegetables samples when the peak area was compensated for by hexazinone-d. The results demonstrate that the ME on some of the target analytes can be altered depending on the variety of the same type of vegetable, even downward trend in a sequence is compensated for. The MEs for all combination of the SIL-ISs and the samples are listed in Supplemental Table S3–S6. According to the criteria defined by Mol et al.,35) substantial ion suppression (ME<−20%) was observed for dinotefuran-d3, clothianidin-d3, and thiacloprid-d4 for komatsuna, acetamiprid-d3 and flufenoxron-d3 for spinach, and nitenpyram-d3 for tomato, in at least one result of the four replicates. No substantial ion enhancement (ME>20%) was observed for any analyte and test sample combinations. Compensation of the peak area by hexazinone-d6 contributed to the mitigation of substantial ion suppression for a few percent. Grand mean was also calculated by dividing the sum of each mean ME by the number of sample varieties (h=5).33) The grand mean of the ME on these SIL-ISs when peak area was compensated for by hexazinone-d6, were between −20% and 20% except for thiacloprid-d4 in komatsuna (Supplemental Table S3–S6). This difference in the mean and grand mean of the ME suggests that the MEs could vary due to sampling and/or measurement differences. Additionally, a one-way ANOVA (The degree of freedom (df) within groups=15, df between groups=4, F critical value=3.045 (p=0.05)) was performed to investigate whether there was a significant difference in the mean ME between varieties of samples.33) The results of the one-tailed F-test are shown in Supplemental Table S3–S6 and suggest that 20 out of 25 analytes in komatsuna, and 17, 17, and 12 out of 25 analytes in spinach, tomato, and aubergine, showed significant difference in the ME between varieties of samples, when peak area was compensated for by hexazinone-d6.
5. Sampling and measurement variances of ME on SIL-ISs in vegetable food samplesTo further discuss the variance in the ME, both the estimated variances of measurement and sampling when peak area is compensated for by hexazinone-d6 were evaluated using Eqs. (3)–(5). The result showed that the measurement variance were below 4% for all combination of the SIL-ISs and the samples (Fig. 3). The ESD of measurement was 0.6–3% for komatsuna, 0.4–2% for spinach, 0.5–3% for aubergine, and 0.6–4% for tomato, respectively, undergoing the same clean-up procedure by the same analyst using the same instrument. On the other hand, the sampling variance differed among the combination of the SIL-ISs and the samples (Fig. 3). The ESD of sampling were higher than ESD of measurement in 16, 14, 10 and 10 out of 25 analytes in the komatsuna, spinach, tomato, and aubergine, respectively. These results demonstrated that variance in ME was more influenced by sampling than measurement for about half of the analytes. The ESD of sampling for acetamiprid-d3 and flufenoxuron-d3 in spinach were 13% (Fig. 3). In a previous study, the consistency of ME between samples was assessed by calculating standard deviation values and the consistency of ME was suggested when the standard deviation values were <10%.26) These results suggest the consistency of ME between the same types of vegetable samples, except for acetamiprid-d3 and flufenoxuron-d3 in spinach. However, the results in the previous chapter showed that there was a significant difference among the five sample variabilities for 20, 17, 17 and 12 out of 25 analytes in the komatsuna, spinach, tomato, and aubergine (Supplemental Table S3–S6). Besil et al. demonstrated that ME were different among citrus species but similar between varieties in orange and mandarin.28) On the other hand, Kruve et al. showed that there were differences in ME among apple varieties for some pesticides.25) Although, the cultivar of the test samples was untraceable in this study, the sampling variance in ME may be due to the difference in the cultivation area and/or cultivars among the samples in vegetable samples for these pesticides. Therefore, the blank sample of a same cultivar from the same farmland to the test sample is recommended for compensation of the MEs using matrix-matched calibration method to avoid an insufficient/excess compensation of peak area. Besides, the measurement variance cannot be mitigated by the matrix-matched calibration method. The IS calibration method can compensate for both the ME and other variabilities among sample vials due to dilution, evaporation, and injection volume, therefore, an application of an IS calibration method, should be discussed to mitigate the measurement variance if necessary.
6. Recovery test using external, internal, and matrix-matched calibrationThe differences in pesticide recovery based on the calibration method is discussed. Table 4 shows the recoveries of the 25 pesticides from blank komatsuna samples. In the external calibration method, the RSD values for the analyte recovery were below 15%, but the recoveries of acephate, nitenpyram, methomyl, and thiacloprid were lower than 70% for at least one concentration level, which did not satisfy the MHLW-criteria17) (recovery 70–120%, RSD<25% at 0.0025 ng/kg, and RSD<15% at 0.01 and 0.04 ng/kg). The mean MEs on acephate-d3, nitenpyram-d3, methomyl-d3 and thiacloprid-d4 in blank komatsuna when the peak area was not compensated for by hexazinone-d6 were −2, −6, −9, and −15%, respectively (Supplemental Table S3). The recoveries of acephate and nitenpyram were not improved by changing the calibration method from external standard to IS or matrix-matched calibration. Therefore, the reason for this unsatisfactory recovery was not attributed to the ME. These pesticides are not the target analytes of the Japanese official method27); thus, the clean-up procedure may not be suitable to analyze acephate and nitenpyram from vegetable samples. The average recovery of methomyl and thiacloprid among the calibration methods was compared using Tukey’s multiple comparison test (T critical value=4.60 and 6.98 (p=0.05 and 0.01, respectively), n=5). The application of the matrix-matched calibration significantly improved the recovery of methomyl and thiacloprid (Fig. 4). Similarly, the application of an IS calibration significantly improved the recovery of methomyl and thiacloprid, except at 0.0025 mg/kg for thiacloprid. There was a significant difference between the recoveries calibrated using the IS and matrix-matched method for methomyl at 0.0025 and 0.01 mg/kg, and for thiacloprid at 0.01 and 0.04 mg/kg. There was no significant difference between the MEs on methomyl from that on methomyl-d3 and the MEs on thiacloprid were different from that on thiacloprid-d4 but only for 5% in blank komatsuna (Table 3). The difference in recovery between the two calibration methods may be because the pesticide and their corresponding SIL-IS exhibit similar magnitude of ME but are not physically identical; thus, SIL-IS compensated for the MEs but not as accurately as the matrix-matched calibration method using the blank sample which is identical to the test sample. This study also suggests that, in most cases, the use of the IS calibration method entailing the addition of low concentrations of SIL-ISs (0.0025 mg/kg) into samples delivers improved recoveries compared to those when an external calibration method entailing low to high concentrations is used.
Table 4. Average recovery and relative standard deviation (RSD) of the pesticides from blank komatsuna sample in five replicates (%). The bold values show the recovery or RSD that did not satisfied the Ministry of Health, Labour, and Welfare-criteria (recovery: 70–120%, RSD%<25% for 0.0025 mg/kg concentration level and RSD<15% in 0.01 and 0.04 mg/kg concentration level). The analytes are listed according to the order of retention time.
28)| No. | Pesticide | SIL-IS | Average recovery (RSD) (%) |
|---|
| External standard calibration | Internal standard calibration | Matrix-matched calibration |
|---|
| 0.0025 mg/kg | 0.01 mg/kg | 0.04 mg/kg | 0.0025 mg/kg | 0.01 mg/kg | 0.04 mg/kg | 0.0025 mg/kg | 0.01 mg/kg | 0.04 mg/kg |
|---|
| 1 | Acephate | Acephate-d3 | 0 | (—) | 0 | (—) | 0 | (—) | 0 | (—) | 0 | (—) | 0 | (—) | 0 | (—) | 0 | (—) | 0 | (—) |
| 2 | Dinotefuran | Dinotefuran-d3 | 85 | (4) | 80 | (4) | 71 | (2) | 91 | (4) | 88 | (3) | 85 | (5) | 92 | (4) | 90 | (4) | 81 | (2) |
| 3 | Nitenpyram | Nitenpyram-d3 | 43 | (8) | 51 | (6) | 45 | (12) | 48 | (10) | 48 | (7) | 45 | (17) | 51 | (7) | 55 | (6) | 47 | (11) |
| 4 | Methomyl | Methomyl-d3 | 63 | (5) | 69 | (2) | 66 | (2) | 82 | (4) | 85 | (4) | 86 | (5) | 93 | (4) | 96 | (2) | 91 | (2) |
| 5 | Thiamethoxam | Thiamethoxam-d3 | 85 | (6) | 90 | (3) | 82 | (3) | 82 | (11) | 89 | (6) | 93 | (7) | 95 | (6) | 94 | (3) | 85 | (3) |
| 6 | Imidacloprid | Imidacloprid-d4 | 86 | (3) | 86 | (3) | 81 | (2) | 92 | (4) | 90 | (3) | 89 | (4) | 94 | (3) | 94 | (3) | 90 | (2) |
| 7 | Clothianidin | Clothianidin-d3 | 86 | (11) | 84 | (4) | 77 | (3) | 96 | (5) | 85 | (7) | 90 | (6) | 99 | (11) | 96 | (4) | 88 | (3) |
| 8 | Acetamiprid | Acetamiprid-d3 | 93 | (1) | 91 | (1) | 86 | (1) | 93 | (5) | 90 | (3) | 95 | (5) | 100 | (1) | 98 | (1) | 92 | (1) |
| 9 | Thiacloprid | Thiacloprid-d4 | 72 | (10) | 70 | (2) | 68 | (1) | 88 | (7) | 84 | (2) | 85 | (2) | 89 | (11) | 94 | (2) | 92 | (1) |
| 10 | Cyanazine | Cyanazine-d5 | 93 | (3) | 94 | (2) | 92 | (3) | 91 | (3) | 95 | (3) | 95 | (4) | 97 | (3) | 97 | (2) | 95 | (3) |
| 11 | Propoxur | Propoxur-d3 | 86 | (3) | 88 | (2) | 86 | (3) | 89 | (4) | 89 | (2) | 92 | (5) | 96 | (3) | 94 | (2) | 91 | (3) |
| 12 | Atrazine | Atrazine-d5 | 92 | (1) | 95 | (2) | 90 | (1) | 92 | (2) | 93 | (2) | 94 | (2) | 100 | (1) | 100 | (2) | 95 | (1) |
| 13 | Diuron | Diuron-d6 | 91 | (3) | 90 | (2) | 85 | (1) | 91 | (3) | 90 | (2) | 90 | (1) | 98 | (3) | 96 | (2) | 91 | (1) |
| 14 | Boscalid | Boscalid-13C6 | 97 | (13) | 94 | (4) | 93 | (3) | 86 | (11) | 88 | (8) | 101 | (16) | 95 | (13) | 95 | (5) | 95 | (3) |
| 15 | Propyzamide | Propyzamide-d3 | 97 | (7) | 99 | (4) | 95 | (2) | NA | NA | NA | 97 | (8) | 100 | (4) | 96 | (2) |
| 16 | Fluxapyroxad | Fluxapyroxad-13C6 | 97 | (2) | 96 | (1) | 92 | (1) | 94 | (3) | 91 | (3) | 89 | (2) | 99 | (2) | 98 | (1) | 94 | (1) |
| 17 | Mepronil | Mepronil-13C, d3 | 98 | (1) | 98 | (3) | 92 | (2) | 93 | (3) | 90 | (6) | 92 | (10) | 100 | (1) | 101 | (3) | 95 | (2) |
| 18 | Triadimefon | Triadimefon-d4 | 102 | (3) | 99 | (3) | 96 | (2) | 98 | (6) | 96 | (4) | 96 | (6) | 105 | (3) | 100 | (3) | 97 | (2) |
| 19 | Fluopyram | Fluopyram-d4 | 101 | (2) | 97 | (2) | 94 | (1) | 97 | (2) | 92 | (3) | 95 | (2) | 100 | (2) | 100 | (2) | 98 | (1) |
| 20 | Prometryn | Prometryn-d7 | 94 | (4) | 94 | (2) | 94 | (1) | 93 | (4) | 91 | (2) | 95 | (2) | 98 | (4) | 97 | (2) | 97 | (1) |
| 21 | Tebuconazole | Tebuconazole-13C3 | 106 | (13) | 98 | (7) | 96 | (2) | 105 | (18) | 95 | (10) | 88 | (13) | 100 | (14) | 96 | (7) | 96 | (2) |
| 22 | Propiconazole | Propiconazole-d3 | 98 | (3) | 99 | (2) | 98 | (2) | NA | NA | NA | 95 | (3) | 99 | (2) | 98 | (2) |
| 23 | Hexaconazole | Hexaconazole-d7 | 98 | (2) | 95 | (2) | 93 | (2) | 91 | (5) | 89 | (4) | 89 | (5) | 97 | (2) | 97 | (2) | 95 | (2) |
| 24 | Pirimiphos-methyl | Pirimiphos-methyl-d6 | 96 | (2) | 95 | (2) | 96 | (3) | 93 | (4) | 92 | (3) | 96 | (3) | 97 | (2) | 96 | (2) | 97 | (3) |
| 25 | Flufenoxuron | Flufenoxron-d3 | 101 | (2) | 101 | (2) | 102 | (2) | 93 | (2) | 94 | (3) | 96 | (1) | 98 | (2) | 98 | (2) | 100 | (2) |
The abbreviations are as follows: Stable isotope-labeled (SIL), internal standard (IS), and not available (NA)
Conclusion
In this study, we demonstrated that the ME magnitudes of the 25 pesticides and their corresponding SIL-IS were similar in the blank komatsuna samples using t-tailed test. The number of an isotope substitution in the SIL-IS was not responsible for the significant difference in the MEs on the SIL-ISs of thiamethoxam, thiacloprid, diuron, boscalid, triadimefon and prometryn and those on the pesticides in this study. The MEs of four types of vegetable samples in LC-MS/MS pesticide analysis were evaluated by comparing the slopes of the matrix-matched and reagent-only calibrations. The result of the evaluation showed that substantial ion suppression (ME<−20%) was observed in the simultaneous analysis of pesticide residues in komatsuna, spinach, and tomato, but not in aubergine when a modified Japanese official method was used. No substantial ion enhancement (ME>20%) was observed in all cases. This study also revealed both the sampling and measurement variance in the MEs for the first time and suggests that the blank sample of a same cultivar which are cultivated in the same farmland to the test sample is recommended for compensation of the MEs using matrix-matched calibration method. The sampling ESD of the ME was below 10% for all combinations of the analyte and the four vegetables, except for acetamiprid-d3 and flufenoxuron-d3 in spinach. However, it was suggested that the average ME were significantly different between the samples in most of the analytes in komatsuna, spinach, and tomato, even sampling ESD were between 0.4–10%. The measurement ESDs of some pesticides were <4% in all the sample and the target analyte combinations. In such cases, compensating for the ME by using SIL-IS in every vial is recommended to obtain reliable results. This study demonstrated that the addition of a low concentration (0.0025 mg/kg) of SIL-IS to the final solution compensated for the MEs at varying concentrations and improved the recovery of methomyl and thiacloprid which suffer ion suppression in komatsuna. The findings of this study highlight the importance and limitations of compensating for the ME using an IS and/or the matrix-matched calibration method to achieve accurate and precise results in the simultaneous analysis of pesticide residues without changing the clean-up procedure of the ordinary official method. This study did not show a clear relationship between ME and tR of the analytes. Further understanding of the relationship between the magnitude of ME and the physicochemical properties of the target analytes may help in a selection of SIL-ISs which are available in the market and suitable for applying IS calibration method in screening analysis of pesticide residues in vegetable samples.
Acknowledgements
This work was supported by the Pesticide Science Research Grant from the Pesticide Science Society of Japan (2019) and KAKENHI (20K15493) (2020–2023). We acknowledge Keiko Goto and Manami Ochi (Research Institute of Environment, Agriculture, and Fisheries, Osaka, Japan) for their assistance with the laboratory experiments.
Electronic supplementary materials
The online version of this article contains supplementary material, which is available at https://www.jstage.jst.go.jp/browse/jpestics/
References
- 1) https://ec.europa.eu/food/plants/pesticides_en (Accessed 25 Oct., 2023)
- 2) N. Dubey, R. Shukla, A. Kumar, P. Singh and B. Prakash: Prospects of botanical pesticides in sustainable agriculture. Curr. Sci. 98, 479–480 (2010).
- 3) J. Popp, K. Pető and J. Nagy: Pesticide productivity and food security. A review. Agron. Sustain. Dev. 33, 243–255 (2013).
- 4) C. A. Damalas and I. G. Eleftherohorinos: Pesticide exposure, safety issues, and risk assessment indicators. Int. J. Environ. Res. Public Health 8, 1402–1419 (2011).
- 5) E. F. S. Authority, L. Carrasco Cabrera and P. Medina Pastor: The 2019 European Union report on pesticide residues in food. EFSA J. 19, e06491 (2021).
- 6) K. Fenner, S. Canonica, L. P. Wackett and M. Elsner: Evaluating pesticide degradation in the environment: blind spots and emerging opportunities. Science 341, 752–758 (2013).
- 7) https://www.eurl-pesticides.eu/userfiles/file/EurlALL/SANTE_11312_2021.pdf (Accessed 25 Oct., 2023)
- 8) J. Hajšlová and J. Zrostlíková: Matrix effects in (ultra)trace analysis of pesticide residues in food and biotic matrices. J. Chromatogr. A 1000, 181–197 (2003).
- 9) S. C. Queiroz, K. Lazou, P. Sandra and I. C. Jardim: Determination of pesticides in water by liquid chromatography-(electrospray ionization)-mass spectrometry (LC-ESI-MS). Pesticidas 14, 53–60 (2004).
- 10) L. Alder, K. Greulich, G. Kempe and B. Vieth: Residue analysis of 500 high priority pesticides: Better by GC-MS or LC-MS/MS? Mass Spectrom. Rev. 25, 838–865 (2006).
- 11) M. Riedel, K. Speer, S. Stuke and K. Schmeer: Simultaneous analysis of 70 pesticides using HPLC/MS/MS: A comparison of the multiresidue method of Klein and Alder and the QuEChERS method. J. AOAC Int. 93, 1972–1986 (2010).
- 12) A. Banno and Y. Yabuki: Simultaneous analysis of seven neonicotinoid pesticides in agricultural products involving solid-phase extraction and surrogate compensation using liquid chromatography-tandem mass spectrometry. J. Pestic. Sci. 45, 29–38 (2020).
- 13) T. Iwafune, T. Ogino and E. Watanabe: Water-based extraction and liquid chromatography-tandem mass spectrometry analysis of neonicotinoid insecticides and their metabolites in green pepper/tomato samples. J. Agric. Food Chem. 62, 2790–2796 (2014).
- 14) H. Trufelli, P. Palma, G. Famiglini and A. Cappiello: An overview of matrix effects in liquid chromatography-mass spectrometry. Mass Spectrom. Rev. 30, 491–509 (2011).
- 15) R. King, R. Bonfiglio, C. Fernandez-Metzler, C. Miller-Stein and T. Olah: Mechanistic investigation of ionization suppression in electrospray ionization. J. Am. Soc. Mass Spectrom. 11, 942–950 (2000).
- 16) P. Panuwet, R. E. Hunter Jr., P. E. D’Souza, X. Chen, S. A. Radford, J. R. Cohen, M. E. Marder, K. Kartavenka, P. B. Ryan and D. B. Barr: Biological matrix effects in quantitative tandem mass spectrometry-based analytical methods: advancing biomonitoring. Crit. Rev. Anal. Chem. 46, 93–105 (2016).
- 17) https://www.mhlw.go.jp/topics/bukyoku/iyaku/syoku-anzen/zanryu3/dl/101224-1.pdf (Accessed 25 Oct., 2023)
- 18) P. J. Taylor: Matrix effects: the Achilles heel of quantitative high-performance liquid chromatography-electrospray-tandem mass spectrometry. Clin. Biochem. 38, 328–334 (2005).
- 19) S. Kittlaus, J. Schimanke, G. Kempe and K. Speer: Assessment of sample cleanup and matrix effects in the pesticide residue analysis of foods using postcolumn infusion in liquid chromatography-tandem mass spectrometry. J. Chromatogr. A 1218, 8399–8410 (2011).
- 20) P. Adamowicz and W. Wrzesień: Simple approach for evaluation of matrix effect in the mass spectrometry of synthetic cannabinoids. J. Anal. Chem. 71, 794–802 (2016).
- 21) M. Anastassiades, S. J. Lehotay, D. Štajnbaher and F. J. Schenck: Fast and easy multiresidue method employing acetonitrile extraction/partitioning and “dispersive solid-phase extraction” for the determination of pesticide residues in produce. J. AOAC Int. 86, 412–431 (2003).
- 22) H. Stahnke, S. Kittlaus, G. Kempe and L. Alder: Reduction of matrix effects in liquid chromatography-electrospray ionization-mass spectrometry by dilution of the sample extracts: how much dilution is needed? Anal. Chem. 84, 1474–1482 (2012).
- 23) M. Cortese, M. R. Gigliobianco, F. Magnoni, R. Censi and P. Di Martino: Compensate for or minimize matrix effects? Strategies for overcoming matrix effects in liquid chromatography-mass spectrometry technique: a tutorial review. Molecules 25, 3047 (2020).
- 24) W. Jiao, Y. Xiao, X. Qian, M. Tong, Y. Hu, R. Hou and R. Hua: Optimized combination of dilution and refined QuEChERS to overcome matrix effects of six types of tea for determination eight neonicotinoid insecticides by ultra performance liquid chromatography-electrospray tandem mass spectrometry. Food Chem. 210, 26–34 (2016).
- 25) A. Kruve, A. Künnapas, K. Herodes and I. Leito: Matrix effects in pesticide multi-residue analysis by liquid chromatography-mass spectrometry. J. Chromatogr. A 1187, 58–66 (2008).
- 26) H. Kwon, S. J. Lehotay and L. Geis-Asteggiante: Variability of matrix effects in liquid and gas chromatography-mass spectrometry analysis of pesticide residues after QuEChERS sample preparation of different food crops. J. Chromatogr. A 1270, 235–245 (2012).
- 27) https://www.mhlw.go.jp/content/000473280.pdf (Accessed 25 Oct., 2023)
- 28) N. Besil, V. Cesio, H. Heinzen and A. R. Fernandez-Alba: Matrix effects and interferences of different citrus fruit coextractives in pesticide residue analysis using ultrahigh-performance liquid chromatography-high-resolution mass spectrometry. J. Agric. Food Chem. 65, 4819–4829 (2017).
- 29) N. S. Chatterjee, S. Utture, K. Banerjee, T. P. Ahammed Shabeer, N. Kamble, S. Mathew and K. Ashok Kumar: Multiresidue analysis of multiclass pesticides and polyaromatic hydrocarbons in fatty fish by gas chromatography tandem mass spectrometry and evaluation of matrix effect. Food Chem. 196, 1–8 (2016).
- 30) I. R. Pizzutti, J. V. Dias, A. Kok, C. D. Cardoso and G. M. Vela: Pesticide residues method validation by UPLC-MS/MS for accreditation purposes. J. Braz. Chem. Soc. 27, 1165–1176 (2016).
- 31) R. D. O. Silva, M. G. De Menezes, R. C. De Castro, C. D. A. Nobre, M. A. Milhome and R. F. Do Nascimento: Efficiency of ESI and APCI ionization sources in LC-MS/MS systems for analysis of 22 pesticide residues in food matrix. Food Chem. 297, 124934 (2019).
- 32) X. Mao, W. Xiao, Y. Wan, Z. Li, D. Luo and H. Yang: Dispersive solid-phase extraction using microporous metal-organic framework UiO-66: Improving the matrix compounds removal for assaying pesticide residues in organic and conventional vegetables. Food Chem. 345, 128807 (2021).
- 33) J. N. Miller and J. C. Miller: “Statistics and chemometrics for analytical chemistry,” translated by M. Munemori and H. Sato, Kyoritsu Publication, Tokyo, 2004. (in Japanese)
- 34) Y. Kitamura: Theory and evaluation methods related to calibration curves, in Research report of agricultural chemicals. 101–106 (2016) (in Japanese).
- 35) H. G. Mol, P. Plaza-Bolaños, P. Zomer, T. C. de Rijk, A. A. Stolker and P. P. Mulder: Toward a generic extraction method for simultaneous determination of pesticides, mycotoxins, plant toxins, and veterinary drugs in feed and food matrixes. Anal. Chem. 80, 9450–9459 (2008).


