Research Papers
Association of molecular markers with cold tolerance and green period in zoysiagrass (Zoysia Willd.)
2012 Volume 62 Issue 4 Pages 320-327
Details
2012 Volume 62 Issue 4 Pages 320-327
Cold tolerance and the green period are key traits in the breeding of zoysiagrass (Zoysia Willd.). Identification of molecular markers associated with cold tolerance and the green period of zoysiagrass will contribute to efficient selection of elite cultivars. These two traits were measured in 96 zoysiagrass accessions in 2004 and 2005–2006, respectively. The mapping population was screened with 29 pairs of simple sequence repeat (SSR) primers and 54 pairs of sequence-related amplified polymorphism (SRAP) primers. A multi-loci in silico mapping approach implemented with an empirical Bayes method was applied for association mapping of cold tolerance and green period. We detected 254 SSR polymorphic loci and 338 SRAP polymorphic loci, among which three SSR loci (Xgwm131-3B-187, Xgwm469-6D-194 and Xgwm234-5B-244) and one SRAP locus (Me11Em7-406) were significantly associated with cold tolerance with effect values of 57.83%, 38.05%, 36.92% and 37%, respectively. Three SSR loci (Xgwm132-6B-225, Xgwm111-7D-34 and Xgwm102-2D-97) and two SRAP loci (Me19Em5-359 and Me16Em8-483) were significantly associated with the green period with effect values of 79.54%, 62.59%, 99.04%, 49.01% and 82.57%. These markers will be useful for genetic improvement of the cold tolerance and green period of zoysiagrass by marker-assisted breeding.
Zoysiagrass (Zoysia Willd.) is a popular warm-season turf-grass grown worldwide for ornamental lawns, sports and recreational turf and soil conservation (Engelke and Anderson 2002). Cold tolerance is a key factor in determining where turfgrass can be grown successfully and the green period (the period in which at least 50% of the leaves are green) is one of the most important indices of turf quality. Numerous studies have investigated the cold tolerance and green period of zoysiagrass (Dunn et al. 1999, Gusta et al. 1980, Li et al. 2003, Patton and Richer 2007, Shahba et al. 2003, Xuan et al. 2008, 2009, Zhang and Xiao 1997). These studies demonstrated that considerable genetic variation in the cold tolerance and green period of zoysiagrass exists among different species, cultivars, germplasm resources of a single species and even different organs of one genotype. Some elite cultivars grown for high-quality turf are sensitive to low temperature or have a short green period. Development of new cultivars that combine the characteristics of high-quality turf, good cold tolerance and a long green period is a major objective for turfgrass breeders.
A useful approach to assist in breeding for cold tolerance and a long green period is simply to select inherited genetic markers that are associated with the two traits and use them as indirect selection criteria for marker-assisted breeding. Previous investigations have indicated that the zoysiagrass response to low temperature is a complex phenomenon controlled by more than one gene. Quantitative trait loci (QTL) associated with leaf color and cold tolerance have been analyzed. Yaneshita et al. (1997) constructed a restriction fragment length polymorphism linkage map of Zoysia using self-pollinated progenies from an interspecific hybrid. Four genetic regions associated with winter leaf color were identified. Li et al. (2009) constructed a simple sequence repeat (SSR) linkage map of Zoysia japonica using 86 individuals derived from a cross between the cultivars ‘Muroran’ and ‘Tawarayama Kita’ and Ding et al. (2010) detected three QTLs associated with soluble protein content, soluble sugar content and superoxide dismutase activity under cold treatment. These reports represent the first step in the development of a marker-assisted breeding program to improve cold tolerance and the green period in Zoysia; however, to realize marker-assisted breeding, knowledge of the mechanisms and markers associated with these two traits is required.
We collected 170 Zoysia accessions in China, Japan and the USA between 1995 and 2001 and evaluated the turf quality, cold tolerance, green period and genetic diversity in some or all of these materials (Guo et al. 2009, Xuan et al. 2008, 2009). Considerable variation in these traits existed among the accessions and a high level of genetic diversity as measured by Nei’s genetic diversity index (H; 0.2409) and Shannon’s diversity index (I; 0.3746) was revealed by sequence-related amplified polymorphism (SRAP) markers (Guo et al. 2009). Association analysis is a powerful tool with which to study the inheritance of quantitative traits in plants. The method enables identification of QTL responsible for complex traits in a genetically diverse population based on linkage disequilibrium between QTL and molecular markers (Flint-Garcia et al. 2003). QTL related to yield, agronomic traits and the heading stage of barley, rice and maize, respectively, have been analyzed by means of association mapping. In each instance, the QTL identified in association mapping were consistent with those previously identified by linkage analysis of QTL mapping, which indicated that both linkage analysis and association analysis are able to detect QTL for complex traits (Kraakman et al. 2004, Parisseaux and Bernardo 2004, Zhang et al. 2005).
In the present study, association analysis was conducted to identify SSR and SRAP markers that are closely associated with cold tolerance and the green period in zoysiagrass and to provide a theoretical basis for molecular marker-assisted breeding of new cultivars with a long green period and improved cold tolerance.
Ninety-six Zoysia accessions, comprising 85 accessions from China, seven cultivars and one accession from the USA and three accessions from Japan, were randomly selected from 170 accessions (Supplemental Table 1). The seed or vegetatively propagated accessions or cultivars were collected during 1995–2001 and planted in an experimental field of the Institute of Botany, Jiangsu Province and Chinese Academy of Sciences (32°02′N, 118°28′E; elevation 30 m). Approximately 8 g seeds were sown in the 1 m2 seeded plots and approximately 130–150 sprigs with two nodes were planted in the 1 m2 plot for the vegetatively propagated accessions or cultivars. The plots were spaced 50 cm apart and maintained by trimming weekly or biweekly to prevent possible mixing among the accessions. The plots were frequently mowed at a height of 50 mm to ensure that the turf remained healthy and developed newly expanded leaf blades. Irrigation, fertilization and fungicide were applied as required to maintain turf health.
Evaluation of cold toleranceThe cold tolerance of the 96 accessions was determined based on the leaf electrolyte leakage rate reported by Xuan et al. (2009) in June–July 2004. The semi-lethal temperature (LT50) for different Zoysia species ranges from −1.9°C to −10.4°C with an average LT50 of 6.4°C (Table 1).
| Trait | Average | Variance range | CV (%) | Variance | Skewness | Kurtosis |
|---|---|---|---|---|---|---|
| Cold tolerance (°C) | 6.40 | −1.90–−10.40 | 27.81 | 3.16 | 0.52 | −0.04 |
| Green period (days) | 211.29 | 186.00–251.00 | 7.97 | 283.60 | 0.84 | −0.56 |
The green period refers to the period from the returning green date to the withering date. The returning green date refers to the date in early spring when 50% of the total leaves are green and the withering date is when 50% of the leaves have turned brown. The returning green and withering dates of the accessions were observed in 2005 and 2006, respectively (Xuan et al. 2008). The green period of the different accessions ranged from 186 to 251 days with an average of 211.29 days (Table 1).
DNA extractionGenomic DNA was extracted from fresh leaves of each accession using a Plant Genomic DNA Extraction Kit (Yuanpinghao Biotech Co. Ltd., Tianjin, China). The quality of the extracted DNA was verified by 1% agarose gel electrophoresis. The DNA samples were stored at −20°C.
Molecular analysisTwenty-nine pairs of SSR primers (Röder et al. 1998) and 54 pairs of SRAP primer combinations (Li and Quiros 2001) were used (Table 2 and Supplemental Table 2). The primers were synthesized by Shanghai Bioasia Corporation (Shanghai, China) and dNTPs, 10× PCR buffer, Mg2+ and Taq DNA polymerase were purchased from the Nanjing Shenergy Biocolor Company (Nanjing, China). Standard DNA analytical products were purchased from Nanjing TaKaRa Company (Nanjing, China). SSR-PCR was performed in a total volume of 10 μL containing 50 ng genomic DNA, 1 μL 10× PCR buffer, 2.5 mmol·L−1 MgCl2, 200 μmol·L−1 dNTPs, 1.2 μmol·L−1 primer and 0.5 U Taq DNA polymerase. PCR reactions were performed in a Techne TC-412 PCR thermal cycler (Bibby Scientific, Stone, United Kingdom) using the following procedure: pre-denaturation at 94°C for 3 min, followed by 35 cycles of denaturation at 94°C for 50 s, annealing at 54°C for 30 s and extension at 72°C for 1 min; then final extension at 72°C for 7 min and storage at 4°C. SRAP-PCR was performed in a total volume of 10 μL containing 50 ng genomic DNA, 1 μL of 10× PCR buffer, 1.5 mmol·L−1 MgCl2, 200 μmol·L−1 dNTPs, 0.2 μmol·L−1 primer and 0.5 U Taq DNA poly-merase. Amplifications were performed with the following procedure: pre-denaturation at 94°C for 4 min, followed by five cycles of denaturation at 94°C for 1 min, annealing at 37°C for 1 min and extension at 72°C for 10 s; then 35 cycles were performed with 1 min denaturation at 94°C, 1 min annealing at 50°C and extension at 72°C for 10 s and then final extension at 72°C for 7 min and storage at 4°C. The PCR products were separated on 8% (SSR-PCR) or 10% (SRAP-PCR) polyacrylamide gels in 1× TBE buffer (pH 8.0) and the gels were stained with fast silver stain.
| PCa | BNb | PC | BN | PC | BN | PC | BN | PC | BN |
|---|---|---|---|---|---|---|---|---|---|
| Xgwm408-5B | 1–12 | Xgwm337-1D | 141–148 | Me18Em2 | 278–285 | Me7Em6 | 360–366 | Me9Em8 | 461–465 |
| Xgwm47-2B | 13–21 | Xgwm44-7D | 149–159 | Me1Em3 | 286–291 | Me8Em6 | 367–373 | Me13Em8 | 466–478 |
| Xgwm111-7D | 22–35 | Xgwm445-2D | 160–169 | Me3Em3 | 292–297 | Me9Em6 | 374–382 | Me16Em8 | 479–490 |
| Xgwm133-6B | 36–47 | Xgwm459-6A | 170–179 | Me6Em3 | 298–303 | Me15Em6 | 383–385 | Me14Em9 | 491–497 |
| Xgwm126-5A | 48–60 | Xgwm131-3B | 180–188 | Me14Em3 | 304–307 | Me16Em6 | 386–390 | Me6Em9 | 498–504 |
| Xgwm183-3D | 61–73 | Xgwm484-2D | 189–193 | Me2Em4 | 308–309 | Me17Em6 | 391–392 | Me15Em9 | 505–519 |
| Xgwm46-7B | 74–84 | Xgwm469-6D | 194–205 | Me11Em4 | 310–315 | Me18Em6 | 393–397 | Me19Em9 | 520–526 |
| Xgwm52-3D | 85–86 | Xgwm154-5A | 206–214 | Me14Em4 | 316–318 | Me7Em7 | 398–401 | Me20Em19 | 527–535 |
| Xgwm249-2D | 87–90 | Xgwm149-4B | 215–223 | Me17Em4 | 319–321 | Me11Em7 | 402–408 | Me4Em10 | 536–543 |
| Xgwm120-2B | 91–93 | Xgwm132-6B | 224–233 | Me19Em4 | 322–328 | Me15Em7 | 409–412 | Me9Em10 | 544–545 |
| Xgwm102-2D | 94–97 | Xgwm129-5A | 234–243 | Me2Em5 | 329–333 | Me17Em7 | 413–419 | Me13Em10 | 546–552 |
| Xgwm350-7A | 98–101 | Xgwm234-5B | 244–254 | Me3Em5 | 334–341 | Me1Em8 | 420–427 | Me14Em10 | 553–560 |
| Xgwm37-7D | 102–105 | Me18Em1 | 255–258 | Me5Em5 | 342–345 | Me3Em8 | 428–432 | Me16Em10 | 561–572 |
| Xgwm210-2D | 106–114 | Me19Em1 | 259–265 | Me11Em5 | 346–348 | Me4Em8 | 433–438 | Me17Em10 | 573–587 |
| Xgwm344-7B | 115–126 | Me7Em2 | 266–272 | Me13Em5 | 349–353 | Me6Em8 | 439–441 | Me19Em10 | 588–592 |
| Xgwm135-1A | 127–132 | Me10Em2 | 273–275 | Me17Em5 | 354–355 | Me7Em8 | 442–449 | ||
| Xgwm60-7A | 133–140 | Me11Em2 | 276–277 | Me19Em5 | 356–359 | Me8Em8 | 450–460 |
The population structure was first inferred before association analysis on the basis of a cluster dendrogram including the 96 accessions derived from the SSR and SRAP marker data. Only clear and unambiguous polymorphic bands were scored for the analysis. SSR and SRAP fragments for each primer were scored as either present (1) or absent (0). A pairwise similarity matrix was computed from which a dendrogram was constructed using the unweighted pair-group method with arithmetical averages with NTSYS 2.1 (Rohlf 2000).
Multi-QTL mapping methodThe multi-QTL mapping approach proposed by Lü et al. (2011) was used to detect QTL. The method is described briefly here; for additional details the reader is referred to Lü et al. (2011).
Zoysia are outbreeding species with high genetic heterogeneity; thus, a high level of genetic diversity existed among the different accessions analyzed in this study. The genetic diversity was reflected in the polymorphic bands amplified by each primer. A total of 592 polymorphic bands were observed; therefore, if one putative QTL was located on each amplified fragment, 592 putative QTL would be included in the multi-QTL genetic model of Lü et al. (2011). All QTL effects were estimated with an empirical Bayes method (Lü et al. 2011). All non-zero effects were used to perform a likelihood ratio test with a critical value of 2.4.
A total of 282 unambiguous bands were amplified by the 29 pairs of SSR primers, of which 254 bands were polymorphic (96.45%) (Table 2) and ranged in size from 50 to 1000 bp. The number of polymorphic fragments for each SSR primer combination varied from two (Xgwm52-3D) to 14 (Xgwm111-7D), with an average of 8.75 fragments per primer combination. A total of 362 unambiguous bands were amplified by the 54 SRAP primer combinations, of which 338 bands were polymorphic (93.09%) (Table 3) and ranged in size from 50 to 1000 bp. The number of polymorphic fragments for each SRAP primer combination varied from two (Me11/Em2, Me2/Em4, Me17/Em5, Me17/Em6 and Me9/Em10) to 15 (Me15/Em9 and Me17/Em10), with an average of 6.3 fragments per primer combination. The number of fragments amplified by all SSR and SRAP primers among different accessions varied considerably, with the number amplified in a single accession ranging from 155 to 345. The total number of bands for each accession analyzed is listed in Supplemental Table 1.
| Marker locus | Effect index | Effect and LOD values in different classification scenarios (%)a | |||||
|---|---|---|---|---|---|---|---|
| PD | NTSYS2 | NTSYS3 | NTSYS4 | NTSYS5 | NTSYS6 | ||
| Xgwm131-3B-187 | Effect value | 64.83 | 62.37 | 62.68 | 54.77 | 47.79 | 54.54 |
| LOD valueb | 9.1745 | 11.1916 | 11.3157 | 8.3148 | 7.0023 | 8.8103 | |
| Xgwm469-6D-194 | Effect value | 48.89 | 31.27 | 31.97 | 34.61 | 38.91 | 42.66 |
| LOD value | 6.9500 | 4.0026 | 4.1430 | 4.7482 | 5.9676 | 6.5833 | |
| Xgwm234-5B-244 | Effect value | 50.63 | 37.79 | 38.22 | 34.66 | 35.75 | 24.47 |
| LOD value | 7.5044 | 4.7026 | 4.7979 | 4.6710 | 5.2224 | 2.4858 | |
| Me11Em7-406 | Effect value | 33.18 | 38.23 | 38.78 | 36.19 | 47.06 | 28.56 |
| LOD value | 3.7359 | 5.4337 | 5.5675 | 5.0101 | 8.3796 | 3.4023 | |
| Xgwm111-7D-29 | Effect value | / | / | / | / | 0.1719 | / |
| LOD value | / | / | / | / | 2.1531 | / | |
| Xgwm 44-7D-156 | Effect value | / | / | / | / | / | 0.2207 |
| LOD value | / | / | / | / | / | 2.4589 | |
| Xgwm 459-6A-170 | Effect value | / | / | / | / | / | 0.1814 |
| LOD value | / | / | / | / | / | 2.0660 | |
| Xgwm 131-3B-181 | Effect value | / | 0.1781 | 0.1798 | / | / | 0.2505 |
| LOD value | / | 1.9272 | 1.9434 | / | / | 2.6822 | |
| Xgwm 234-5B-247 | Effect value | 0.3926 | / | / | / | / | / |
| LOD value | 4.4632 | / | / | / | / | / | |
| Xgwm 234-5B-251 | Effect value | / | / | / | 0.2342 | 0.2609 | / |
| LOD value | / | / | / | 1.8941 | 2.0933 | / | |
| Me6Em3-298 | Effect value | / | / | / | / | / | / |
| LOD value | / | / | / | / | / | / | |
| Me17Em4-319 | Effect value | 0.1657 | / | / | / | / | / |
| LOD value | 1.8350 | / | / | / | / | / | |
| Me11Em5-346 | Effect value | 0.2114 | / | / | / | / | / |
| LOD value | 2.1685 | / | / | / | / | / | |
| Me11Em5-347 | Effect value | / | / | / | / | 0.1630 | / |
| LOD value | / | / | / | / | 1.8947 | / | |
| Me15Em9-513 | Effect value | / | / | / | / | 0.1769 | / |
| LOD value | / | / | / | / | 2.1288 | / | |
In order to eliminate false-positives caused by population structure, the population structure of the 96 accessions was analyzed first by cluster analysis with NTSYS 2.1 based on the 592 polymorphic SSR and SRAP markers. Accessions of the same species were not always clustered into one group (Fig. 1). Most accessions of Z. japonica and Z. sinica were clustered into one group and most accessions of Z. matrella and Z. tenuifolia were grouped together, but four accessions of Z. matrella were grouped with accessions of Z. japonica and Z. sinica. Accessions of Z. machrostachya (Z010) and Z. sinica. var. nipponica (Z122) showed relatively high genetic similarity and Z122 was grouped with an accession of Z. japonica (Z115). Z010 was placed in a subgroup of Z. matrella accessions. On the basis of the cluster dendrogram, the 96 accessions were classified into two to six sub-populations, as defined by the lines L1, L2, L3, L4 and L5 in Fig. 1.
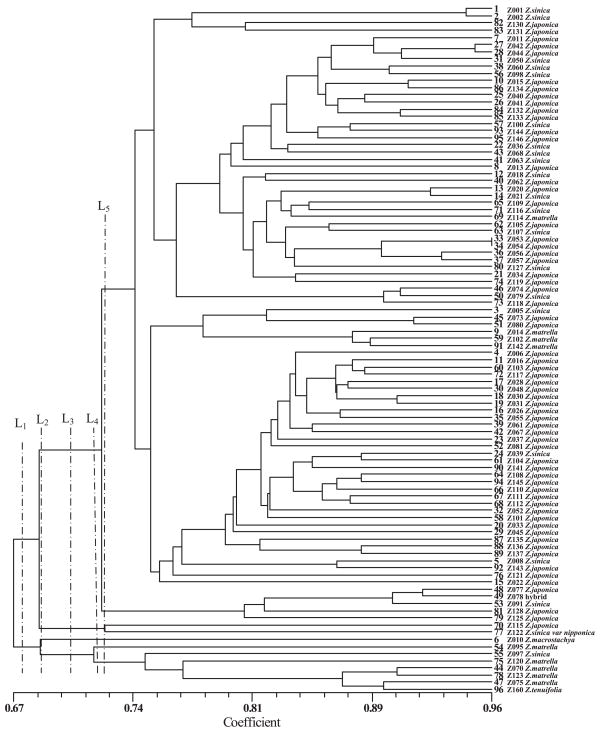
Cluster dendrogram of 96 zoysia accessions derived from SSR and SRAP marker data. The samples were classified into two to six sub-populations (indicated by the lines L1, L2, L3, L4 and L5, respectively).
A multi-loci in silico mapping approach was used to analyze the association of cold tolerance and the green period with the 254 SSR marker loci and 338 SRAP marker loci for the 96 accessions under six scenarios, namely the preliminary data (no population structure was assumed) and five scenarios in which the accessions were classified into two to six subpopulations. Fifteen marker loci were associated with cold tolerance (Table 3) and seven marker loci were associated with the green period (Table 4) with a LOD threshold of 2.4 in one or more classification scenarios. Among these loci, Xgwm131-3B-187, Xgwm469-6D-194, Xgwm234-5B-244 and Me11Em7-406 were all associated with cold tolerance in the six classification scenarios, with effect values of 47.79–64.83%, 31.27–48.89%, 24.47–50.63% and 28.56–47.06% and mean effects of 57.83%, 38.05%, 36.92% and 37%, respectively (Table 3). The marker locus Xgwm132-6B-225 was associated with the green period in the six classification scenarios with effect values of 48.51–98.24% and a mean effect of 79.54%. The marker loci Xgwm111-7D-34 and Me19Em5-359 were associated with the green period in five scenarios (excluding the sixth population scenario) and the marker locus Xgwm102-2D-97 was associated with the green period in five scenarios (excluding the second population scenario); the ranges of effect values in different classification scenarios for these three loci were 49.77–108.78%, 82.66–128.76% and 30.65–70.18% with average effects of 62.59%, 99.04% and 49.01%, respectively. The marker locus Me16Em8-483 exhibited a significant association with the green period in four scenarios, with effect values ranging from 78.14 to 87.47% and an average effect of 82.57% (Table 4). Eleven markers (Xgwm111-7D-29, Xgwm44-7D-156, Xgwm459-6A-170, Xgwm131-3B-181, Xgwm234-5B-247, Xgwm234-5B-251, Me6Em3-298, Me17Em4-319, Me11Em5-346, Me11Em5-347 and Me15Em9-513) were associated with cold tolerance and two markers (Me18Em1-258 and Xgwm111-7D-35) were associated with the green period in only one to three scenarios; their corresponding effect values were relatively low and so they require further study in the future.
| Marker locus | Effect index | Effect and LOD values in different classification scenarios (%)a | |||||
|---|---|---|---|---|---|---|---|
| PD | NTSYS2 | NTSYS3 | NTSYS4 | NTSYS5 | NTSYS6 | ||
| Xgwm132-6B-225 | Effect value | 98.2406 | 93.2255 | 83.8477 | 79.0975 | 74.2881 | 48.5142 |
| LOD valueb | 35.0189 | 35.8957 | 30.2078 | 27.8028 | 24.9249 | 17.0597 | |
| Xgwm111-7D-34 | Effect value | 108.7786 | 51.6155 | 49.7738 | 51.5910 | 51.1867 | / |
| LOD value | 43.6171 | 11.6639 | 11.4626 | 12.5827 | 12.5295 | / | |
| Me19Em5-359 | Effect value | 128.7573 | 82.6624 | 94.2179 | 94.5319 | 95.0466 | / |
| LOD value | 62.1712 | 30.6400 | 40.4845 | 41.9178 | 42.7840 | / | |
| Xgwm102-2D-97 | Effect value | 70.1827 | / | 47.1381 | 48.8265 | 48.2772 | 30.6498 |
| LOD value | 20.2235 | / | 11.3625 | 12.4411 | 12.3045 | 8.0491 | |
| Me16Em8-483 | Effect value | / | 87.4651 | 82.6829 | 78.1395 | 81.9773 | / |
| LOD value | / | 32.6587 | 30.4267 | 28.1032 | 31.1136 | / | |
| Xgwm111-7D-35 | Effect value | / | 57.7778 | / | / | / | / |
| LOD value | / | 15.7874 | / | / | / | / | |
| Me18Em1-258 | Effect value | 79.0763 | / | / | / | / | / |
| LOD value | 24.6668 | / | / | / | / | / | |
Guo et al. (2009a, 2009b) studied the heritability of cold tolerance and the green period in two Zoysia Fl segregating populations derived from reciprocal crosses between two Zoysia lines and found that cold tolerance was controlled by two equal additive major genes and the heritability of the genes was 77.27% and 79.60%, respectively, in the direct and reciprocal crosses. The maternal genetic and environmental effects on the green period were both significant and differed between the genetic models for the two reciprocal crosses; no single major gene model was the most suitable for the green period in the direct cross and a model with two equal additive major genes was the most suitable for the reciprocal cross. In the present study, 96 zoysiagrass accessions collected from a variety of provenances were selected for analysis of molecular markers associated with cold tolerance and the green period using an association mapping method. Four molecular markers were significantly associated with cold tolerance and five molecular markers were significantly associated with the green period. Based on the results of these two studies, the preliminary conclusion was that a number of major genes control the cold tolerance and green period of zoysiagrass, but some major genes associated with the green period may not be expressed because of maternal genetic effects in some cross combinations. This conclusion provides a scientific basis for marker-associated breeding of cold tolerance and the green period in zoysiagrass.
In association mapping in plants, the stratification of sub-populations will intensify linkage disequilibrium. In other words, population stratification and unequal distribution of alleles can result in false-positive associations (Flint-Garcia et al. 2003). To overcome this problem, six population-structure scenarios were considered and the results stable across the six scenarios are reported here. A total of 592 SSR and SRAP marker loci were analyzed with a threshold LOD ≥ 2.4 for declaration of the presence of a putative QTL in a given genomic region, of which 15 marker loci were associated with cold tolerance and seven marker loci were associated with the green period. However, the relationship between these markers and cold tolerance or the green period differed under different classification scenarios; some markers were associated with cold tolerance or the green period in all scenarios, or in four or five scenarios with high effect values, whereas some markers were associated with these traits only in one or two scenarios and with relatively low effect values. On the basis of association and effect values, the marker loci Xgwm131-3B-187, Xgwm469-6D-194, Xgwm234-5B-244 and Me11Em7-406 were most strongly associated with cold tolerance and the marker loci Xgwm132-6B-225, Xgwm111-7D-34, Me19Em5-359, Xgwm102-2D-97 and Me16Em8-483 were most strongly associated with the green period. The markers associated with either trait only in one or two scenarios and with low effect values were indicated to be possible false-positive markers. The remaining 570 markers were not associated with cold tolerance or the green period in any classification scenario. The above results showed that analysis under different population structure scenarios could help verify the results obtained for individual classification scenarios and enable the elimination of false-positive results.
The results of population structure analysis for the 96 zoysiagrass accessions showed that the accessions for a given species were not always clustered into one group and mixed-species clustering was observed among the six species. This result may be related to the flowering habit and pollination system of Zoysia. Previous research has shown that zoysiagrass flowers initially exhibit protogyny followed by protandry and that the frequency of selfing is low (0–54%, mean 16.15%; Guo et al. 2001). Many studies have demonstrated that natural hybridization is common among species of Zoysia (Forbes 1952, Hong and Yearn 1985, Lee et al. 1994, Yaneshita et al. 1999). The high frequency of outcrossing results in high intraspecific genetic diversity and strong interspecific genetic similarity among Zoysia species. Thus, continuous variation in morphological traits and mixed-species clustering at the molecular level were observed among the accessions analyzed in the present study.
A major goal for turfgrass breeders is to raise novel cultivars that possess good cold tolerance and a relatively long green period. Previously, we studied the relationship between cold tolerance and the green period or withering date for 11 zoysiagrass accessions and found that cold tolerance is not significantly associated with either the green period or withering date (Guo et al. 2006); however, because the sample size of 11 accessions was small and several studies of different species have shown that winter hardiness and fall dormancy are genetically related (Brummer et al. 2000, Lyons et al. 1973), this was studied further. In the present study, the markers associated with cold tolerance and the green period were analyzed for the same germplasm population and for both traits, but no marker was associated with cold tolerance and the green period simultaneously. On the basis of observations of the cold tolerance and green period phenotypes of 96 zoysiagrass accessions (Supplemental Table 1), we analyzed the correlation between the two traits with SPSS 13.0 software. The results showed that no significant correlation existed between LT50 and the green period of the accessions (r = 0.198, P = 0.054). Yaneshita et al. (1997) reported that the expression of winter leaf color in Zoysia was the result of several physiological responses to low temperature, including photosynthetic activity and cold acclimation; thus, cold tolerance and green period were partially correlated.
The relationship between fall dormancy and winter hardiness has been studied extensively in alfalfa, but different results have been obtained in different studies, including high positive phenotypic correlations (Schwab et al. 1996), moderate phenotypic correlations (Brummer et al. 2000, Perry et al. 1987), or no genetic correlations (Busbice and Wilsie 1965). Brummer et al. (2000) explained these results by means of a model for dormancy × winter hardiness interactions, and suggested that two types of genes are operative: (i) major genes that determine whether a significant acclimation response will be activated; and (ii) minor genes that modulate the level of winter hardiness by altering the timing and mechanisms of acclimation. Using this model, dormant plants carry alleles that initiate all pathways leading to winter hardiness, and non-dormant plants show extreme contrasts in alleles. When all plants are dormant, the expression of the alleles differs in timing, duration and level, so the relationship between autumn growth and winter hardiness will be obscure and in many instances the correlation will be low or not significantly different from zero. We consider that the model of Brummer et al. (2000) can be applied to explain our present results. In Zoysia, all plants experience dormancy and acclimation, but the expression of alleles differs; thus, the green period and cold tolerance vary among accessions, leading to differences in the relationship between the two traits in different populations analyzed and even in different locations. In the present study, the molecular markers associated with cold tolerance were totally different from those markers associated with the green period and no overlap was detected. This finding indicated that certain genes control cold tolerance or the green period independently; therefore, we infer that concurrent selection for both cold tolerance and a long green period should be possible on the basis of phenotypic and molecular marker analyses and the model for dormancy × winter hardiness interactions (Brummer et al. 2000).
This study was supported by the National Science Foundation of China (no. 30571307).