Abstract
Adaptation of wheat (Triticum aestivum L.) to high temperatures could be improved by introducing alien genes from wild relatives. We evaluated the responses of wheat-Leymus racemosus chromosome introgression lines to high temperature to determine their potentiality for developing improved wheat cultivars. Introgression lines and their parent Chinese Spring were evaluated in a growth chamber at the seedling stage and in the field at the reproductive stage in two heat-stressed environments in Sudan. Optimum and late planting were used to ensure exposure of the plants to heat stress at the reproductive stage. The results revealed the impact of several Leymus chromosomes in improving wheat adaptation and tolerance to heat. Three lines possessed enhanced adaptation, whereas two showed high heat tolerance. Two addition lines showed a large number of kernels per spike, while one possessed high yield potential. Grain yield was correlated negatively with the heat susceptibility index, days to heading and maturity and positively with kernel number per spike and triphenyl tetrazolium chloride assay under late planting. The findings suggest that these genetic stocks could be used as a bridge to introduce the valuable Leymus traits into a superior wheat genetic background, thus helping maximize wheat yield in heat-stressed environments.
Introduction
Wheat is the most important staple food for the majority of the world’s population. Due to the current rapid exponential growth of the world population, an urgent expansion of the wheat production area and an increase in wheat productivity by unit area is therefore needed. Biotic and abiotic stresses and nutrient deficiencies are the biggest constraints of crop production.
Heat stress is considered one of the major factors limiting wheat production in tropical and subtropical environments. In these areas, high temperatures are known to affect crop development at all stages, imposing morphological and physiological changes that result in considerable grain yield loss (Al-Khatib and Paulsen 1990, Tahir et al. 2005, 2006, Tewolde et al. 2006). The optimum temperature for wheat growth and yield is within the range 18–24°C. Stone and Nicolas (1994) reported that even a short period (5–6 days) of exposure to temperatures of 28–32°C can result in significant decreases in yield of 20% or more. All plant processes are sensitive to and can be irreversibly damaged by heat. Elevated temperatures accelerate senescence, diminish the viable leaf area duration and reduce photosynthetic activities (Harding et al. 1990, Nagarajan et al. 1998). Heat stress also affects thylakoid membranes and leads to a loss in the number of chloroplasts per cell (Hurkman and Tanaka 1987). Accordingly, development of heat-tolerant cultivars is of major concern in wheat breeding programs.
Yield and its components are used widely as criteria for determining the heat tolerance of wheat (Khana-Chopra and Viswanathan 1999, Reynolds et al. 1994). Although expensive to obtain, they are crucial measures of productivity in stressful environments and highly applicable for comparing cultivars (Hede et al. 1999, Reynolds et al. 1994). Chlorophyll content (Alkhatib and Paulsen 1990), chlorophyll fluorescence (Moffate et al. 1990, Smillie and Hethering 1983) and triphenyl tetrazolium chloride (TTC) cell viability assay (Porter et al. 1994) are among the physiological parameters used widely to evaluate heat stress tolerance in wheat.
The production and release of modern wheat cultivars after the green revolution enabled an expansion of wheat production in areas that experience heat stress, such as West Asia and North Africa. Despite the success of these cultivars, we remain far from solving the global food problem. To achieve a breakthrough in wheat breeding for stress tolerance and nutrient deficiency, development of new technologies and ideas is required. One of the possible ways is to discover and explore novel genes existed within the wheat gene pool, especially, the wild wheat relatives proved to be valuable gene sources for several important traits and contribute to increasing the available genetic diversity for development of new cultivars.
Several studies have revealed the significance of utilizing wheat alien genes to improve wheat abiotic stresses (heat, salt and drought), diseases, kit-nematode resistance, nutrient use efficiency, grain yield and bread making quality (Cox et al. 1995, Dreccer et al. 2004, Eastwood et al. 1994, Garg et al. 2009, Gatford et al. 2002, Jiang et al. 1994, Wang et al. 2010), with the aid of powerful molecular biology and cytogenetic techniques.
Wild relatives of wheat such as Leymus species are a great source of alien genes. Leymus is a genomically defined, allopolyploid, Triticeae genus (2n = 28 or 56; genome NsNsXmXm or NsNsNsNsXmXmXmXm), consisting of about 30 species worldwide. Leymus racemosus (2n = 28, NsNsXmXm) is a perennial grass that grows along sea coasts and in inland dry areas including saline or alkaline lands, dry or semi-dry areas and shady moist forests (Fan et al. 2009). It is evolutionarily distant from wheat and has exceptionally large spikes, strong rhizomes and vigorous growth. L. racemosus is tolerant to salt and drought (McGuire and Dvorak 1981) and resistant to various diseases, such as scab (Mujeeb-Kazi et al. 1983). Our observations of L. racemosus plants growing in the Arid Land Research Center, Tottori, Japan (35°32′N, 134°13′E), also indicated its ability to tolerate heat stress; it showed vigorous growth, flowering from May to June and filled its grains from July to August during the high temperature and humidity of the summer season. Several Leymus species including L. racemosus have been successfully hybridized and backcrossed with wheat. Some of the resulting addition lines possess potentially useful traits, including biological nitrification inhibition (Subbarao et al. 2007), resistance to Fusarium head blight (Chen et al. 2005, Qi et al. 2008, Wang and Chen 2008) and salt tolerance (Liu et al. 2001). Due to the importance of Leymus as a novel source of useful traits, this study aimed to determine the response of wheat-Leymus racemosus introgression lines to heat stress and examine their potentiality to develop improved cultivars. The results indicated the presence of genotypic variability within addition lines for heat stress tolerance and revealed the potentiality of utilization of the genetic stocks identified in this study for improving wheat adaptation and heat stress tolerance.
Material and Methods
Plant materials
We examined 12 wheat-Leymus racemosus chromosome additions and two substitution lines in the background of wheat cultivar Chinese Spring (CS) and their wheat background CS (Table 1). Hereafter the addition and substitution lines are designated together as ‘introgression lines’. All lines and their wheat parent CS were provided by the Tottori Alien Chromosome Bank of Wheat (TACBOW) supported by National BioResource Project-Wheat, NBRP-wheat.
Table 1
List of the wheat-
Leymus chromosome introgression lines used in this study, their strain, chromosome name and homoeologous groups
a TACBOW: Tottori Alien Chromosome Bank of Wheat supported by NBRP-wheat.
* Although TACBOW0014 and 15 have the same NAU number (NAU501), they originated from different lineage and are maintained as different lines in TACBOW.
The growth chamber experiment was carried out in a chamber in the Arid Land Research Center, Tottori, Japan. The seeds listed in Table 1 were sown directly in pots containing 1.00 kg organic soil under fully controlled conditions with a 22/18°C day/night temperature, 40/50% day/night relative humidity, a 14/10 h (day/night) photoperiod and 80000 lux light intensity. One single seedling was maintained in each pot by clipping the secondary and tertiary tillers to eliminate the confounding effect of tiller number on plant responses under heat stress (Wardlaw 2002). Lines were grown in a completely randomized design with three replications for both the control condition and stressed condition. After 21 days, plants in the heat treatment group were exposed to high temperatures by transferring them to a controlled chamber set at 34/25°C for 4 days. Heat-stressed plants were watered daily while those in the optimum temperature group were watered every other day. Pots were randomized every day to minimize spatial effects. Data were collected after 4 days of heat treatment on chlorophyll fluorescence and triphenyl tetrazolium chloride (TTC) cell viability assay. The chlorophyll fluorescence was measured on the upper fully expanded leaves in both the control and heat treated plants using MINI-PAM, a photosynthesis yield analyzer (WALZ, Germany). The chlorophyll fluorescence data represent percentage of reduction.
The TTC cell viability assay is based on the principles of triphenyl tetrazolium chloride reduction to formazan by dehydrogenase respiratory enzymes. The TTC test evaluates the mitochondrial electron transport chain and thus, it represents respirational activity (Fokar et al. 1998). TTC assay was carried out as described by Fokar et al. (1998) after 4 days heat acclimatization. A 3-cm segment about 1 cm from the leaf tip was excised from the upper most expanded leaf from each seedling. This segment was then quartered and two quarter segments were placed in capped 10-ml test tubes containing 100 μl distilled water. Treatment tubes were heated in a water bath for 1 h at 50°C while control tubes remained at 10°C. A 2-ml solution of 0.8% TTC (w/v) dissolved in a 0.05 M phosphate buffer (pH 7.4) was added to all tubes, which were then placed in a vacuum chamber for infiltration of TTC into leaf tissues. Leaf segments were considered to be infiltrated when they settled to the bottom of the tube after release of the vacuum. Then the tubes were capped and placed in total darkness for 12 h at 22°C. The TTC solution was drained and leaf segments were rinsed in distilled H2O, after which leaf segments were returned to the tube. Formazan dye was extracted by addition of 2.5 ml of 95% ethanol. Tubes were then capped and allowed to remain in darkness for 24 h at 25°C. The amount of formazan dye produced by TTC reduction was determined spectrophotometrically at 530 nm. Cell viability as a measurement of thermotolerance was determined as the percent for treated leaves relative to the control absorbency.
Field evaluation
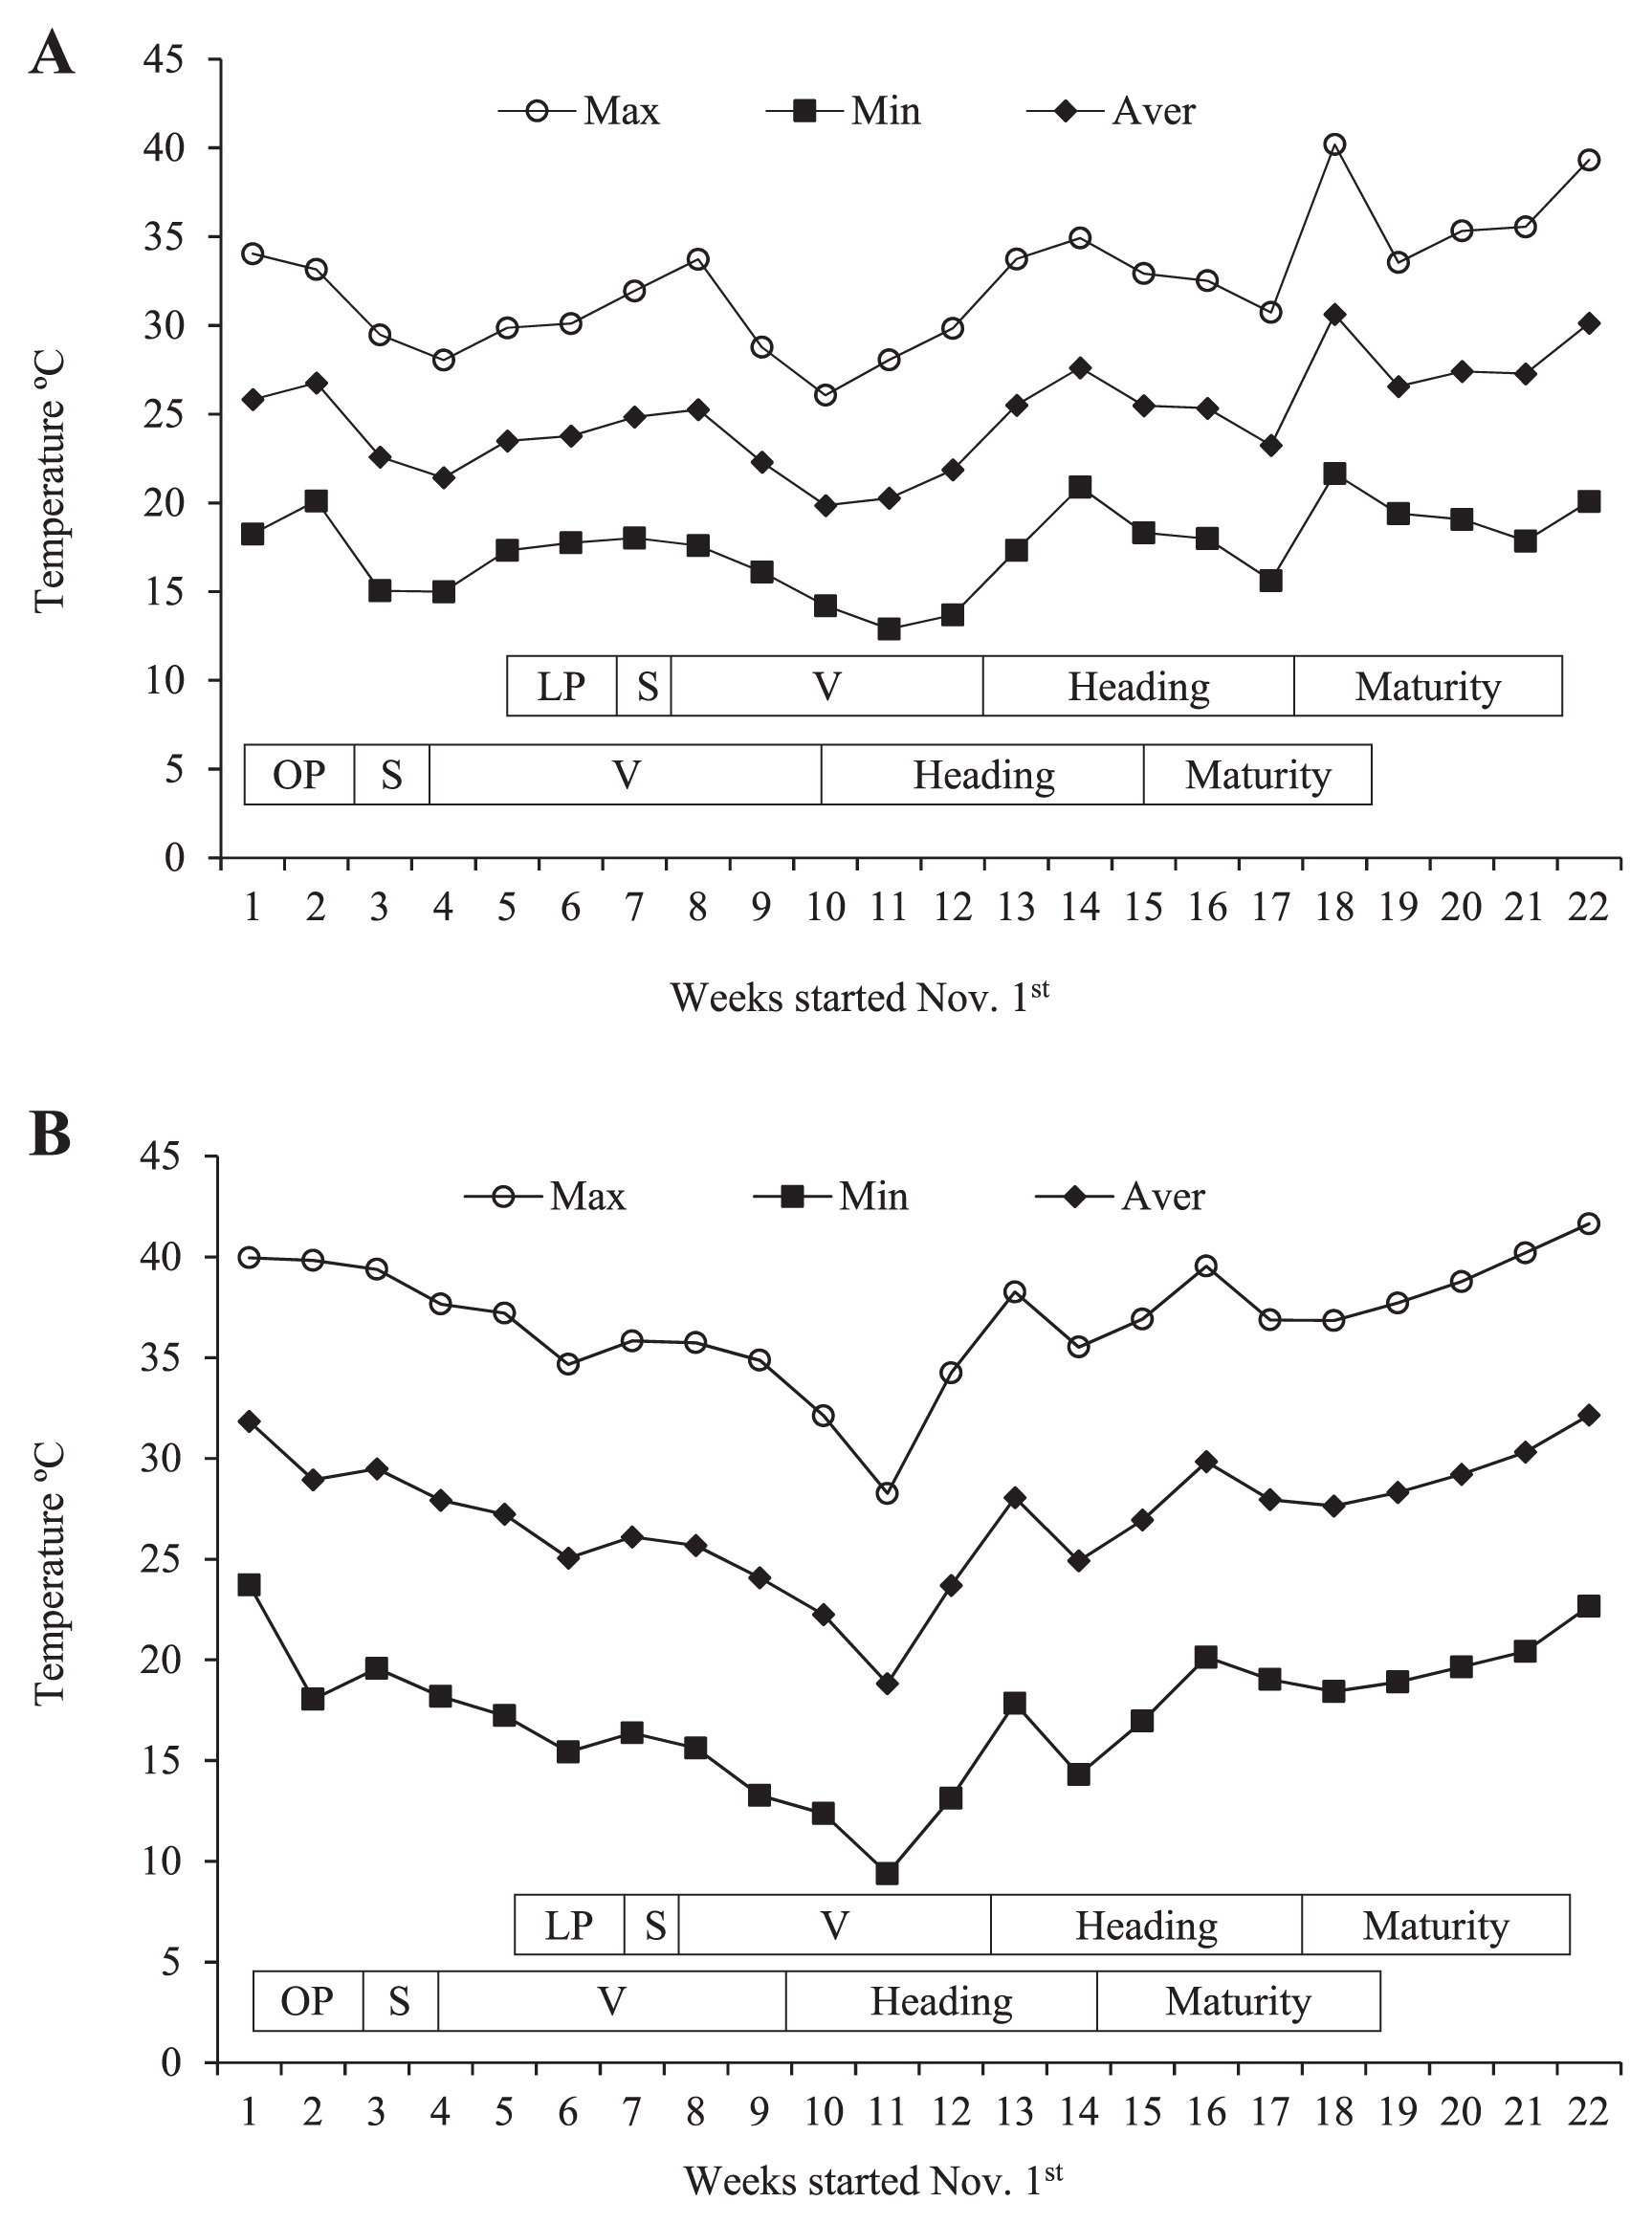
In the first season (2011/2012), experiments were conducted at the Biotechnology and Biosafety Research Center (BBRC) experimental field, Shambat, Khartoum North, Sudan (15°32′N, 32°32′E) and in the second season (2012/2013), at Gezira Research Station experimental field, Agricultural Research Corporation (ARC), Wad Medani, Sudan (14°24′N, 33°29′E). We used two planting dates in each field: an optimum planting date (2nd week of November) and late planting date (2nd week of December) to enable and insure exposure of the crop to heat stress during the grain filling period. Meteorological data, in particular, the weekly maximum, minimum and mean temperatures, during the two cropping seasons were obtained from meteorological stations located at the two experimental sites (Fig. 1A, 1B).
Seeds were sown manually in rows 0.2 m apart in plots consisting of 2 rows of 0.5 m length, in both seasons and locations. The seed rate was 10 g/m2. Seeds were dressed with an insecticide Gaucho (Imidacloprid 35% WP) (Bayer CropScience, USA) to control pests, especially termites and aphids. Triple superphosphate (4.3 g/m2 of P2O5), was applied prior to planting by furrow placement and urea was applied before the second irrigation (8.6 g/m2 of N). Irrigation was carried out at 7 to 10-day intervals to avoid water stress. Weeding was performed manually at least twice. All experiments were arranged in randomized complete block design with three replications.
Traits measured, their definitions and abbreviations are listed in Table 2. Grain yield was estimated per the main culm in the first season in Shambat due to lodging of some plots, whereas in Gezira lodging did not occur and therefore, grain yield was estimated per plot. The heat susceptibility Index (HSI) was calculated according to the formula of Fischer and Maurer (1978): HSI = (1 − Y/Yp)/D, where Y is the yield of the genotype at late planting, Yp is the mean yield of the genotypes at optimum planting and D (stress intensity) = 1 − X/Xp, where X is the mean Y of all genotypes and Xp is the mean Yp of all genotypes. Genotypes were rated as highly tolerant (HSI ≤ 0.50), moderately tolerant (0.50 < HSI ≤ 1.00) or susceptible (HSI > 1.00) to high temperature (Fischer and Maurer 1978, Khanna-Chopra and Viswanathan 1999).
Table 2
Traits measured, their abbreviations and definitions
| Trait |
Abbreviation |
Definition |
| Days to heading |
DH |
Days from sowing to ear emergence. |
| Days to physiological maturity |
DM |
Days from sowing to physiological maturity (loss of green color from the glumes). |
| Plant height |
PH |
Height from the ground to the tip of the spike. |
| Tiller number |
TN |
Number of culms with spikes per each plant or in a specific area within the plot. |
| Spike length |
SL |
Length from the base to the tip of the spike, measured at physiological maturity. |
| Number of spikelets per spike |
SPS |
Number of florets per spike, measured at physiological maturity. |
| Kernel number per spike |
KS |
Number of kernels counted after reaching physiological maturity, measured by counting the number of seeds after threshing each spike individually by hand. |
| 1000 kernel weight |
KW |
Weight of 1000 kernels taken from each plant in each replication, weighed on a sensitive electronic balance. |
| Grain yield |
GY |
Yield after field maturity and drying (a loss of chlorophyll from all plants). |
| Chlorophyll content |
ChC |
The total amount of green pigment in the flag leaf during the mid-grain filing stage, estimated in SPAD units using a chlorophyll meter (SPAD-502, Minolta, Japan). |
All data were subjected to analysis of variance (ANOVA) followed by Fisher’s protected least significant difference (PLSD) test at P < 0.05 using StatView software v. 5.0.1 (SAS Institute, Inc., USA). Field evaluation data were analyzed separately for each season then combined after testing the error mean squares for homogeneity. Simple correlation coefficients among all traits were calculated based on the overall means of genotypes in the second season in Gezira.
Results
Evaluation under growth chamber conditions
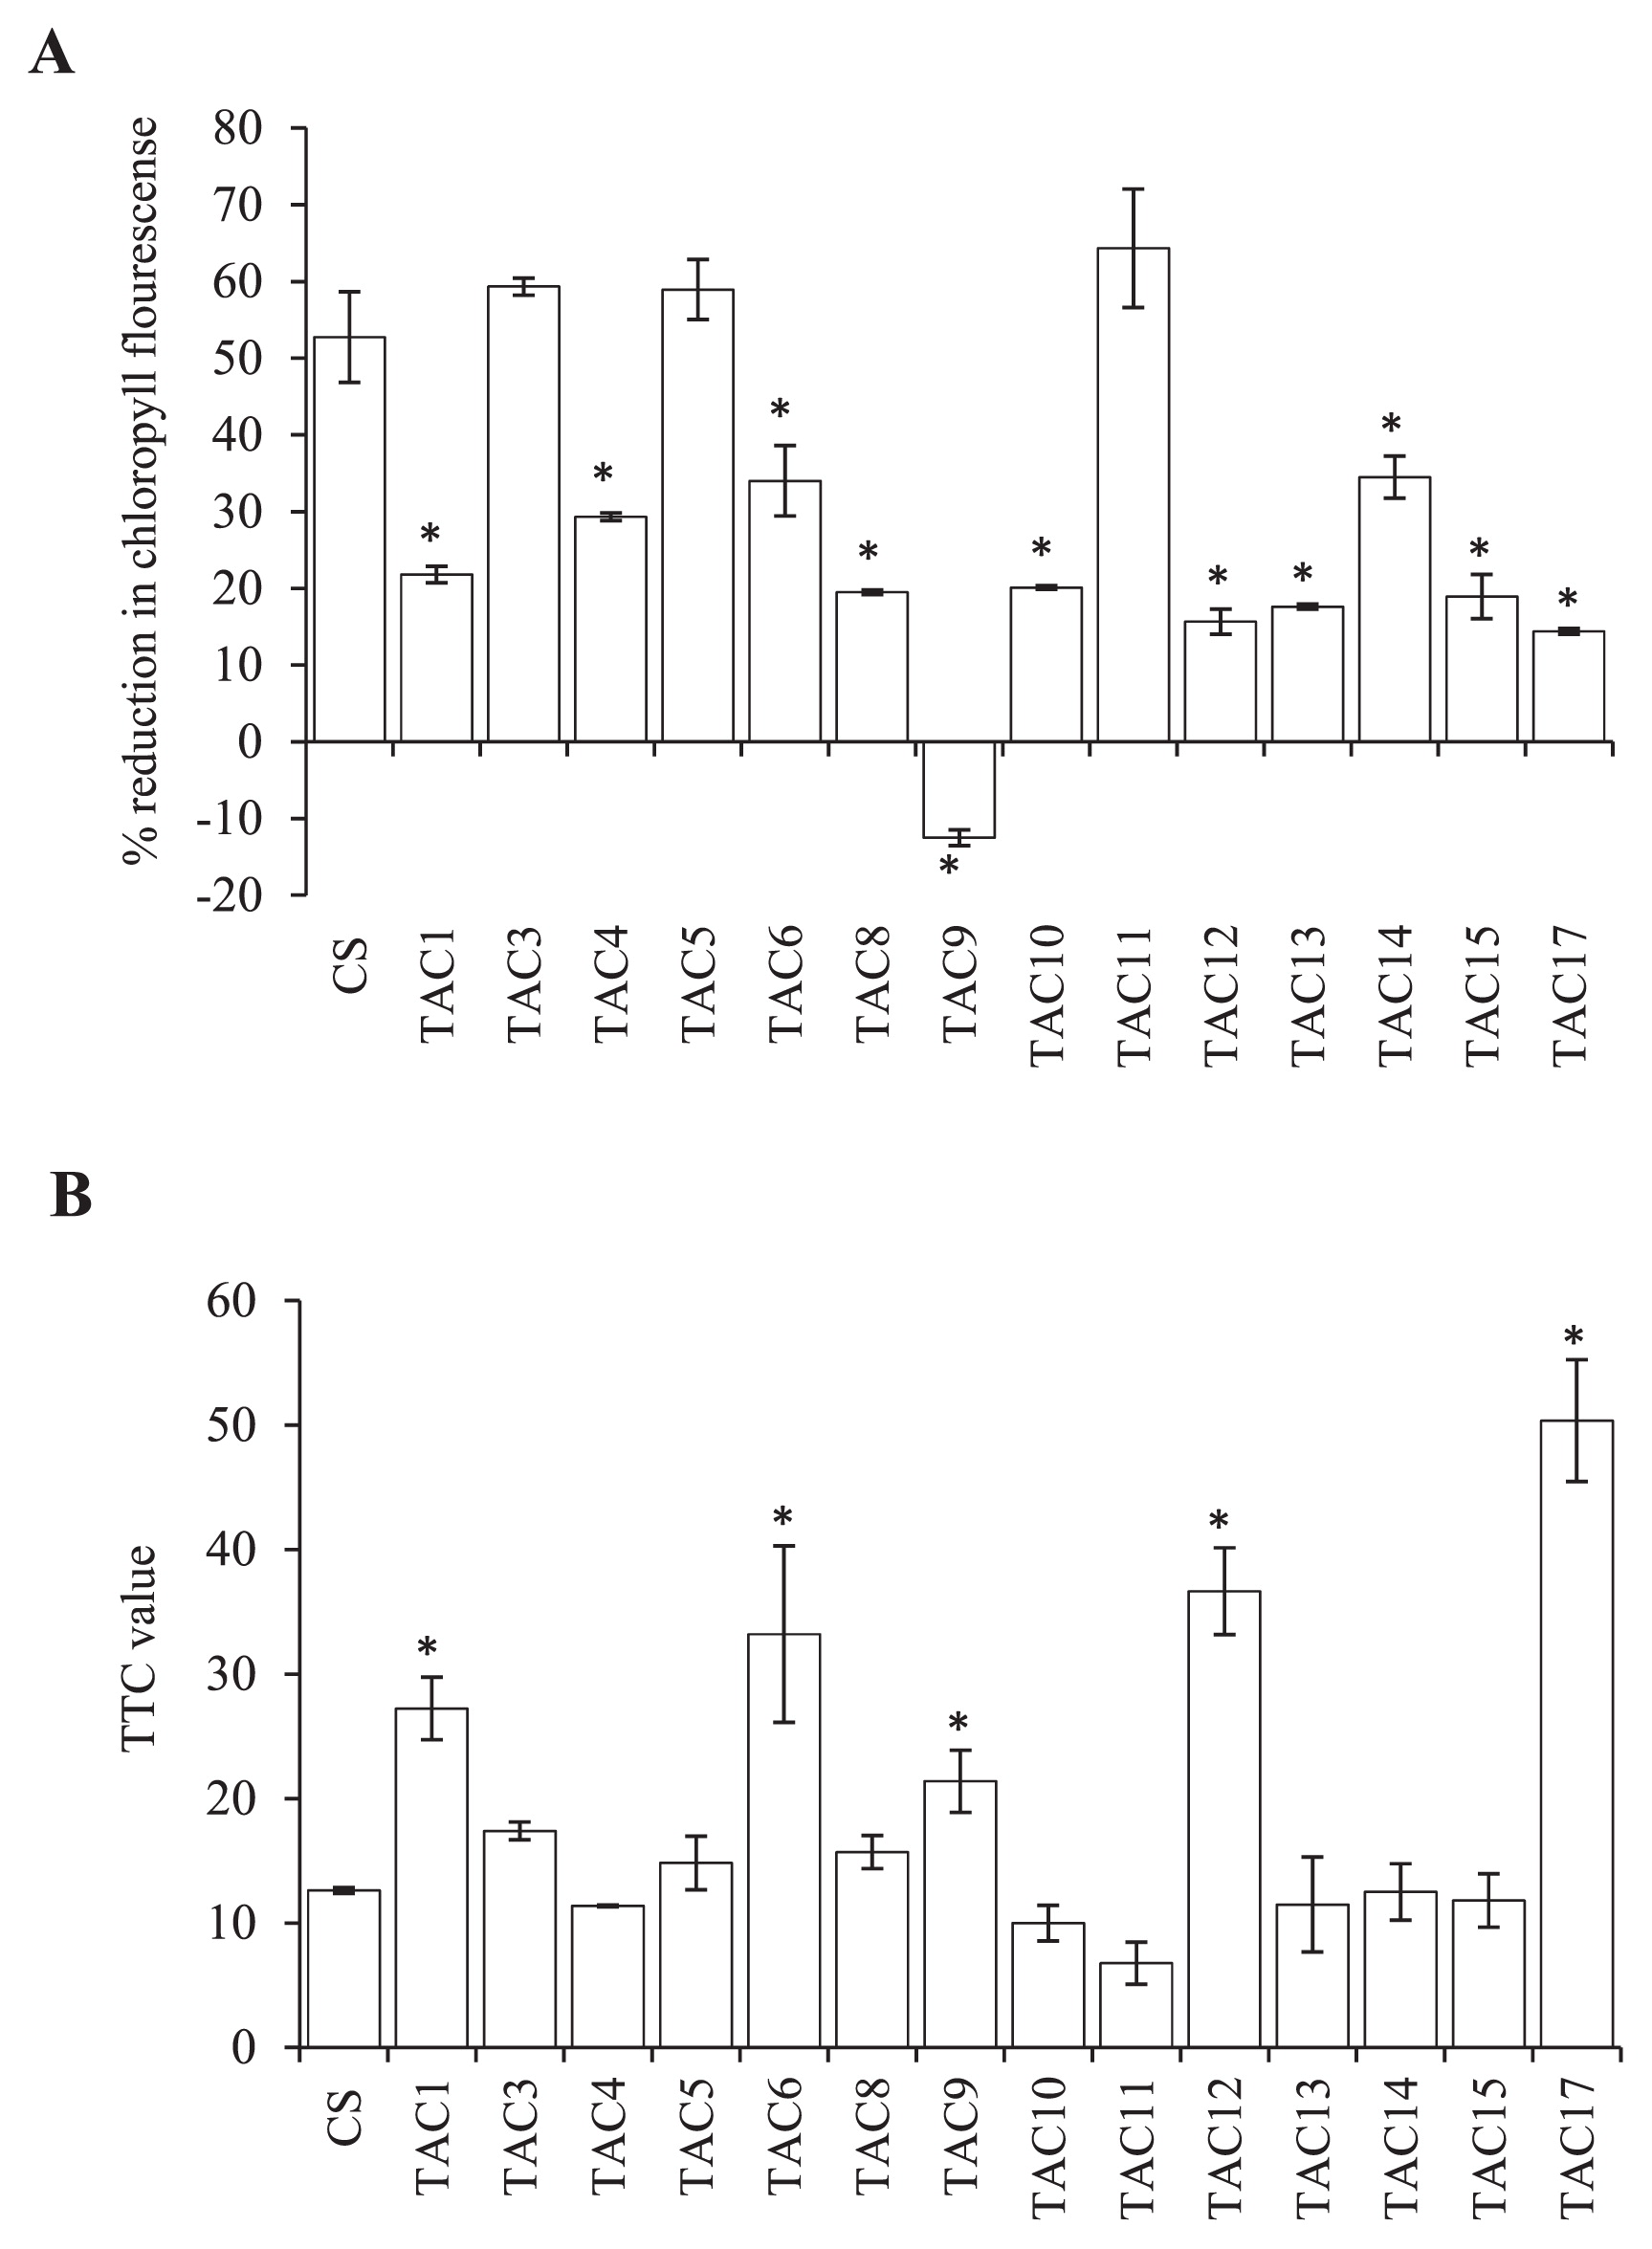
Although a reduction in chlorophyll fluorescence was observed in CS and all tested lines, most of the introgression lines (except TAC11, TAC 3 and TAC5) exhibited a significantly (P < 0.05) lower reduction in chlorophyll fluorescence compared to CS (Fig. 2A). The substitution line TAC11 showed the highest reduction in chlorophyll fluorescence, while addition lines TAC3 and TAC5 showed a comparable reduction to CS. Addition line TAC9 did not experience a reduction in chlorophyll fluorescence, but rather showed a negative value, indicating that chlorophyll fluorescence under heat stress was enhanced in this line than the control condition. Addition lines TAC1, TAC6, TAC9 and TAC12 and substitution line TAC17 showed significantly higher values of TTC than CS, whereas all other lines had comparable values to CS (Fig. 2B). These results indicate the presence of genotypic variability among the chromosome introgression lines for heat stress tolerance, and moreover, the impacts of Leymus chromosomes on wheat heat stress tolerance.
Since the growth chamber experiments indicated genotypic variability in heat stress tolerance among the introgression lines, they were further tested in the field under heat stress conditions in Shambat and Gezira, Sudan. Maximum and average temperatures were higher in Gezira in the second season compared to Shambat in the first season (Fig. 1A, 1B). In general, the temperature from the 9th to the 12th week was lower than that from the 1st to the 8th week, and the 13th to the 22nd week.
In Shambat in the first season, heading of the optimum planting occurred between the 9th to the 13th week, while physiological maturity occurred from the 13th to the 17th week. For the late planting, heading occurred from the 12th to the 16th week and physiological maturity from the 16th to the 19th week (Fig. 1A). In Gezira, heading under optimum planting was observed from the 9th to the 15th week and physiological maturity from the 14th to the 18th week. Under late planting, heading was from the 13th to the 18th week and physiological maturity was from the 17th to the 20th week (Fig. 1B).
Heading and maturity
Heading was observed in CS between 90 to 97 days after sowing, while maturation occurred within 109 to 121 days in both seasons in Shambat and Gezira. The introgression lines exhibited a wide range of heading and maturity. Addition lines TAC1, TAC12 and TAC13 showed early heading within 58 to 66 days and matured within 88 to 103 days (Table 3). TAC15 and TAC17, on the other hand, were the latest to head and mature among all the introgression lines. Their heading was almost later than CS, while maturity was nearly comparable to CS, although TAC15 matured later than CS under optimum planting in Gezira. The remaining introgression lines showed earlier heading and maturity than CS. Except for the early genotypes (TAC1, TAC12 and TAC13); all genotypes were subjected to high temperatures during the grain filling stage under both optimum and late planting. The early genotypes experienced high temperatures during the grain filling stage under late planting. Moreover, heat stress occurred late in the season, reduced the mean DH and DM by 3 and 4 days, respectively. The effects of genotype (G) and planting date (PD) were significant for both traits in Shambat and Gezira (Table 3), while the effect of G × PD was significant for both traits in Gezira but not Shambat. This significant G × PD interaction and the reduction in DH and DM with late planting indicate the effect of environment on each genotype.
Table 3
Days to heading and maturity of the addition lines and their parent CS during evaluation for heat stress tolerance at optimum planting (OP) and late planting (LP) in Shambat (2011/2012) and Gezira (2012/2013), Sudan
| Line |
Days to heading |
Days to maturity |
| Shambat |
Gezira |
Shambat |
Gezira |
| OP |
LP |
OP |
LP |
OP |
LP |
OP |
LP |
| TAC1 |
58 |
62 |
62 |
64 |
96 |
91 |
98 |
91 |
| TAC3 |
83 |
84 |
79 |
80 |
110 |
108 |
103 |
100 |
| TAC4 |
80 |
86 |
81 |
84 |
113 |
108 |
109 |
112 |
| TAC5 |
82 |
87 |
85 |
84 |
113 |
108 |
112 |
116 |
| TAC6 |
84 |
86 |
78 |
79 |
112 |
108 |
100 |
104 |
| TAC8 |
80 |
85 |
77 |
74 |
110 |
106 |
105 |
99 |
| TAC9 |
82 |
82 |
92 |
76 |
114 |
107 |
115 |
106 |
| TAC10 |
76 |
80 |
81 |
77 |
110 |
103 |
105 |
109 |
| TAC11 |
78 |
81 |
81 |
78 |
110 |
106 |
105 |
106 |
| TAC12 |
61 |
63 |
66 |
64 |
97 |
94 |
103 |
92 |
| TAC13 |
58 |
61 |
64 |
60 |
90 |
88 |
100 |
89 |
| TAC14 |
71 |
78 |
72 |
72 |
103 |
101 |
101 |
98 |
| TAC15 |
103 |
101 |
107 |
97 |
117 |
111 |
129 |
108 |
| TAC17 |
95 |
97 |
107 |
113 |
126 |
115 |
NAd |
NA |
| CS |
97 |
90 |
96 |
93 |
121 |
113 |
114 |
115 |
| Mean |
79 |
82 |
82 |
79 |
109 |
104 |
107 |
103 |
| Ga |
*** |
*** |
*** |
*** |
*** |
*** |
*** |
*** |
| LSD |
5.873 |
4.613 |
3.090 |
3.680 |
9.500 |
3.687 |
4.030 |
4.360 |
| SE (G) |
2.0 |
1.7 |
2.0 |
2.0 |
1.5 |
1.2 |
1.3 |
1.3 |
| PDb |
|
** |
|
*** |
|
*** |
|
*** |
| G × PD |
|
NSc |
|
*** |
|
NS |
|
*** |
| CV% |
16 |
14 |
17 |
17 |
9 |
7 |
8 |
8 |
**,*** Significant at 0.01 and 0.001 probability levels, respectively.
The mean plant height (PH) was higher in Shambat than Gezira under both optimum and late planting (Table 4). This could be attributed to the high temperature in Gezira at the beginning of the season (Fig. 1A, 1B), affecting plant development at an early stage. An apparent reduction in PH under late planting was observed in Gezira due to the higher temperatures (Table 4 and Fig. 1A, 1B). In Shambat, the height of CS was 88 cm under optimum and 90 cm under late planting, while in Gezira it was 80 and 62 cm, respectively. Addition lines TAC8 and TAC10 were taller than CS under both optimum and late planting in Shambat and Gezira, indicating the presence of genes associated with PH in these Leymus added chromosomes. All other lines were comparable to CS in Shambat, although in Gezira, TAC3, TAC4, TAC6 and TAC11 were taller than CS and TAC14 and TAC17 were shorter under both optimum and late planting (Table 4). Analysis of variance revealed a significant G effect. The effects of PD and G × PD were significant only in Gezira, which was hotter than Shambat (Table 4 and Fig. 1).
Table 4
Plant height (PH) and tiller number (TN) of the addition lines and their parent CS during evaluation for heat stress tolerance at optimum planting (OP) and late planting (LP) in Shambat (2011/2012) and Gezira (2012/2013), Sudan
| Line |
Plant height (cm) |
Tiller number |
| Shambat |
Gezira |
Gezira |
| OP |
LP |
OP |
LP |
OP |
LP |
| TAC1 |
95 |
95 |
65 |
70 |
44 |
44 |
| TAC3 |
92 |
92 |
92 |
78 |
54 |
42 |
| TAC4 |
89 |
94 |
95 |
72 |
47 |
30 |
| TAC5 |
82 |
90 |
85 |
65 |
46 |
21 |
| TAC6 |
97 |
100 |
93 |
72 |
57 |
58 |
| TAC8 |
101 |
105 |
88 |
73 |
43 |
44 |
| TAC9 |
83 |
87 |
73 |
60 |
34 |
42 |
| TAC10 |
102 |
103 |
88 |
73 |
56 |
63 |
| TAC11 |
102 |
92 |
92 |
77 |
50 |
31 |
| TAC12 |
99 |
93 |
68 |
65 |
38 |
43 |
| TAC13 |
96 |
92 |
63 |
58 |
34 |
31 |
| TAC14 |
93 |
85 |
70 |
53 |
54 |
57 |
| TAC15 |
96 |
91 |
62 |
65 |
24 |
30 |
| TAC17 |
91 |
97 |
60 |
53 |
39 |
NAd |
| CS |
88 |
90 |
80 |
62 |
45 |
29 |
| Mean |
94 |
94 |
78 |
66 |
44 |
40 |
| Ga |
** |
*** |
*** |
*** |
*** |
*** |
| LSD |
10.81 |
5.48 |
4.972 |
7.024 |
9.7 |
12.24 |
| SE (G) |
1.23 |
0.9 |
2 |
1.28 |
1.55 |
2 |
| PDb |
|
NSc |
|
*** |
|
** |
| G × PD |
|
NS |
|
*** |
|
*** |
| CV% |
8 |
6.5 |
16.4 |
13 |
23 |
33 |
**,*** Significant at 0.01 and 0.001 probability levels, respectively.
Tiller number (TN) was estimated in Gezira in the second season. The TN of CS was 45 under optimum planting and 29 under late planting. The TN of the addition lines ranged from 57 in TAC6 to 24 in TAC15 under optimum planting and from 63 in TAC10 to 30 in TAC15 under late planting (Table 4). TAC6 and TAC10 had the highest TN, while TAC13 and TAC15 had the lowest. There was a reduction in TN under late planting and an apparent reduction was observed in CS, TAC3, TAC4, TAC5 and TAC11. The effects of G, PD and G × PD were significant (Table 4).
Spike length and number of spikelets per spike
The spike length (SL) of CS was 9.5 and 8.2 cm under optimum planting and 9.9 and 7.2 cm under late planting in Shambat and Gezira, respectively (Table 5). The SL of the introgression lines ranged from 7.6 cm in TAC6 to 11.2 cm in TAC13 under optimum planting and from 7.5 cm in TAC14 to 11.5 cm in TAC13 under late planting. Among the introgression lines, substitution line TAC11 and addition line TAC13 had the longest spikes, while addition lines TAC14 and TAC15 had the shortest (Table 5).
Table 5
Spike length (SL) and number of spikelets per spike (SPS) of the addition lines and their parent CS during evaluating for heat stress tolerance at optimum planting (OP) and late planting (LP) in Shambat (2011/2012) and Gezira (2012/2013), Sudan
| Line |
Spike length |
Spikelet/spike |
| Shambat |
Gezira |
Shambat |
Gezira |
| OP |
LP |
OP |
LP |
OP |
LP |
OP |
LP |
| TAC1 |
9.6 |
9.6 |
8.6 |
7.9 |
18 |
19 |
19 |
19 |
| TAC3 |
9.2 |
9.2 |
8.3 |
7.9 |
22 |
22 |
22 |
19 |
| TAC4 |
9.2 |
9.2 |
8.9 |
8.6 |
22 |
22 |
24 |
21 |
| TAC5 |
9.7 |
9.1 |
9.2 |
7.7 |
21 |
20 |
22 |
19 |
| TAC6 |
9.6 |
9.5 |
7.6 |
7.7 |
23 |
21 |
19 |
18 |
| TAC8 |
9.8 |
10.0 |
8.7 |
8.4 |
20 |
22 |
18 |
18 |
| TAC9 |
9.8 |
9.9 |
10.4 |
8.9 |
21 |
21 |
22 |
17 |
| TAC10 |
9.1 |
9.3 |
8.6 |
8.0 |
22 |
21 |
21 |
19 |
| TAC11 |
11.1 |
10.9 |
10.2 |
10.1 |
21 |
22 |
20 |
19 |
| TAC12 |
8.9 |
8.9 |
8.2 |
7.9 |
20 |
19 |
20 |
19 |
| TAC13 |
11.2 |
11.5 |
9.2 |
8.4 |
17 |
17 |
19 |
15 |
| TAC14 |
7.7 |
7.5 |
6.9 |
5.7 |
21 |
22 |
22 |
20 |
| TAC15 |
8.3 |
8.2 |
7.9 |
NA |
20 |
20 |
18 |
NA |
| TAC17 |
10.2 |
9.8 |
NA |
6.8 |
20 |
19 |
NAd |
16 |
| CS |
9.5 |
9.9 |
8.2 |
7.2 |
21 |
21 |
22 |
19 |
| Mean |
10 |
9 |
9 |
8 |
20 |
21 |
21 |
19 |
| Ga |
*** |
*** |
*** |
*** |
*** |
*** |
** |
*** |
| LSD |
0.724 |
0.734 |
1.217 |
1.204 |
1.833 |
1.994 |
3.191 |
1.826 |
| SE |
0.128 |
0.134 |
0.15 |
0.183 |
0.235 |
0.251 |
0.383 |
0.227 |
| PDb |
|
NS |
|
** |
|
NS |
|
*** |
| G × PD |
|
NSc |
|
NS |
|
NS |
|
NS |
| CV% |
10 |
10 |
11 |
15 |
9 |
9 |
12 |
9.7 |
**,*** Significant at 0.01 and 0.001 probability levels, respectively.
The spikelets per spike (SPS) of CS were 21 and 22 under optimum planting and 21 and 19 under late planting in Shambat and Gezira, respectively (Table 5). The SPS of the introgression lines ranged from 17 in TAC13 to 24 in TAC4 under optimum planting and from 15 in TAC13 to 22 in TAC3, TAC4, TAC11 and TAC14 under late planting. None of the addition lines had a higher SPS than CS across environments and PD, except TAC6, which had more SPS in Shambat under optimum planting. The highest reduction in SPS was recorded in Gezira under late planting (Table 5). The variation in SL and SPS among genotypes was highly significant in both environments (Table 5). The PD differences were significant only in Gezira and no significant G × PD interaction was observed.
Number of kernels per spike and 1000 kernel weight
Kernel number per spike (KS) was higher in Shambat than Gezira under optimum and late planting due to the high temperatures in Gezira (Table 6 and Fig. 1A, 1B). The KS of CS was 55 and 37 under optimum planting in Shambat and Gezira, respectively and 51 and 26 under late planting, respectively. The KS of the introgression lines ranged from 3 in TAC15 to 68 in TAC6 under optimum planting and from 6 in TAC17 to 58 in TAC6 and TAC10 under late planting in the two environments (Table 6). TAC6 and TAC10 had significantly higher KS than CS under optimum planting in both environments (Table 6). This result indicates the existence of genes related to KS in these two Leymus added chromosomes. Under late planting, a significantly higher number of KS compared to CS were observed in TAC6 and TAC10 in Shambat and in TAC1 and TAC14 in Gezira (Table 6). TAC11, TAC13, TAC15 and TAC17 had the lowest KS among the introgression lines. The greatest reduction in KS was observed under late planting in Gezira because of the higher temperatures. Introgression lines varied greatly in the magnitude of reduction due to high temperatures late in the season, ranging from 23% in TAC13 to 78% in TAC5 compared to 30% in CS. KS showed highly significant variation among the genotypes in both environments under optimum and late planting (Table 6). PD differed significantly in Gezira and the G × PD interaction was highly significant in both environments indicating the strong influence of environment on the trait.
Table 6
Kernel number per spike (KS) and 1000 kernel weight (KW) of the addition lines and their parent CS during evaluation for heat stress tolerance at optimum planting (OP) and late planting (LP) in Shambat (2011/2012) and Gezira (2012/2013), Sudan
| Line |
Kernel number/spike |
1000 kernel weight (g) |
| Shambat |
Gezira |
Gezira |
| OP |
LP |
OP |
LP |
OP |
LP |
| TAC1 |
53 |
50 |
49 |
32 |
18.6 |
14.6 |
| TAC3 |
54 |
57 |
40 |
24 |
17.3 |
15.7 |
| TAC4 |
43 |
48 |
16 |
8 |
15.7 |
16.8 |
| TAC5 |
44 |
43 |
38 |
8 |
13.5 |
16.4 |
| TAC6 |
68 |
58 |
47 |
29 |
15.6 |
16.5 |
| TAC8 |
53 |
53 |
29 |
16 |
16.9 |
16.0 |
| TAC9 |
39 |
41 |
29 |
19 |
14.1 |
18.8 |
| TAC10 |
59 |
58 |
45 |
26 |
16.5 |
16.5 |
| TAC11 |
32 |
38 |
28 |
9 |
14.9 |
16.7 |
| TAC12 |
54 |
49 |
36 |
27 |
19.1 |
16.5 |
| TAC13 |
43 |
43 |
32 |
14 |
26.3 |
22.2 |
| TAC14 |
49 |
57 |
47 |
36 |
21.4 |
16.3 |
| TAC15 |
45 |
38 |
3 |
NA |
9.3 |
NA |
| TAC17 |
8 |
6 |
NAd |
NA |
NA |
NA |
| CS |
55 |
51 |
37 |
26 |
16.1 |
13.0 |
| Mean |
47 |
46 |
34 |
|
16.8 |
16.6 |
| Ga |
*** |
*** |
*** |
*** |
*** |
* |
| LSD |
4.008 |
6.706 |
8.207 |
4.915 |
3.372 |
3.063 |
| SE (G) |
1.807 |
1.717 |
2 |
1.52 |
0.643 |
0.431 |
| PDb |
|
NSc |
|
*** |
|
NS |
| G × PD |
|
*** |
|
*** |
|
* |
| CV% |
29 |
28 |
38 |
44 |
24 |
16.0 |
*,**,*** Significant at 0.05, 0.01 and 0.001 probability levels, respectively.
The kernel weight (KW) of CS was 16.1 g under optimum planting and 13 g under late planting, while in the introgression lines KW ranged from 9.3 g in TAC15 to 26.3 g in TAC13 under optimum planting and from 14.6 g in TAC1 to 22.2 g in TAC13 under late planting (Table 6). TAC13 and TAC14 had higher KW than CS under optimum planting, whereas under late planting, TAC13, TAC4, TAC9 and TAC11 had higher KW than CS. The reduction in KW due to heat stress under late planting was 19% in CS, whereas the reduction in KW in the introgression lines ranged from no reduction in TAC4, TAC5, TAC6, TAC9 and TAC11 to 24% in TAC14. Genotypes differed significantly in KW under optimum and late planting. PD had no significant effect on KW; however, the interaction G × PD was significant, indicating the effect of high temperature on KW (Table 6).
Chlorophyll content, grain yield and heat susceptibility index
The chlorophyll content (ChC) of CS was 38.5 SPAD units under optimum planting and 38 SPAD units under late planting. The ChC of the introgression lines ranged from 35 SPAD units in TAC9 to 46.6 SPAD units in TAC13 under optimum planting and from 36.8 SPAD units in TAC10 to 45.9 SPAD units in TAC13 under late planting (Table 7). These results indicate the presence of genes associated with ChC in the Leymus chromosome added to TAC13. TAC9 had a lower ChC than CS under both optimum and late planting. Overall, the average chlorophyll content of the genotypes was higher under optimum planting than late planting. The G effect was significant and the influence of environment was revealed by the significant PD effect. The interaction G × PD was not significant (Table 7).
Table 7
Chlorophyll content (ChC) at the mid grain filling stage, grain yield and the heat susceptibility index (HSI) of the addition lines and their parent CS during evaluation for heat stress tolerance at optimum planting (OP) and late planting (LP) in Shambat (2011/2012) and Gezira (2012/2013), Sudan
| Line |
Chlorophyll content* |
Grain yield |
HSI |
| Gezira |
Shambat (g/plant) |
Gezira (g/m2) |
| OP |
LP |
OP |
LP |
OP |
LP |
| TAC1 |
44.8 |
44.4 |
1.9 |
1.7 |
122 |
56 |
0.59 |
| TAC3 |
44.8 |
41.3 |
1.8 |
1.8 |
102 |
39 |
0.93 |
| TAC4 |
39.8 |
42.5 |
1.3 |
1.4 |
12 |
17 |
1.35 |
| TAC5 |
40.9 |
40.5 |
1.6 |
1.2 |
25 |
15 |
1.38 |
| TAC6 |
41.3 |
39.5 |
2.3 |
1.7 |
132 |
78 |
0.24 |
| TAC8 |
43.7 |
41.5 |
2.0 |
1.5 |
73 |
9 |
1.50 |
| TAC9 |
35.0 |
37.6 |
1.4 |
1.3 |
11 |
14 |
1.41 |
| TAC10 |
43.2 |
36.8 |
2.1 |
1.9 |
133 |
50 |
0.71 |
| TAC11 |
42.7 |
40.9 |
1.4 |
1.1 |
53 |
8 |
1.51 |
| TAC12 |
43.4 |
41.9 |
2.1 |
1.7 |
121 |
74 |
0.25 |
| TAC13 |
46.6 |
45.9 |
1.9 |
1.8 |
110 |
56 |
0.59 |
| TAC14 |
44.5 |
42.3 |
2.1 |
1.9 |
265 |
29 |
1.12 |
| TAC15 |
46.3 |
44.2 |
1.4 |
0.9 |
10 |
NA |
NA |
| TAC17 |
42.4 |
39.7 |
0.6 |
0.6 |
NAd |
NA |
NA |
| CS |
38.5 |
38.0 |
1.5 |
1.3 |
51 |
14 |
1.40 |
| Mean |
42.5 |
41.1 |
2 |
1 |
87 |
35 |
1 |
| Ga |
*** |
*** |
*** |
*** |
*** |
*** |
*** |
| LSD |
3.296 |
4.682 |
0.243 |
0.359 |
25.15 |
6.95 |
0.310 |
| SE (G) |
0.51 |
0.57 |
0.059 |
0.056 |
10.62 |
3.95 |
0.063 |
| PDb |
|
*** |
|
*** |
|
*** |
|
| G × PD |
|
NSc |
|
*** |
|
*** |
|
| CV% |
8 |
9.3 |
27 |
29 |
77 |
69 |
41 |
* Chlorophyll content is indicated by SPAD unit.
*** Significant at 0.001 probability level.
A reduction in GY due to the high temperature under late planting was observed in Shambat and Gezira. In Shambat, the GY of CS was 1.5 g/spike under optimum planting and 1.3 g/spike under late planting, whereas the introgression lines ranged from 0.6 g/spike in TAC17 to 2.3 g/spike in TAC6 under optimum planting and from 0.6 g/spike in TAC17 to 1.9 g/spike in TAC10 under late planting. In Gezira, the GY of CS was 51 g/m2 under optimum planting and 14 g/m2 under late planting, whereas the introgression lines ranged from 10 g/m2 in TAC15 to 265 g/m2 in TAC14 under optimum planting and from 8 g/m2 in TAC11 to 78 g/m2 in TAC6 under late planting (Table 7). TAC1, TAC3, TAC6, TAC10, TAC12, TAC13 and TAC14 had significantly higher GY than CS under both optimum and late planting in Shambat and Gezira, although these genotypes suffered a high yield reduction due to the high temperature under late planting (Table 7). The high yields of these genotypes indicate the presence of genes related to yield potential in these Leymus added chromosomes. TAC15 and TAC17 had lower GY compared to the other introgression lines and CS. In Gezira, TAC4, TAC5 and TAC9 had lower GY than CS under optimum planting, while under late planting their GY was comparable to CS (Table 7). The genotypes showed highly significant differences in GY in both environments among the PD. The effect of PD and the interaction G × PD were also highly significant (Table 7), indicating that the GY of the genotypes responded differently to the two PD.
Based on the heat susceptibility index (HSI), the indicator of GY reduction, TAC6 and TAC12 were classified as highly heat tolerant, showing HSI < 0.5 (Table 7). TAC1, TAC3, TAC10 and TAC13 were classified as moderately heat tolerant (1 > HSI > 0.5), whereas the rest of the addition lines and CS were classified as heat sensitive (HSI > 1) (Table 7) (Fischer and Maurer 1978, Khanna-Chopra and Viswanathan 1999). Overall, the genotypes showed highly significant variation in HSI.
Correlation between plant traits with grain yield and heat susceptibility index
The correlation between GY and the other plant traits was estimated from the means of all the genotypes within the growth chamber and under optimum and late planting in Gezira, where the highest reduction in several plant traits was observed under late planting. GY under optimum planting was correlated negatively with DH, DM and SL and positively with KS, KW and ChC under late planting; GY was correlated negatively with DH and DM and positively with KS and TTC (Table 8). No correlation was observed between GY and HSI under optimum planting, but under late planting a highly significant negative correlation was observed. HSI was correlated positively with DH and DM and negatively with KS and TTC under both optimum and late planting conditions (Table 8).
Table 8
Correlation coefficients of grain yield and HSI with other plant traits measured in the addition lines and their parent CS during evaluation for heat stress tolerance in a growth chamber and the field under optimum planting (OP) and late planting (LP) in Gezira, Sudan, in the 2012/2013 season
| Trait |
Grain yield |
HSI |
| OP |
LP |
OP |
LP |
| Days to heading |
−0.54* |
−0.62* |
0.64* |
0.57* |
| Days to maturity |
−0.7** |
−0.63* |
0.69** |
0.58* |
| Plant height |
−0.35 |
−0.08 |
0.33 |
0.005 |
| Tiller number |
0.42 |
0.46 |
−0.08 |
−0.49 |
| Spike length |
−0.75** |
−0.27 |
0.44 |
0.23 |
| Spikelets per spike |
−0.20 |
−0.20 |
0.39 |
0.23 |
| Kernel number per spike |
0.69** |
0.55* |
−0.55* |
−0.54* |
| 1000 Grain weight |
0.58* |
0.18 |
−0.45 |
−0.17 |
| HSI |
−0.43 |
−0.99*** |
1.00 |
1.00 |
| Chlorophyll content |
0.59* |
0.31 |
−0.45 |
−0.25 |
| Chlorophyll fluorescence |
0.49 |
0.50 |
−0.32 |
0.5 |
| TTC |
0.11 |
0.71** |
−0.68** |
−0.68** |
*,**,*** Significant at 0.05, 0.01 and 0.001 probability levels, respectively.
Discussion
Our results clearly indicate the positive impact of some added Leymus chromosomes on several wheat traits and, revealing the value of these alien chromosomes on wheat heat stress tolerance.
The negative correlations between DH and DM with GY and their positive correlations with HSI indicate that early heading and maturity are preferable for high yield gain in heat-stressed environments. TAC1, TAC12 and TAC13 showed early heading and maturity coupled with a higher GY than CS under both the optimum and late planting conditions (Tables 3, 7). However, the GY of these lines was reduced under late planting. On the other hand, low yield was associated with late heading and maturity in TAC15 and TAC17 (Tables 3, 7), suggesting that the high yield of TAC1, TAC12 and TAC13 is attributed to their adaptation and ability to escape late heat stress. Early heading and maturity enabled these lines to fill their grains normally and escape the late heat stress occurring at the end of the season.
Iqbal et al. (2007) reported early maturity resulted in avoidance of late-season frost damage during the short growing season in northern high latitudes in Canadian spring wheat genotypes. However, a grain yield penalty was detected in these early maturing cultivars (Iqbal et al. 2007). Based on the HSI results, TAC1 and TAC13 were classified as moderately heat tolerant and TAC12 as highly heat tolerant (Table 7). GY was strongly correlated with TTC under late planting conditions (Table 8). TAC12 had a significantly higher TTC value than TAC1 and TAC13 (Fig. 2B), indicating efficient mitochondrial electron transport activity and therefore we conclude that in addition to the avoidance, TAC12 also has a heat tolerance mechanism. Addition lines TAC1 and TAC12 and substitution line TAC17 harbor the same Leymus chromosome in homoeologous group 2 (HG2) (Larson et al. 2012). However, TAC17 showed delayed flowering and maturity compared to TAC1 and TAC12. This was attributed to the absence of the photoperiod-response Ppd-B1 allele on chromosome 2B, which was replaced in TAC17 by chromosome 2Lr#1 of L. racemosus (Qi et al. 1997). TAC1 was developed by Kishii et al. (2004) in Japan, whereas TAC12 was developed by Qi et al. (1997) using different L. racemosus strains in China; therefore, the difference between the two in GY and heat tolerance could be attributed to allelic differences in the L. racemosus strains used to develop the two addition lines.
TAC13 has a longer spike than CS, but its SPS and KS were lower than those of CS (Tables 5, 6). These results indicate that the added chromosomes resulted in changes in spike morphology. TAC13 had a low number of grains; however, it had more GY as a result of its high ChC, giving a higher KW (Tables 6, 7). This high KW subsequently compensated for the loss in grain number. TAC13 harbors a Leymus chromosome from homoeologous group 5; QTL affecting KW in wheat are located on chromosomes 2B, 5B and 7A (Groos et al. 2003).
The higher GY of TAC6 and TAC10 compared to CS under both optimum and late planting (Table 7) was attributed to their higher TN and KS than CS under both conditions, as well as to their stable KW, since neither line suffered any reduction due to the high temperature under late planting (Tables 4, 6). Based on the HSI results, TAC6 was classified as highly heat tolerant and TAC10 as moderately heat tolerant (Table 7). This finding was attributed to the fact that TAC6 had a significantly higher TTC value than CS and TAC10, indicating higher mitochondrial efficiency under heat stress conditions (Fig. 2B). TAC6 harbors a Leymus chromosome from homoeologous group 5, while TAC10 harbors chromosomes from homoeologous group 3/7 (Kishii et al. 2004, Larson et al. 2012). Byrne et al. (2002) reported that loci on chromosomes 2B and 5B are the most important for heat tolerance. In addition, the above findings indicate the presence of genes related to TN and KS on these two Leymus added chromosomes.
TAC14 had the highest GY among the introgression lines under optimum planting in Gezira (Table 7). This was the result of its high TN and KW (Tables 4, 6). However, the GY of this line decreased drastically between optimum and late planting and it was subsequently classified as heat sensitive based on the HSI results. The higher GY of this line under the favorable conditions of optimum planting suggest the presence of genes related to yield potential in the added Leymus chromosome.
Addition line TAC5 and substitution line TAC11 harbor the same Leymus chromosome from homoeologous group 3 (Kishii et al. 2004, Larson et al. 2012). TAC11 had a higher reduction in chlorophyll florescence than TAC5 (Fig. 2A), indicating the importance of wheat chromosome 2B, which was substituted in TAC11 by Leymus chromosome H, in reducing the effect of high temperature on PSII activity. On the other hand, TAC5 had more KS than TAC11 under the favorable conditions of optimum planting, indicating that wheat chromosome 2B includes genes that influence grain number. In analysis of spring wheat populations for heat tolerance, loci on chromosomes 2B and 5B were found to be most important (Byrne et al. 2002).
The grain yield (GY) showed a highly significant correlation with HSI under late planting conditions (Table 8), indicating the validity of using HSI as a selection criteria for heat tolerance in wheat. Yang et al. (2002) also reported a highly significant correlation between the GY of hexaploid amphiploids and HSI under heat stress conditions. KS was positively correlated with GY and negatively with HSI under both optimum and late planting conditions (Table 8). This finding indicates the importance of KS as a determining factor of yield of the lines under heat stress. A correlation between GY and KS was previously reported in wheat under heat stress (Balla et al. 2012, Mohammadi et al. 2004). Here, TTC measured under controlled conditions in growth chamber was correlated positively with GY and negatively with HSI under late planting conditions, indicating plants showing enhanced mitochondrial efficiency under heat stress also have better GY and lower HSI values. This result indicates that TTC assay could be used as a selection criterion for heat stress tolerance at the seedling stage under controlled conditions, thus reduce the time and cost needed for the field evaluation. TTC assay is an efficient technique for quantification of acquired high temperature tolerance in wheat cultivars (Porter et al. 1994). Dhanda and Munjal (2006) previously reported a positive correlation between GY and TTC in 20 diverse wheat genotypes under normal and heat stress conditions.
Chlorophyll content was correlated positively with GY under optimum planting, but not late planting (Table 8). Reynolds et al. (1994) suggested that sustained ChC during maturation was an efficient indicator of heat tolerance in wheat cultivars. Hede et al. (1999) also found a significant correlation between leaf chlorophyll content and kernel weight in 2,255 Mexican landraces and revealed the reliability of chlorophyll level as a heat tolerance indicator in wheat. In contrast, Balla et al. (2012) did not find a correlation between ChC and GY or its components under heat stress conditions in a doubled haploid population derived from a cross between heat tolerant and heat sensitive wheat cultivars.
In conclusion, this study revealed the impact of certain Leymus chromosomes on enhancing wheat tolerance and adaptation to high temperatures. Chromosomes A, 2Lr#1 and 5Lr#1 added to TAC1, TAC12 and TAC13, respectively, enhanced adaptation, whereas chromosomes I and N in TAC6 and TAC10, respectively, enhanced grain number per spike and heat tolerance. The results also indicated the importance of chromosome 7Lr#1 added to TAC14 as a source of yield potential. CS, the parent of these addition lines, is a classic genotype, showing low yield potential. These genetic stocks could therefore be used as a bridge to introduce the valuable Leymus traits identified in this study into superior wheat backgrounds, thus enhancing wheat adaptation and maximizing yield potential under stressed environments.
Acknowledgments
This study was partly supported by the Qatar National Research Fund, a member of Qatar Foundation (NPRP5-1040-4-013).
Literature Cited
- Al-Khatib, K. and G.M. Paulsen (1990) Photosynthesis and productivity during high-temperature stress of wheat genotypes from major world regions. Crop Sci. 30: 1127–1132.
- Balla, K., I. Karsai, T. Kiss, S. Bencze, Z. Bedo and O. Veisz (2012) Productivity of a doubled haploid winter wheat population under heat stress. Cent. Eur. J. Bio. 7: 1084–1091.
- Byrne, P.F., J.D. Butler, G.R. Anderson and S.D. Haley (2002) QTL’s for agronomic and morphological traits in spring wheat population derived from a cross of heat tolerant and heat sensitive lines (poster). In: Plant, Animal and Microbe Genomes X Conf., San Diego, CA.
- Chen, P., W. Liu, J. Yuan, X. Wang, B. Zhou, S. Wang, S. Zhang, Y. Feng, B. Yang, G. Liu et al. (2005) Development and characterization of wheat-Leymus racemosus translocation lines with resistance to Fusarium head blight. Theor. Appl. Genet. 111: 941–948.
- Cox, T.S., R.G. Sears, R.K. Bequette and T.J. Martin (1995) Germplasm enhancement in winter wheat × Triticum tauschii backcross populations. Crop Sci. 35: 913–919.
- Dhanda, S.S. and R. Munjal (2006) Inheritance of cellular thermotolerance in bread wheat. Plant Breed. 125: 557–564.
- Dreccer, F., F.C. Ogbonnaya and G. Borgognone (2004) Sodium exclusion in primary synthetic wheats. Proc. XI Wheat Breeding Assembly: 118–121.
- Eastwood, R.F., E.S. Lagudah and R. Appels (1994) A direct search for DNA sequences tightly linked to cereal cyst nematode resistance genes in Triticum tauschii. Genome 37: 311–319.
- Fan, X., L.N. Sha, R.W. Yang, H.Q. Zhang, H.Y. Kang, C.B. Ding, L. Zhang, Y.L. Zheng and Y.H. Zhou (2009) Phylogeny and evolutionary history of Leymus (Triticeae; Poaceae) based on a single copy nuclear gene encoding plastid acetyl-CoA carboxylase. BMC Evol. Biol. 9: 247.
- Fischer, R.A. and R. Maurer (1978) Drought resistance in spring wheat cultivars. I. Grain yield response. Aust. J. Agric. Res. 29: 897–907.
- Fokar, M., H.T. Nguyen and A. Blum (1998) heat tolerance in spring wheat. I. Estimating cellular thermotolerance and its heritability. Euphytica 104: 1–8.
- Garg, M., H. Tanaka, N. Ishikawa, K. Tanaka, M. Yanaka and H. Tsujimoto (2009) Agropyron elongatum HMW-glutenins have a potential to improve wheat end-product quality through targeted chromosome introgression. Breed. Sci. 50: 358–363.
- Gatford, K.T., P. Hearnden, F. Ogbonnaya, R.F. Eastwood and G.M. Halloran (2002) Novel resistance to pre-harvest sprouting in Australian wheat from the wild relative Triticum tauschii. Euphytica 126: 67–76.
- Groos, C., N. Robert, E. Bervas and G. Charmey (2003) Genetic analysis of grain-protein content, grain yield and thousand-kernel weight in bread wheat. Theor. Appl. Genet. 106: 1032–1040.
- Harding, S.A., J.A. Guikema and G.M. Paulsen (1990) Photosynthetic decline from high temperature stress during maturation of wheat. I. Interaction with senescence processes. Plant Physiol. 92: 648–653.
- Hede, A.R., B. Skkovm, M.P. Reynolds, J. Crossa, A.L. Vilhelmsen and O. Stolen (1999) Evaluating genetic diversity for heat tolerance traits in Mexican wheat landraces. Genet. Res. Crop Evol. 46: 37–45.
- Hurkman, W.J. and C.K. Tanaka (1987) the effects of salt on the pattern of protein synthesis in barley roots. Plant Physiol. 83: 517–524.
- Iqbal, M., A. Navabi, R.C. Yang, D.F. Salmon and D. Spaner (2007) Molecular characterization of vernalization response genes in Canadian spring wheat. Genome 50: 511–516.
- Jiang, J., B. Friebe and B.S. Gill (1994) Recent advances in alien gene transfer in wheat. Euphytica 73: 199–212.
- Khanna-Chopra, R. and C. Viswanathan (1999) Evaluation of heat stress tolerance in irrigated environment of T. aestivum and related species. I. Stability in yield and yield components. Euphytica 106: 169–180.
- Kishii, M., T. Yamada, T. Sasakuma and H. Tsujimoto (2004) Production of wheat–Leymus racemosus chromosome addition lines. Theor. Appl. Genet. 109: 255–260.
- Larson, S.R., M. Kishii, H. Tsujimoto, L.L. Qi, P.D. Chen, G.R. Lazo, K.B. Jensen and R.R.-C. Wang (2012) Leymus EST linkage maps identify 4NsL–5NsL reciprocal translocation, wheat-Leymus chromosome introgressions, and functionally important gene loci. Theor. Appl. Genet. 124: 189–206.
- Liu, X., J. Shi, X.-Y. Zhang, Y.-S. Ma and J. -Z (2001) Screening salt tolerance germplasms and tagging the tolerance gene(s) using microsatellite (SSR) markers in wheat. Acta. Bot. Sinica 43: 948–954.
- McGuire, P.E. and J. Dvorak (1981) High salt-tolerance potential in wheatgrasses. Crop Sci. 21: 702–705.
- Moffate, J.M., R.G. Sears and G.M. Paulsen (1990) Wheat high temperature tolerance during reproductive growth. 1. Evaluation by chlorophyll fluorescence. Crop Sci. 30: 881–885.
- Mohammadi, V., M.R. Qannadha, A.A. Zali and B. Yazdi-Samadi (2004) Effect of post anthesis heat stress on head traits of wheat. J. Agr. Biol. 6: 42–44.
- Mujeeb-Kazi, A., M. Bernard, G.T. Bekele and J.L. Minard (1983) Incorporation of alien genetic information from Elymus giganteus into Triticum aestivum. In: Sakamoto, S. (ed.) Proceedings of the 6th International Wheat Genetic Symposium, Maruzen, Kyoto, pp. 223–231.
- Nagarajan, S., G. Singh and B.S. Tyagi (1998) Wheat: Research Needs Beyond 2000 A.D. Narosa Publishing House, New Delhi.
- Porter, D.R., H.T. Nguyen and J.J. Burke (1994) Quantifying acquired thermal tolerance in winter wheat. Crop Sci. 34: 1686–1689.
- Qi, L.L., S.L. Wang, P.D. Chen, D.J. Liu, B. Friebe and B.S. Gill (1997) Molecular cytogenetic analysis of Leymus racemosus chromosomes added to wheat. Theor. Appl. Genet. 95: 1084–1091
- Qi, L.L., M.O. Pumphrey, B. Friebe, P.D. Chen and B.S. Gill (2008) Molecular cytogenetic characterization of alien introgressions with gene Fhb3 for resistance to Fusarium head blight disease of wheat. Theor. Appl. Genet. 117: 1155–1166.
- Reynolds, M.P., M. Balota, M.I.B. Delgado, I. Amani and R.A. Fischer (1994) Physiological and morphological traits associated with spring wheat yield under hot, irrigated conditions. Aust. J. Plant Physiol. 21: 717–730.
- Smillie, R.M. and S.E. Hetherington (1983) Stress tolerance and stress induced injury in crop plants measured by chlorophyll fluorescence in vivo. Chilling, freezing, ice cover, heat and high light. Plant Physiol. 74: 1043–1050.
- Stone, P.J. and M.E. Nicolas (1994) Wheat cultivars vary widely in their responses of grain yield and quality to short periods of post-anthesis heat stress. Aust. J. Plant Physiol. 21: 887–900.
- Subbarao, G.V., B. Tomohiro, K. Masahiro, I. Osamu, H. Samejima, H.Y. Wang, S.J. Pearse, S. Gopalakrishnan, K. Nakahara, A.K.M. Zakir-Hossain et al. (2007) Can biological nitrification inhibition (BNI) genes from perennial Leymus racemosus (Triticeae) combat nitrification in wheat farming? Plant Soil 299: 55–64.
- Tahir, I.S.A. and N. Nakata (2005) Remobilization of nitrogen and carbohydrate from stems of bread wheat in response to heat stress during grain filling. J. Agron. Crop Sci. 191: 105–116.
- Tahir, I.S.A., N. Nakata, A.M. Ali, H.M. Mustafa, A.S.I. Saad, K. Takata, N. Ishikawa and O.S. Abdalla (2006) Genotypic and temperature effects on wheat grain yield and quality in a hot-irrigated environment. Plant Breed. 125: 323–330.
- Tewolde, H., C.J. Fernandez and C.A. Erickson (2006) Wheat cultivars adapted to post-heading high stress. J. Agron. Crop Sci. 192: 111–120.
- Wang, S., L. Yin, H. Tanaka, K. Tanaka and H. Tsujimoto (2010) Identification of wheat alien chromosome addition lines for breeding wheat with high phosphorus efficiency. Breed. Sci. 60: 372–379.
- Wang, L.S. and P.D. Chen (2008) Development of Triticum aestivum–Leymus racemosus ditelosomic substitution line 7Lr#1S (7A) with resistance to wheat scab and its meiotic behavior analysis. Chin. Sci. Bull. 53: 3522–3529.
- Wardlaw, I.F. (2002) interaction between drought and chronic high tempreture during kernel filling in wheat in a controlled environment. Ann. Bot. 90: 469–476.
- Yang, J., R.G. Sears, B.S. Gill and G.M. Paulsen (2002) Growth and senescence characteristics associated with tolerance of wheat-alien amphiploids to high temperature under controlled conditions. Euphytica 126: 185–193.