Abstract
Many important apple (Malus × domestica Borkh.) fruit quality traits are regulated by multiple genes, and more information about quantitative trait loci (QTLs) for these traits is required for marker-assisted selection. In this study, we constructed genetic linkage maps of the Japanese apple cultivars ‘Orin’ and ‘Akane’ using F1 seedlings derived from a cross between these cultivars. The ‘Orin’ map consisted of 251 loci covering 17 linkage groups (LGs; total length 1095.3 cM), and the ‘Akane’ map consisted of 291 loci covering 18 LGs (total length 1098.2 cM). We performed QTL analysis for 16 important traits, and found that four QTLs related to harvest time explained about 70% of genetic variation, and these will be useful for marker-assisted selection. The QTL for early harvest time in LG15 was located very close to the QTL for preharvest fruit drop. The QTL for skin color depth was located around the position of MYB1 in LG9, which suggested that alleles harbored by ‘Akane’ are regulating red color depth with different degrees of effect. We also analyzed soluble solids and sugar component contents, and found that a QTL for soluble solids content in LG16 could be explained by the amount of sorbitol and fructose.
Introduction
Apple (Malus × domestica Borkh.) is one of the most economically important fruit crops grown commercially throughout the world’s temperate regions. The global commercial apple production was more than 75 Mt in 2011 (FAOSTAT, http://faostat.fao.org). However, the market requires new apple cultivars with higher quality, including superior sweetness, crispness, skin coloring, and shelf life. Therefore, more advanced strategies and techniques are required to support apple breeding programs and satisfy the various needs of the market. Up to the present, molecular markers tightly linked to simply inherited traits have been developed, including markers for apple scab resistance, ethylene production and fruit skin color (Ban et al. 2007, Harada et al. 2000, Koller et al. 1994, Manganaris et al. 1994, Takos et al. 2006, Yang and Krüger 1994). However, many important apple fruit quality traits are quantitatively controlled and regulated by multiple genes (Brown 1960, Brown and Harvey 1971); therefore, it is necessary to conduct QTL analysis to understand genetic regulation of these traits. The QTLs for mechanical and textural properties of fruits were reported for a ‘Prima’ × ‘Fiesta’ population for the first time (King et al. 2000, 2001). Since then, QTLs for other fruit quality traits, including harvest time, acidity, and soluble solid content (Brix) were identified (Kenis et al. 2008, Liebhard et al. 2003b). QTL analysis has been subsequently used for close examination of firmness, acidity, fruit weight, and other factors that affect fruit quality (Chagné et al. 2012, Costa et al. 2010, Devoghalaere et al. 2012, Xu et al. 2011). In these reports of QTL analysis, the physical relationships between QTLs for various traits were identified, but the association between the directions of allelic effects (positive or negative) of these QTLs has not been presented. Because breeders are interested in whether alleles associated with desirable phenotypes for the target trait are linked to alleles associated with undesirable phenotypes for other traits, the directions of allelic effect should be carefully evaluated.
In Japan, apple is also a major crop, with gross production exceeded only by those of rice, tomato, orange, strawberry, cucumber, and welsh onion (Ministry of Agriculture, Forestry and Fisheries, http://www.maff.go.jp/j/tokei/index.html). Almost all of the cultivars that have recently been bred in Japan are derived from eight founders: ‘Golden Delicious’, ‘Jonathan’, ‘Delicious’, ‘Indo’, ‘Ralls Janet’, ‘Worcester Pearmain’, and ‘McIntosh’. Unfortunately, ‘Prima’, ‘Fiesta’, ‘Discovery’, ‘Telamon’, and ‘Braeburn’ are the main cultivars that have been used for QTL analysis for fruit quality traits, as these are important cultivars in European countries (Kenis et al. 2008, King et al. 2000, 2001, Liebhard et al. 2003b), and have rarely been used for domestic Japanese breeding programs. The difference in breeding targets, as well as founder effect, may have contributed to the genetic difference between European and Japanese cultivars, therefore, QTL controlling fruit quality traits may be different between them. Furthermore, because apple phenotypes are strongly influenced by the cultivation location and environmental conditions (Liebhard et al. 2003b), QTLs for practical use should be identified based on the phenotype data collected in the target cultivation environment. However, we found no or few reports of QTL analysis for fruit quality traits under Japanese conditions.
Recently, hundreds of SSR markers have been published for apple and pear (Dyk et al. 2010, Liebhard et al. 2002, Moriya et al. 2012, Nishitani et al. 2009, Silfverberg-Dilworth et al. 2006), and were used to construct genetic linkage maps with a high marker density and high quality. Common SSR markers could be used to anchor newly constructed genetic maps to the reference genetic maps previously reported. The apple genomic information published by Velasco et al. (2010) enables us to not only design novel SSR markers in a target genome region, but also to find candidate genes for identified QTLs. Therefore, QTL analyses can be efficiently applied to support apple breeding programs.
In this study, we aimed (1) to identify the QTLs for key fruit quality traits, using phenotypic data from seedlings obtained from the Japanese apple ‘Orin’ × ‘Akane’ cross under Japanese cultivation conditions; (2) to identify the QTLs for newly evaluated traits such as occurrence of russet, the depth of the red color of the fruit skin, preharvest fruit drop, and the content of sugar components; (3) to determine the relationship among directions of allelic effects of linked QTLs; and (4) to evaluate the proportion of genetic variance explained by the QTLs, and assess the practical ability to take advantage of these QTLs in apple breeding.
Materials and Methods
Plant materials and harvest
In this study, we used intraspecific hybrids between the apple cultivars ‘Orin’ and ‘Akane’ based on crosses performed in 2004. The population consisted of 137 F1 seedlings. ‘Orin’ is a descendant of ‘Golden Delicious’ × ‘Indo’, and produces green, juicy, and sweet fruits. ‘Akane’ is derived from ‘Jonathan’ × ‘Worcester Pearmain’, and produces small, vividly red fruits with high acidity (Sadamori et al. 1973). Supplemental Fig. 1 summarizes the phenotypic traits of the F1 population and parents. This hybrid progeny was seeded in 2005, grafted onto ‘JM1’ rootstock in 2006, and planted in a field at the NARO Institute of Fruit Tree Science (Morioka, Japan) in 2008. The seedlings were planted at a spacing of 0.6 m, with 3.0 m between rows. Fruit samples were harvested in 2010, 2011, and 2012 from mid-September to early-November. Fruits from individual seedlings were harvested once a week at maturity, when the ground color at the calyx end changed from green to yellowish-green. All fruits on the tree were harvested, and basically two fruits of moderate size were selected for quality measurements. We used additional two fruits on the sunny branch for the evaluation of fruit skin color.
Fruit quality measurements
We assessed 16 traits (Table 1). Several traits (harvest time, russet occurrence on the calyx side, russet occurrence on the pedicel side, depth of skin color, and juiciness) were evaluated visually and sensory in all three years. The fruit weight, firmness, preharvest fruit drop, acidity, and soluble solids content were numerically measured in 2011 and 2012. The sugar composition, juice browning, and flowering date were evaluated in 2012. The average value of data obtained during 2 or 3 years was used for statistical and QTL analyses.
Table 1
Fruit quality traits and units of measurement used for the QTL analyses in the ‘Orin’ × ‘Akane’ F
1 population
|
|
Trait |
Description (assessment type) |
| Evaluated year |
2010–2012 |
Harvest time (weeks) |
Number of weeks before or after the fruit of ‘Akane’ were harvested |
| Russet-Calyx (%) |
Proportion of area covered with russet, examined from the calyx side (visual) |
| Russet-Pedicel (%) |
Proportion of area covered with russet, examined from the pedicel side (visual) |
| Depth of skin color |
Rank: 1 (pale red), 2 (normal red), 3 (dark/vivid red) (visual) |
| Juiciness |
Juiciness during chewing after peeling. Rank: 1 (dry), 2 (slightly dry), 3 (intermediate), 4 (slightly juicy), 5 ( juicy) (sensory) |
| 2011–2012 |
Weight (g) |
Mean fruit fresh weight |
| Firmness (lb) |
Mean firmness of sunny and shaded sides of the fruit (Magness-Taylor penetrometer) |
| Preharvest fruit drop (%) |
Proportion of the fruits that dropped before the harvest time |
| Acidity (%) |
Acidity of juice, obtained from a mixture of two fruits per tree (titratable acid content) |
| Soluble solids content (Brix) |
Brix value of the juice, obtained using a refractometer |
| 2012 |
Sucrose (mg/mL) |
Sucrose content of the juice, obtained using a high-performance liquid chromatograph (HPLC) |
| Glucose (mg/mL) |
Glucose content of the juice, obtained using an HPLC |
| Fructose (mg/mL) |
Fructose content of the juice, obtained using an HPLC |
| Sorbitol (mg/mL) |
Sorbitol content of the juice, obtained using an HPLC |
| Juice browning |
Browning degree of the fruit juice Rank: 1 (nil), 2 (slight), 3 (moderate), 4 (strong), 5 (extreme) (visual) |
| Flowering date (Day) |
The date in May when the first flower opened |
Harvest time for the individual seedlings was scored by comparing the harvest time of ‘Akane’ (weeks before or after ‘Akane’), and the score was modified only if the taste tests suggested the fruits were too ripe or not yet ripe. Two whole fruits were homogenized using an electric blender, and the juice was separated from the homogenate using a paper filter to assess the acidity, soluble solids content, content of the sugar components, and degree of juice browning. The detailed method for measurement of each trait is shown in Table 1. Acidity and the soluble solids content were measured on the day of harvest, and the remaining juice was stored at −20°C until fruits from all seedlings had been harvested. Juice browning was visually assessed using the melted juice after storage at room temperature for 5 h. For the measurement of sugar components, we diluted the juice with distilled water to 10% of its original concentration, and added mannitol as an internal standard (at 0.5 mg/mL final concentration). We purified the solution using StrataSAX (Shimadzu, Kyoto, Japan) and used it to measure the sucrose, glucose, fructose, and sorbitol contents by high-performance liquid chromatography (HPLC) on a REZEX PCM-Monosaccharide column (Shimadzu). The rate of preharvest fruit drop was calculated as follows: The number of fruits on the trees was counted from late August to early September (about 2 weeks before harvesting of the earliest trees). At the harvest time, all fruits remaining on the trees were counted, and the number of dropped fruits was calculated by subtraction. The ratio of the number of dropped fruits to the total number of fruits was used for the QTL analysis.
Statistical analyses
We used the D’Agostino-Pearson K2 test and the Kolmogorov-Smirnov test to check the normality of the data distribution for each trait, with p > 0.05 indicating a normal distribution. For harvest time, juiciness, firmness, acidity, and soluble solids content, phenotypic values of each seedling with two or three yearly repetitions were subjected to analysis of variance (ANOVA) in one-way classification with the factor of seedling. The statistical model of ANOVA is expressed as
|
p
i
j
=
μ
+
g
i
+
e
i
j
(
i
=
1
,
2
,
…
,
G
,
j
=
1
,
2
,
…
,
N
i
)
, |
where pij is the phenotypic value of a trait for the ith F1 seedling in the jth replicate, μ is a grand mean, gi is the genotypic value of the ith seedling and eij is a residual following N(0, σ2e), with G and Ni being the number of F1 seedlings evaluated for the trait and the number of replicates for the ith seedling, respectively. The numbers of replicates were different among seedlings depending on traits, i.e. Ni = 1 to 3 corresponding to years of measurements. The genetic variance σ2g, which was regarded as among-seedling variance, was approximately estimated as ∑i Ni(gi − ḡ )2/∑i Ni, where ḡ = ∑i Ni gi/∑i Ni. Expectation of mean square among-seedling (MSA) was expressed as σ2e + ∑i Ni σ2g/(G − 1) and expectation of mean square of residuals (MSR) was σ2e. Denoting the estimates of σ2g and residual variance σ2e by
σ
^
g
2
and
σ
^
e
2
, respectively,
σ
^
g
2
and
σ
^
e
2
were calculated as
σ
^
g
2
= (G − 1) (MSA − MSR)/∑i Ni and
σ
^
e
2
= MSR. The estimate of broad-sense heritability (h2) of a trait was estimated as
σ
^
g
2
/
σ
^
g
2
+
σ
^
e
2
. These statistical analyses were carried out using the PASW software (http://www.spss.com.hk/statistics/) or the R software (http://www.r-project.org/). We estimated the harvest time of F1 individuals as below, under the assumption that the effect of QTLs is additive:
where Pi represents the predicted (estimated) score of the ith seedling, P0 represents the score of a virtual seedling possessing alleles with no effect for all detected QTLs, and qik is the effect of possessing alleles for the detected QTL locus k in the ith seedling. The total effect of the QTLs in the ith seedling is represented as ∑k qik, and P0 was estimated as follows:
|
P
0
=
∑
i
(
p
i
-
∑
k
q
i
k
)
/
G
, |
with pi = ∑j pij/Ni, where G, pij and Ni are determined in the same way as the statistical model for ANOVA. The allele type for each QTL of an individual seedling was assumed to be the same as the allele detected using the marker nearest to the QTL.
Genetic linkage maps
We used 137 F1 individuals derived from a testcross of ‘Orin’ × ‘Akane’ for genome mapping. Genomic DNA was extracted from young leaves using a Genomic-tip 20/G kit (Qiagen, Hilden, Germany). We used 362 simple sequence repeat (SSR) primer pairs for genotyping of the F1 progeny, including 265 developed for apple and 97 for pear (Pyrus pyrifolia Nakai). Of the 265 apple SSRs, 254 were previously published (Table 2), and the remaining 11 were newly designed by referring to the published genome sequence of ‘Golden Delicious’ (Supplemental Table 1). All pear SSRs were published or registered in public nucleotide databases (Table 2), except for the BCA141 marker developed by the method of Yamamoto et al. (2002c) (Supplemental Table 1). SSR amplifications were performed in a final volume of 5 μL that contained 2.5 μL of Go Taq Green Master Mix (Promega, Fitchburg, Wisconsin USA), 2 pmol of each primer, and 2.5 ng of genomic DNA. PCR conditions were as follows: 95°C for 5 min; 35 cycles of 95°C for 1 min, 55°C for 1 min, and 72°C for 2 min; and a final extension at 72°C for 7 min. PCR products were separated using a 3130 xl genetic analyzer (ABI Life Technologies, Carlsbad, California USA). When multiple loci were detected by a single primer pair, they were distinguished by adding “−1” or “−2” to the marker name. We also used five gene-specific markers for the genetic mapping: the S-RNase gene (Kim et al. 2009), ACC oxidase-1 gene (MdACO1, Costa et al. 2005), two 1-aminocyclopropane-1-carboxylate synthase genes (MdACS1, Harada et al. 2000; MdACS3, Bai et al. 2012), and an expansin gene (MdExp7, Costa et al. 2008).
Table 2
SSR and other molecular markers mapped in the genetic linkage maps of ‘Orin’ and ‘Akane’
| Marker type |
Marker designation |
Reference |
| Apple SSRs |
Mdo.chr |
Present study (Supplemental Table 1) |
| AF, AU, CN, Hi, U, Z, GD |
Silfverberg-Dilworth et al. (2006) |
| CH, MS, COL |
Liebhard et al. (2002) |
| MDAJ, U50187SSR |
http://www.hidras.unimi.it/index.php |
| MEST |
Moriya et al. (2012) |
| NZms |
Celton et al. (2009) |
| SAms |
Dyk et al. (2010) |
| MdACS3 |
Bai et al. (2012) |
| MdExp7 |
Costa et al. (2008) |
| Apple In/Desertion |
MdACO1 |
Costa et al. (2005) |
| MdACS1 |
Harada et al. (2000) |
| Apple CAPS |
S-RNase |
Kim et al. (2009) |
| Pear SSRs |
HGA, KA |
Yamamoto et al. (2002c) |
| EMPc |
Fernandez-Fernandez et al. (2006) |
| NB |
Yamamoto et al. (2002a), AB302424-302443 |
| NH |
Yamamoto et al. (2002a, 2002b), Sawamura et al. (2004), AB302413–302421 |
| IPPN |
Inoue et al. (2007) |
| TsuENH |
Nishitani et al. (2009), AB621906–621908, AB853161–853256 |
| TsuGNH |
Yamamoto et al. (2013), AB851450–851453 |
We constructed genetic linkage maps for ‘Orin’ and ‘Akane’ using the double pseudo-testcross mapping strategy (Grattapaglia and Sederoff 1994). Map construction was carried out using JoinMap 4.0 (van Ooijen 2006). The marker segregation data were rescored as the “BC (backcross)” population data, and grouped with the logarithm of odds (LOD) = 4.0 using the regression mapping module. Map distances were calculated using the Kosambi map function provided by the software. For construction of an integrated linkage map, we rearranged the scored data of both parents as the “CP (cross between two heterogeneously heterozygous and homozygous diploid parents)” population data and grouped them under the same conditions as the “BC” population data. We numbered the LGs and validated the SSR locus order using the apple reference maps published by Liebhard et al. (2003a) and Silfverberg-Dilworth et al. (2006).
QTL analysis
QTL analysis was performed using the MapQTL 6.0 software (van Ooijen 2009). The QTL identification was initially performed using the parental maps of ‘Orin’ and ‘Akane’ separately; the data were then reanalyzed using an integrated map to reconfirm the QTLs detected on the parental linkage maps. Additionally, we performed the yearly QTL analyses for the validation, using data of each year.
QTL analysis was initially performed using interval mapping for all traits with 5000 cycles of permutation test to determine the empirical genome-wide significance level for LOD score. The point with the maximum LOD score, which was significant at p < 0.05 level, was regarded as the tentative QTL position. Subsequently, we performed the multiple QTL mapping (MQM) analysis using the markers nearest to the tentative QTL positions as cofactors, and QTLs significant at p < 0.10 level were identified. When no other significant QTL was detected on the same LG in MQM, we used restricted multiple QTL mapping (rMQM) module. We used the non-parametric Kruskal-Wallis test module for traits with a non-normal distribution to confirm the significance of the marker nearest to the detected QTL. The origin of alleles with an allelic effect (+ or −) for the QTL was determined based on the SSR genotypes of ‘Golden Delicious’ and ‘Indo’ (the parental cultivars of ‘Orin’), and the SSR genotypes of ‘Jonathan’ and ‘Worcester Pearmain’ (the parental cultivars of ‘Akane’).
Results
Phenotype data
In total, 83, 126, and 115 F1 seedlings produced sufficient fruits for evaluation in 2010, 2011, and 2012, respectively. Since a total of 130 seedlings bore fruits for analysis in at least one of the three years, statistical analysis was carried out using the phenotype data for them. Supplemental Fig. 1 provides the frequency distributions of the F1 seedlings and their parental cultivars for the evaluated traits. ‘Orin’ is not shown in the histogram for skin color because its skin was green, and all of the progeny showed at least some degree of red skin color. Phenotypic differences were notable between the parental cultivars for harvest time, skin color, juiciness, weight, preharvest fruit drop, acidity, and the contents of sucrose and fructose. In contrast, no or small differences were observed between them for russet in calyx side, firmness, sorbitol content, juice browning, and flowering date. However, all parameters showed wide range of distributions in F1 population.
All phenotypic traits were assessed to determine whether the data was normally distributed. As a result, russet occurrence (on both the calyx and pedicel sides), depth of the skin color, preharvest fruit drop, sorbitol content, juice browning, and flowering date were not normally distributed. For these non-normally distributed traits, QTLs were identified using Kruskal-Wallis single-locus analysis, in addition to the (r)MQM mapping.
Genetic linkage maps of ‘Orin’ and ‘Akane’
Five gene-specific markers and 362 SSR markers were used for map construction. The linkage map of ‘Orin’ consisted of 251 loci, and covered 17 LGs (OR1 to OR17), with a total genetic distance of 1095.3 cM. The linkage map of ‘Akane’ consisted of 291 loci, and covered 18 LGs (AK1 to AK17-2), with a total genetic distance of 1098.2 cM (Fig. 1, Supplemental Table 2). The integrated map comprised 17 LGs with a total genetic distance of 1209.5 cM (Supplemental Fig. 2). The average distances between markers in the maps for ‘Orin’ and ‘Akane’ were 4.4 cM and 3.8 cM, respectively. Gaps wider than 30 cM were identified in one LG of ‘Orin’ (OR5) and in four LGs of ‘Akane’ (AK2, AK3, AK5, and AK7).
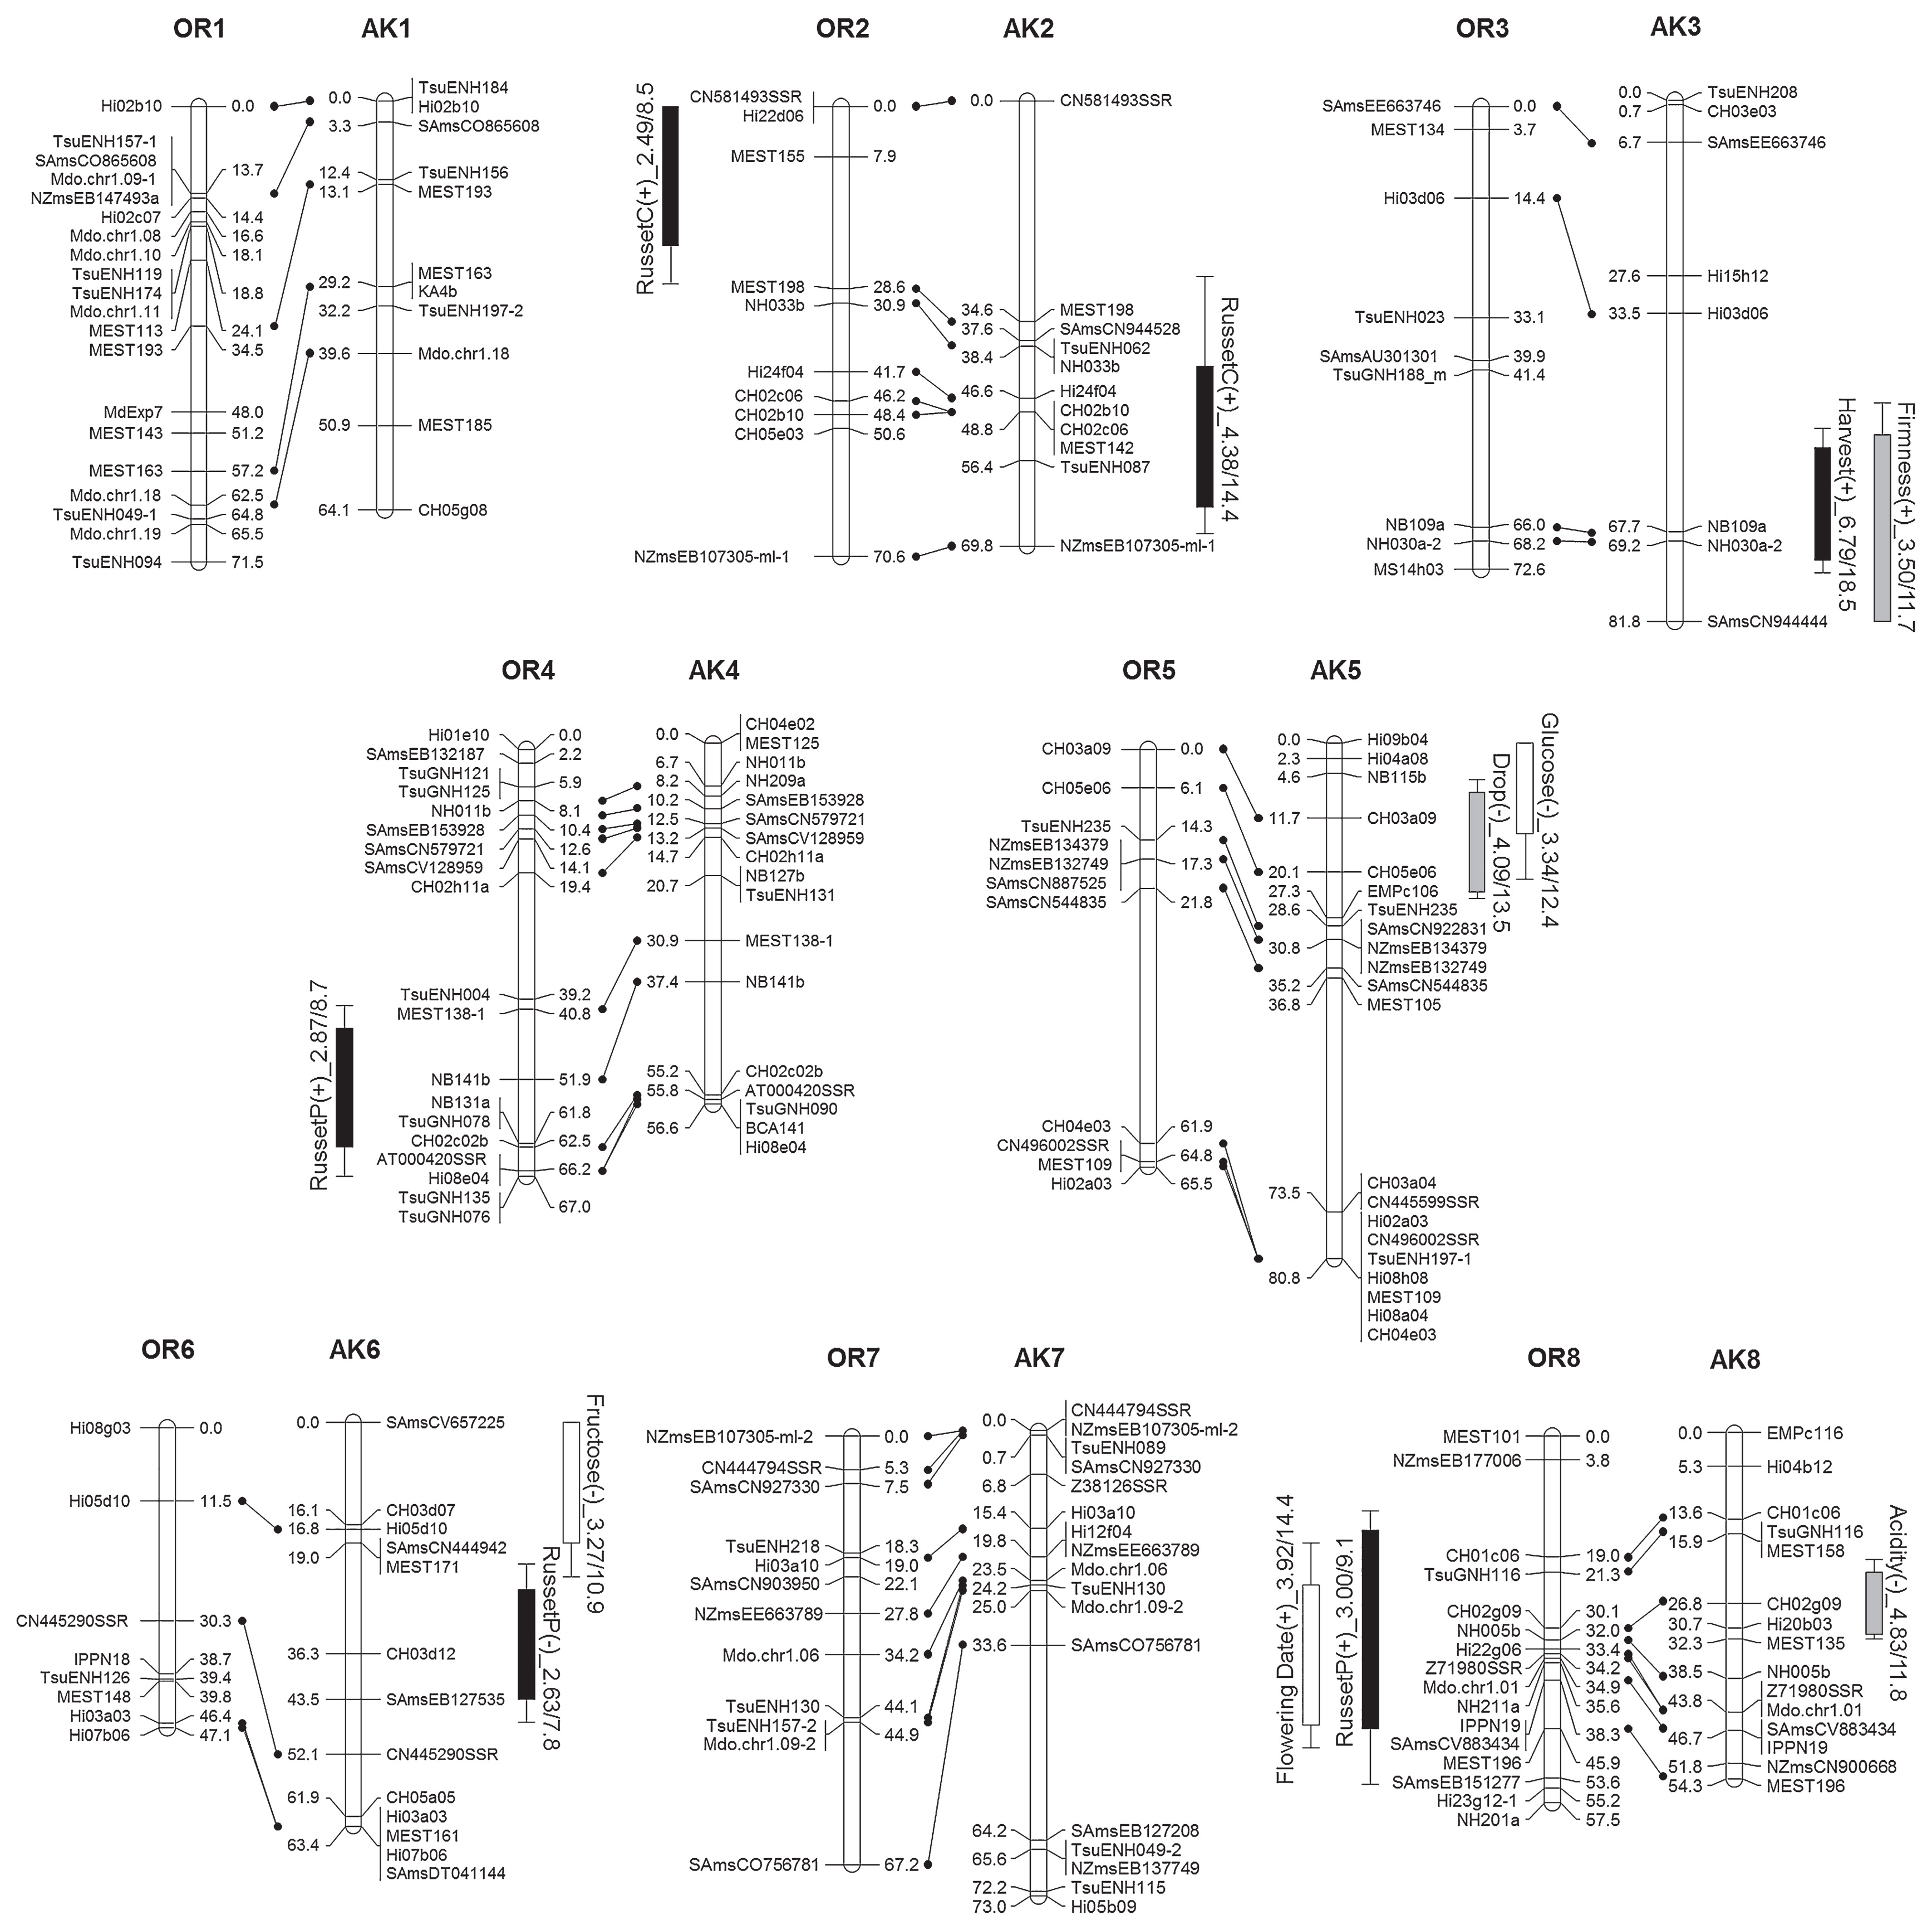

The bottom region of LG OR13 is missing because all 15 markers that were believed to be located there showed homozygous genotypes for ‘Orin’, and showed no segregation for all of the F1 population. Our results showed that LG17 of ‘Akane’ was divided into two LGs, AK17-1 and AK17-2, with the S-RNase locus as the break point. Since the S genotypes of ‘Orin’ and ‘Akane’ are S2S7 and S7S24, respectively, all offspring inherited the S24 allele from ‘Akane’ and the two LGs could not be connected.
QTLs for harvest time and association with the QTL for preharvest fruit drop
QTLs, which were identified by MQM (rMQM) analyses, with a LOD score significant at p < 0.10 were listed in Table 3. Significant QTLs for harvest time with a moderate effect were identified in LGs OR15, OR16, AK3, and AK10 (Fig. 1, Table 3). The total proportion of the phenotypic variance explained by these four QTLs was 57.2%. To understand the effect of the detected QTLs, we estimated the harvest time in the tested F1 population using these four QTLs, and compared the estimate with the observed phenotype (Fig. 2). The coefficient of determination was 0.544 and was significant (p < 0.001), indicating that these four QTLs could be effectively used for marker-assisted selection.
Table 3
Significant QTLs detected in the ‘Orin’ × ‘Akane’ F
1 population
| Map |
Orin |
Akane |
Previously reported |
| Traits |
LG |
Position (cM) |
LOD |
Significancea |
% var. |
Nearest marker |
LG |
Position (cM) |
LOD |
Significancea |
% var. |
Nearest marker |
| Harvest |
|
|
|
|
|
|
3 |
66.5 |
6.79 |
***** |
18.5 |
NB109a |
Liebhard et al. (2003b) |
|
|
|
|
|
|
|
10 |
30.9 |
3.87 |
*** |
10.0 |
CH01f12 |
Kenis et al. (2008) |
|
15 |
66.2 |
3.93 |
*** |
10.7 |
CH02d11 |
|
|
|
|
|
|
– |
|
16 |
27.6 |
6.28 |
***** |
18.0 |
TsuENH182-2 |
|
|
|
|
|
|
Kenis et al. (2008) |
| Russet-Calyxb |
2 |
1.0 |
2.49 |
* (KW: ****) |
8.5 |
Hi22d06 |
2 |
50.9 |
4.38 |
*** (KW: *****) |
14.4 |
CH02c06 |
– |
| Russet-Pedicelb |
4 |
53.9 |
2.87 |
** (KW: *****) |
8.7 |
NB141b |
|
|
|
|
|
|
– |
|
8 |
37.6 |
3 |
** (KW: *****) |
9.1 |
SAmsCV883434 |
|
|
|
|
|
|
– |
|
|
|
|
|
|
|
6 |
36.3 |
2.63 |
* (KW: ***) |
7.8 |
CH03d12 |
– |
|
|
|
|
|
|
|
15 |
87.0 |
3.51 |
*** (KW: *****) |
11.7 |
MEST128 |
– |
| Depth of Skin Colorb |
|
|
|
|
|
|
9 |
69.4 |
5.12 |
**** (KW: *****) |
15.1 |
EMPc115 |
– |
|
|
|
|
|
|
|
16 |
15.5 |
2.92 |
** (KW: ****) |
8.3 |
Hi15a13 |
– |
| Juiciness |
15 |
39.2 |
3.81 |
*** |
11.7 |
TsuENH047 |
|
|
|
|
|
|
– |
|
16 |
14.1 |
2.9 |
** |
8.7 |
CH05c06 |
|
|
|
|
|
|
King et al. (2000, 2001) |
| Firmness |
10 |
47.0 |
3.96 |
*** |
11.7 |
MEST124 |
|
|
|
|
|
|
King et al. (2000, 2001) |
|
11 |
6.3 |
3.4 |
** |
10.1 |
IPPN02 |
|
|
|
|
|
|
Liebhard et al. (2003b) |
|
|
|
|
|
|
|
3 |
74.2 |
3.5 |
** |
11.7 |
NH030a-2 |
King et al. (2000, 2001) |
| Preharvest Fruit Dropb |
15 |
62.5 |
11.87 |
***** (KW: *****) |
34.3 |
MdACS1 |
|
|
|
|
|
|
Sato et al. (2004) |
|
|
|
|
|
|
|
5 |
16.1 |
4.09 |
*** (KW: *****) |
13.5 |
CH05e06 |
– |
| Acidity |
|
|
|
|
|
|
8 |
26.8 |
4.83 |
**** |
11.8 |
CH02g09 |
Liebhard et al. (2003b) |
|
|
|
|
|
|
|
15 |
42.7 |
2.69 |
* |
5.7 |
Hi02d02 |
Kenis et al. (2008) |
|
16 |
8.6 |
7.8 |
***** |
24.1 |
CH05c06 |
16 |
6.2 |
9.36 |
***** |
24.8 |
Hi12a02 |
Liebhard et al. (2003b) |
| °Brix |
15 |
62.5 |
4.88 |
**** |
13.2 |
MdACS1 |
|
|
|
|
|
|
– |
|
16 |
16.6 |
8.26 |
***** |
22.5 |
CH05c06 |
16 |
22.0 |
3.03 |
** |
10.2 |
Hi15a13 |
– |
| Sucrose |
|
|
|
|
|
|
10 |
26.3 |
4.21 |
*** |
14.3 |
TsuENH109 |
– |
|
|
|
|
|
|
|
15 |
92.5 |
3.06 |
** |
10.1 |
MEST147 |
– |
| Glucose |
|
|
|
|
|
|
5 |
0.0 |
3.34 |
** |
12.4 |
Hi09b04 |
– |
| Fructose |
|
|
|
|
|
|
6 |
8.6 |
3.27 |
** |
10.9 |
CH03d07 |
– |
|
|
|
|
|
|
|
16 |
18.5 |
3.00 |
** |
10.0 |
Hi15a13 |
– |
| Sorbitolb |
12 |
23.6 |
2.79 |
* (KW: ****) |
10.5 |
CH05d11 |
– |
|
|
|
|
|
|
|
|
|
|
|
|
|
16 |
15.5 |
3.74 |
*** (KW: ****) |
13.8 |
Hi15a13 |
– |
| Juice browningb |
10 |
54.6 |
2.72 |
* (KW: ***) |
10.2 |
Hi22f04 |
10 |
19.3 |
4.89 |
**** (KW: *****) |
11.5 |
NH039a |
Mellidou et al. (2012) |
|
|
|
|
|
|
|
16 |
9.3 |
10.55 |
***** (KW: *****) |
28.2 |
TsuENH022 |
Mellidou et al. (2012) |
| Flowering dateb |
8 |
38.3 |
3.92 |
*** (KW: ****) |
14.4 |
IPPN19 |
|
|
|
|
|
|
Segura et al. (2007) |
|
|
|
|
|
|
|
15 |
86.3 |
9.63 |
***** (KW: *****) |
31.8 |
Hi09f01 |
– |
The QTLs for weight was not presented, because no significant QTL was identified.
The peak with the highest LOD is presented as the QTL, followed by its position and the percentage of the phenotypic variance that it explained (% var.).
a Asterisks (*, **, ***,****,*****) represent significance level of
p < 0.10, <0.05, <0.01, <0.001, <0.0001, respectively.
b The significance of QTLs for traits with a non-normal distribution was confirmed using the Kruskal-Wallis (KW) single-locus analysis, using the nearest marker. Major QTLs that explained >20% variance are indicated in bold.

We also analyzed preharvest fruit drop and identified a major QTL in LG OR15, in addition to a minor QTL in LG AK5. The peak of the QTL in LG OR15 was located at the MdACS1 marker; which was consistent with a previous report that ACS1 was associated with fruit drop by ethylene production (Sato et al. 2004). In this study, the median fruit drop rates of individuals which inherited the ACS1-1 and ACS1-2 alleles from ‘Orin’ were 35.4% and 8.6%, respectively. The significance level for the difference between the two alleles was p < 0.001 (Kruskal-Wallis test); this confirms that ACS1 was associated with fruit drop. The LOD peak of the QTL for harvest time in LG OR15 was quite close to MdACS1; they were separated by less than 4 cM. The allele for early ripening was in a coupling phase with the ACS1-1 allele for accelerating fruit drop, which is problematic for fruit yield. Early ripening, as well as fruit drop, could be the results of ethylene production by ACS1-1 allele. In Fig. 3, we presented the relationships between harvest time of tested F1 individuals and their ACS1 alleles. The average score for harvest time of individuals which inherited the ACS1-1 and ACS1-2 alleles were 1.39 and 2.84, respectively. The significance level for the difference between the two alleles was p < 0.001 (one-way ANOVA). All five seedlings that were harvested more than 2 weeks earlier than ‘Akane’ (observed score < −2), had the ACS1-1 allele. The observed score of the earliest-ripening seedling without the ACS1-1 allele was “−1.5”.

In this study, QTLs were not identified for the “existence” of red pigmentation, since all of the F1 progeny had at least some red in their skin, but were detected for the “depth” of the red coloration of the fruit skin (Table 1). Two QTLs for this parameter were identified, in LGs AK9 and AK16 (Table 3). The QTL in LG AK9 showed a relatively high LOD score of 5.12, and the peak LOD was located at the EMPc115 marker, at the bottom end of this LG.
QTLs for Brix and for the sugar composition
We detected significant QTLs for Brix in LGs OR15, OR16, and AK16. The QTL regions in LG16 for both ‘Orin’ and ‘Akane’ maps overlapped greatly, and explained up to 35.2% of the phenotypic variance in the integrated map (Supplemental Fig. 2).
Since sugar metabolism is complex and the QTLs for Brix were sometimes detected in different regions by the population (Kenis et al. 2008, Liebhard et al. 2003b), we also assessed the contents of sucrose, glucose, fructose, and sorbitol. The average proportions in juice from the F1 population were 22.1% sucrose, 12.2% glucose, 59.3% fructose, and 6.4% sorbitol. One of the two QTLs for fructose content and a QTL for sorbitol content were identified in LG AK16, near the same position as the QTL for Brix. Considering that these QTLs had the same direction of allelic effects, the QTL for Brix in LG AK16 could be explained by the QTLs for fructose and sorbitol contents. In contrast, the QTLs for Brix in LGs OR16 and AK15 could not be explained by the QTLs for any sugar components (i.e., these QTLs were not detected in similar positions).
QTLs for russet properties
The QTLs for occurrence of russet on the calyx side were detected in LG2 in both parental maps, but their positions were different. The QTLs for russet on the pedicel side were located in LGs OR4, OR8, AK6, and AK15. These results indicated that different factors controlled russet occurrence on the calyx and pedicel sides.
The stability of detected QTLs
The stability of detected QTL was validated by the comparison with the results of yearly QTL analyses (Supplemental Table 3). Almost detected QTLs presented in Table 3 were stably significant in at least two years, except QTLs for traits evaluated in single year. For some QTLs (e.g., QTL for Russet-Calyx on OR2) which were significant in only one year, the LOD peaks were stably detected at the corresponding region in other years, even though they did not reach threshold. The QTLs were not detected in the analyses using average value of data during 2 or 3 years, when the LOD peaks of them were not stably detected among years (e.g. QTL for harvest time on OR6).
Relationships between the directions of allelic effects of the QTLs
The QTLs for harvest time and preharvest fruit drop were near the position of the QTL for Brix in LG OR15, and an allele inherited from ‘Golden Delicious’ was effective to late ripening, suppression of fruit drop, and increased Brix compared to the allele inherited from ‘Indo’ (Fig. 1). The QTLs shared by several traits in LG AK15 showed that the allele from ‘Jonathan’ increased russet occurrence on the pedicel side and sucrose content, and caused late flowering, compared to the allele inherited from ‘Worcester Pearmain’. The allele from ‘Jonathan’ in LG 16 of ‘Akane’ increased the depth of the red skin color and the acid content, and decreased the Brix and degree of juice browning, compared to the another allele. The directions of the allelic effects of the QTLs for harvest time and firmness in LG AK3 indicated that the allele from ‘Jonathan’ is relatively responsible for late ripening and high firmness.
The proportion of the genetic variance explained by the QTLs
The identification of QTLs that explain 100% of the genetic variance would achieve a complete support for marker-assisted selection in breeding programs. Therefore, the proportion of the genetic variance explained by the detected QTLs is an important factor. However, the proportion of variance calculated by MapQTL4.0 is not to genetic variance, but to phenotypic variance. To evaluate the ability of the identified QTLs to explain the genetic variance, we calculated the genetic variance, the broad-sense heritability, and the variance explained by the detected QTL for each of the traits that we multiply evaluated in 2 or 3 years and that had a normal distribution (Table 4).
Table 4
Hereditability of traits, and comparison of the proportions of the genetic variance explained by the detected QTLs (
p < 0.05)
| Trait |
Genetic variance (σ2g ) |
Broad-sense heritability (h2) |
Variance explained by the QTLs (% of σ2g ) |
| Harvest |
4.368 |
0.708 |
LG15 |
0.559 |
| LG16 |
0.94 |
| LG3 |
0.966 |
| LG10 |
0.522 |
| Sum |
2.988 (68.4%) |
| Juiciness |
0.185 |
0.256 |
LG15 |
0.05 |
| LG16a |
0.117 |
| Sum |
0.167 (90.3%) |
| Firmness |
4.094 |
0.256 |
LG10 |
1.237 |
| LG11 |
1.068 |
| LG3 |
1.237 |
| Sum |
3.542 (96.5%) |
| Acidity |
0.031 |
0.845 |
LG8 |
0.004 |
| LG16a |
0.019 |
| Sum |
0.023 (74.2%) |
| Brix |
0.786 |
0.352 |
LG15 |
0.226 |
| LG16a |
0.604 |
| Sum |
0.83 (105.6%) |
The QTLs for russet-calyx, russet-pedicel, skin color, and fruit drop were omitted from these analyses because their data exhibited a non-normal distribution. Weight was also omitted because no significant QTL was identified.
a The variance explained by the QTLs was calculated using data from the integrated map (Supplemental Fig. 2) for QTLs that were assumed to be located at homologous positions in both parents.
For harvest time, the detected QTLs explained 68.4% of the genetic variance. This value was comparable to the value of 74.2% in acidity. The broad-sense hereditability of harvest time (0.71) was also high, following to the value of 0.85 for acidity. For juiciness, firmness and Brix, QTLs explained as much as 90.3%, 96.5%, and 105.6% of genetic variance, respectively. However, the broad-sense hereditability of these traits were less than 0.4.
Discussion
Comparison of the maps and the detected QTLs
The total genetic distances of the maps constructed in this study were both close to 1100 cM, and are close to the lengths of the reference maps for ‘Fiesta’ (1145.3 cM) and ‘Discovery’ (1417.1 cM) (Silfverberg-Dilworth et al. 2006). The marker order in the constructed maps mostly corresponded to that in these reference maps. The markers in both the top and the bottom regions of the constructed LGs were located at almost the same positions as in the reference maps, except that LG OR13 lacked a bottom side in the present study. The newly constructed maps in our study cover almost all of the apple genome.
We identified four notable QTLs for harvest time. The region where the QTLs were detected in LGs AK3, AK10, and OR16 overlapped with previously reported regions (Kenis et al. 2008, Liebhard et al. 2003b). The QTL in LG OR15, near the locus of ACS1, which regulates ethylene production, was detected for the first time in this study, although Sato et al. (2004) reported tendency that harvest time became earlier in cultivars with the ACS1-1/ACS1-1 genotype. We identified the QTLs for Brix in LGs OR15, OR16 and AK16 in this study, though Liebhard et al. (2003b) and Kenis et al. (2008) reported moderate or major QTLs in LG2, LG3, LG6, LG8, LG9, LG10, and LG14; these differences may reflect the complex regulation of sugar content in apple. The positions of the QTLs for juice browning in LGs OR10 and AK16, but not AK10, were consistent with previously reported loci for fruit flesh browning (Mellidou et al. 2012). Kenis et al. (2008) and Kumar et al. (2013) reported the other major QTLs for flesh browning in LGs 9 and 17, indicating that the browning is controlled by several factors. The QTL for flowering date detected in LG OR8 overlapped the locus reported by Segura et al. (2007), but the new QTL detected in LG AK15 in the present study accounted for 31.8% of the phenotypic variance. Many QTLs detected in this study were consistent with the reported ones in European or New Zealand cultivars, while novel considerable QTLs were identified by the analyses of Japanese cultivars.
We detected six QTLs for russet occurrence in LG2, LG4, LG6, LG8, and LG15. Inoue et al. (2006) reported a random amplified polymorphic DNA marker linked to russet occurence in the upper region of LG8 in the Japanese pear map. It will be interesting to compare the QTLs that control russet occurrence in LG8 between apple and pear.
The functions of the detected QTLs
The QTLs for harvest time and firmness were detected in near region of LG AK3, and their effects for earlier ripening and softer flesh were in a coupling phase. Therefore, the responsible factor for these QTLs might be same gene, which controls softening and consequently ripening of the fruits. In LG10, another QTL for harvest time was detected near the position of the polygalacturonase gene (PG), which is assumed to control firmness of fruits (Costa et al. 2010). However, since the QTL detected for harvest time in LG10 was not linked to the QTL for firmness, PG could not be responsible for the difference in harvest time in the tested population. On the other hand, ACS1 in LG15 could be responsible for the difference in harvest time, given its function in ethylene metabolism and the positional consistency between MdACS1 and the QTL for harvest time. However, we could not reject the possibility that the QTL for harvest time is attributed to other unknown gene, because of following two reasons: 1) the LOD peak of QTL for harvest time were stably a bit separated from MdACS1 (Supplemental Table 3), and 2) any QTLs for harvest time was not detected around ACS1 in 2012 analysis, whereas powerful QTL for fruit drop was detected there, i.e. harvest time and fruit drop seemed to be differently regulated. It will be necessary to examine whether recombination could occur between ACS1 and the QTL for harvest time, for the breeding of early-ripening variety without fruit drop.
MYB1/MYBA is the only known single dominant gene responsible for apple skin color (Ban et al. 2007, Takos et al. 2006). The allele combination in ‘Orin’ is MYB1-2/MYB1-3, and both alleles are the non-coloring type (i.e., they produce a green skin color), whereas ‘Akane’ has homozygous red-coloring alleles (MYB1-1/MYB1-1). In the present study, the skin color of all F1 progeny was at least somewhat red due to the presence of the dominant MYB1-1 allele, although the depth of the red varied among the F1 progeny, suggesting that the detected two QTLs in LGs AK9 and AK16 were responsible for the depth of the red color. The top region of LG16 appears to be the hot spot for QTLs related to polyphenolic compounds, where leucoanthocyanidin reductase was located (Chagné et al. 2012). The QTL in LG AK9 was detected at the EMPc115 marker, which is located near MYB1. In the reference genome of ‘Golden Delicious’, the distance between EMPc115 and MYB1 was around 240 kbp. It is interesting that two kinds of alleles, regulating red color depth of apple skin with different effects, exist in the region around MYB1 of ‘Akane’. We supposed that these two alleles might be the subtypes of MYB1-1, or cis-elements of MYB1. Thus, ‘Akane’ appears to be desirable material for a detailed study of molecular function in the development of red coloration of apple skin.
The QTL for Brix was close examined by the sugar components for the first time in apple. One of the QTLs for Brix was explained by the QTLs for sorbitol and fructose content. Two other QTLs for Brix could not be explained by any QTLs for sugar components. These QTLs might be affected in a more complex manner, such as by the amount of sucrose transported, but complicated by sugar inversion. For a more precise analysis of the transported sugars, the pedicels or leaves should be used as the measured materials, in addition to the fruits. It is difficult to define the function of the identified QTLs, because sugar transport is regulated by many factors related to photosynthesis, metabolism, the capacity of sink organs, and so on. Analysis of each sugar component will be indispensable not only in metabolic research but also in QTL research to support the breeding of high-quality apple.
Applications to apple breeding
The assessment of QTLs by the proportion of the genetic variance explained by detected QTLs is important for marker-assisted selection. Liebhard et al. (2003b) reported that genotype explained 45% of the variation in harvest time, whereas all of the identified QTLs contributed only 16% of the phenotypic variance (i.e., 36% of the genotypic variance). Kenis et al. (2008) detected four QTLs for harvest time (in LG3, LG9, LG10, and LG16), which explained as much as 57.2% of the phenotypic variance. However, the meaning of this percentage was unclear, because they did not estimate the genetic variance for the studied traits. In the present study, we estimated the genetic variance of traits related to fruit quality, and showed that the proportion of genetic variance for harvest time explained by detected QTLs was as high as the proportion for fruit acidity. Although the heritability of harvest time was a little lower than that of acidity, the powers of detecting QTL seemed to be comparable between the two traits due to the more repetitions of the evaluation of harvest time than those of acidity. The use of marker-assisted selection for acidity is considered to be practical based on the QTLs in LG8 and LG16. We conclude that the four QTLs detected in this study account for a sufficiently high proportion of genetic variance that they are at a practical level for use in marker-assisted selection for harvest time as well as for acidity. For juiciness, firmness, and Brix, the proportions of genetic variance explained by QTLs were as high as 90.3% to 105.6%. However, the heritability of these traits was less than 0.4, indicating that large environmental effects decreased the accuracy of the analyses. Xu (2003) presented the simulation model showing that the effect of detected QTL could be over-estimated by the Beavis effect, when actual QTL effect or population size was small. In the three traits mentioned above, the QTLs with small effect might be over-estimated, which resulted in the excessive contribution ratio of QTLs. To more precisely assess the QTLs for these traits, analyses should be performed using data that provides higher heritability values (e.g., through the use of more years of data).
The association between the allelic effects of QTLs for important traits has a large impact on the determination of a breeding strategy. In peach, QTL analysis for sugar and organic acid contents showed that the alleles for increasing fruit weight and for decreasing sugar content were linked on chromosome 6 (Etienne et al. 2002). Rice breeders have encountered problems because of the close relationships between alleles for valuable and undesirable agricultural traits, such as the combination of blast disease resistance with lower eating quality (Fukuoka et al. 2009). Troublesome associations between two loci force breeders to sacrifice one of the two traits in their breeding programs, or to search for the rare individuals among a large progeny that exhibit recombination between the two tightly linked loci. In case that valuable and undesirable traits are attributable to pleiotropy of a single gene, the effort to obtain the recombinants should be avoided. The associations among QTLs for various traits found in the present study, such as those for preharvest fruit drop, early ripening and low Brix on LG15, will be useful for supporting apple breeding programs in Japan, where ‘Orin’, ‘Akane’, and their related varieties have been frequently used as breeding materials.
Acknowledgments
We thank Dr. Masahiko Yamada of NARO Institute of Fruit Tree Science for providing valuable advice concerning genetic statistics. This study was partly supported by grants from the Ministry of Agriculture, Forestry, and Fisheries of Japan for “Genomics-based Technology for Agricultural Improvement, NGB-2007”.
Literature Cited
- Bai, S.L., A.D. Wang, M. Igarashi, T. Kon, T. Fukasawa-Akada, T.Z. Li, T. Harada and Y. Hatsuyama (2012) Distribution of MdACS3 null alleles in apple (Malus × domestica Borkh.) and its relevance to the fruit ripening characters. Breed. Sci. 62: 46–52.
- Ban, Y., C. Honda, Y. Hatsuyama, M. Igarashi, H. Bessho and T. Moriguchi (2007) Isolation and functional analysis of a MYB transcription factor gene that is a key regulator for the development of red coloration in apple skin. Plant Cell Physiol. 48: 958–970.
- Brown, A.G. (1960) The inheritance of shape, size, and season of ripening in progenies of the cultivated apple. Euphytica 9: 327–337.
- Brown, A.G. and D.M. Harvey (1971) The nature and inheritance of sweetness and acidity in the cultivated apple. Euphytica 20: 68–80.
- Celton, J.M., D.S. Tustin, D. Chagné and S.E. Gardiner (2009) Construction of a dense genetic linkage map for apple rootstocks using SSRs developed from Malus ESTs and Pyrus genomic sequences. Tree Genet. Genomes 5: 93–107.
- Chagné, D., C. Krieger, M. Rassam, M. Sullivan, J. Fraser, C. André, M. Pindo, M. Troggio, S.E. Gardiner, R.A. Henry et al. (2012) QTL and candidate gene mapping for polyphenolic composition in apple fruit. BMC Plant Biol. 12: 12.
- Costa, F., S. Stella, W.E. Van de Weg, W. Guerra, M. Cecchinel, V.J. Dalla, B. Koller and S. Sansavini (2005) Role of the genes Md-ACO1 and Md-ACS1 in ethylene production and shelf life of apple (Malus domestica Borkh). Euphytica 141: 181–190.
- Costa, F., W.E. Van de Weg, S. Stella, L. Dondini, D. Pratesi, S. Musacchi and S. Sansavini (2008) Map position and functional allelic diversity of Md-Exp7, a new putative expansin gene associated with fruit softening in apple (Malus × domestica Borkh.) and pear (Pyrus communis). Tree Genet. Genomes 4: 575–586.
- Costa, F., C.P. Peace, S. Stella, S. Serra, S. Musacchi, M. Bazzani, S. Sansavini and W.E. Van de Weg (2010) QTL dynamics for fruit firmness and softening around an ethylene-dependent polygalacturonase gene in apple (Malus × domestica Borkh.). J. Exp. Bot. 61: 3029–3039.
- Devoghalaere, F., T. Doucen, B. Guitton, J. Keeling, W. Payne, T. Ling, J.J. Ross, I.C. Hallett, K. Gunaseelan, G.A. Dayatilake et al. (2012) A genomics approach to understanding the role of auxin in apple (Malus × domestica) fruit size control. BMC Plant Biol. 12: 7.
- Dyk, M.M., M.K. Soeker, I.F. Labuschagne and D.J.G. Rees (2010) Identification of a major QTL for time of initial vegetative budbreak in apple (Malus × domestica Borkh.). Tree Genet. Genomes 6: 489–502.
- Etienne, C., C. Rothan, A. Moing, C. Plomion, C. Bodénès, L. Svanella-Dumas, P. Cosson, V. Pronier, R. Monet and E. Dirlewanger (2002) Candidate genes and QTLs for sugar and organic acid content in peach [Prunus persica (L.) Batsch]. Theor. Appl. Genet. 105: 145–159.
- Fernandez-Fernandez, F., N.G. Harvey and C.M. James (2006) Isolation and characterization of polymorphic microsatellite markers from European pear (Pyrus communis L.). Mol. Ecol. Notes 6: 1039–1041.
- Fukuoka, S., N. Saka, H. Koga, K. Ono, T. Shimizu, K. Ebana, N. Hayashi, A. Takahashi, H. Hirochika, K. Okuno et al. (2009) Loss of function of a proline-containing protein confers durable disease resistance in rice. Science 325: 998–1001.
- Grattapaglia, D. and R. Sederoff (1994) Genetic-linkage maps of Eucalyptus grandis and Eucalyptus urophylla using a pseudo-testcross: mapping strategy and RAPD markers. Genetics 137: 1121–1137.
- Harada, T., T. Sunako, Y. Wakasa, J. Soejima, T. Satoh and M. Niizeki (2000) An allele of the 1-aminocyclopropane-1-carboxylate synthase gene (Md-ACS1) accounts for the low level of ethylene production in climacteric fruits of some apple cultivars. Theor. Appl. Genet. 101: 742–746.
- Inoue, E., M. Kasumi, F. Sakura, H. Anzai, K. Amano and H. Hara (2006) Identification of RAPD marker linked to fruit skin color in Japanese pear (Pyrus pyrifolia Nakai). Sci. Hort. 107: 254–258.
- Inoue, E., Y. Matsuki, H. Anzai and K. Evans (2007) Isolation and characterization of microsatellite markers in Japanese pear (Pyrus pyrifolia Nakai). Mol. Ecol. Notes 7: 445–447.
- Kenis, K., J. Keulemans and M.W. Davey (2008) Identification and stability of QTLs for fruit quality traits in apple. Tree Genet. Genomes 4: 647–661.
- Kim, H., H. Kakui, N. Kotoda, Y. Hirata, T. Koba and H. Sassa (2009) Determination of partial genomic sequences and development of a CAPS system of the S-RNase gene for the identification of 22 S haplotypes of apple (Malus × domestica Borkh.). Mol. Breed. 23: 463–472.
- King, G.J., C. Maliepaard, J.R. Lynn, F.H. Alston, C.E. Durel, K.M. Evans, B. Griffon, F. Laurens, A.G. Manganaris, E. Schrevens et al. (2000) Quantitative genetic analysis and comparison of physical and sensory descriptors relating to fruit flesh firmness in apple (Malus pumila Mill.). Theor. Appl. Genet. 100: 1074–1084.
- King, G.J., J.R. Lynn, C.J. Dover, K.M. Evans and G.B. Seymour (2001) Resolution of quantitative trait loci for mechanical measures accounting for genetic variation in fruit texture of apple (Malus pumila Mill.). Theor. Appl. Genet. 102: 1227–1235.
- Koller, B., L. Gianfranceschi, N. Seglias, J. McDermott and C. Gessler (1994) DNA markers linked to Malus floribunda 821 scab resistance. Plant Mol. Biol. 26: 597–602.
- Kumar, S., D.J. Garrick, M.C. Bink, C. Whitworth, D. Chagné and R.K. Volz (2013) Novel genomic approaches unravel genetic architecture of complex traits in apple. BMC Genomics 14: 393.
- Liebhard, R., L. Gianfranceschi, B. Koller, C.D. Ryder, R. Tarchini, E. Van de Weg and C. Gessler (2002) Development and characterisation of 140 new microsatellites in apple (Malus × domestica Borkh.). Mol. Breed. 10: 217–241.
- Liebhard, R., B. Koller, L. Gianfranceschi and C. Gessler (2003a) Creating a saturated reference map for the apple (Malus × domestica Borkh.) genome. Theor. Appl. Genet. 106: 1497–1508.
- Liebhard, R., M. Kellerhals, W. Pfammatter, M. Jertmini and C. Gessler (2003b) Mapping quantitative physiological traits in apple (Malus × domestica Borkh.). Plant Mol. Biol. 52: 511–526.
- Manganaris, A.G., F.A. Alston, N.F. Weeden, H.S. Aldwinkle, H.L. Gustafson and S.K. Brown (1994) Isozyme locus PGM-1 is tightly linked to a gene (VJ) for scab resistance in apple. J. Am. Soc. Hortic. Sci. 119: 1286–1288.
- Mellidou, I., D. Chagné, W.A. Laing, J. Keulemans and M.W. Davey (2012) Allelic variation in paralogs of GDP-L-galactose phosphorylase is a major determinant of vitamin C concentrations in apple fruit. Plant Physiol. 160: 1613–1629.
- Moriya, S., H. Iwanami, N. Kotoda, T. Haji, K. Okada, S. Terakami, N. Mimida, T. Yamamoto and K. Abe (2012) Aligned genetic linkage maps of apple rootstock cultivar ‘JM7’ and Malus sieboldii ‘Sanashi 63’ constructed with novel EST-SSRs. Tree Genet. Genomes 8: 709–723.
- Nishitani, C., S. Terakami, Y. Sawamura, N. Takada and T. Yamamoto (2009) Development of novel EST-SSR markers derived from Japanese pear (Pyrus pyrifolia). Breed. Sci. 59: 391–400.
- Sadamori, S., Y. Yoshida, S. Tsuchiya, T. Haniuda, H. Murakami, H. Suzuki and S. Ishizuka (1973) New apple variety ‘Akane’ (in Japanese). Bull. Hort. Res. Stat. C8: 1–11.
- Sato, T., T. Kudo, T. Akada, Y. Wakasa, M. Niizeki and T. Harada (2004) Allelotype of a ripening-specific 1-aminocyclopropane-1-carboxylate synthase gene defines the rate of fruit drop in apple. J. Am. Soc. Hort. Sci. 129: 32–36.
- Sawamura, Y., T. Saito, N. Takada, T. Yamamoto and T. Kimura (2004) Identification of parentage of Japanese pear ‘Housui’. J. Jpn. Soc. Hort. Sci. 73: 511–518.
- Segura, V., C. Denancé, C.E. Durel and E. Costes (2007) Wide range QTL analysis for complex architectural traits in a 1-year-old apple progeny. Genome 50: 159–171.
- Silfverberg-Dilworth, E., C.L. Matasci, W.E. Van de Weg, M.P.W. Van Kaauwen, M. Walser, L.P. Kodde, V. Soglio, L. Gianfranceschi, C.E. Durel, F. Costa et al. (2006) Microsatellite markers spanning the apple (Malus × domestica Borkh.) genome. Tree Genet. Genomes 2: 202–224.
- Takos, A.M., F.W. Jaffe, S.R. Jacob, J. Bogs, S.P. Robinson and A.R. Walker (2006) Light induced expression of a MYB gene regulates anthocyanin biosynthesis in red apples. Plant Physiol. 142: 1216– 1232.
- van Ooijen, J.W. (2006) JoinMap 4 Software for the calculation of genetic linkage maps in experimental populations. Kyazma, B.V., Wageningen, the Netherlands.
- van Ooijen, J.W. (2009) MapQTL 6 Software for the mapping of quantitative trait loci in experimental populations of diploid species. Kyazma, B.V., Wageningen, the Netherlands.
- Velasco, R., A. Zharkikh, J. Affourtit, A. Dhingra, A. Cestaro, A. Kalyanaraman, P. Fontana, S.K. Bhatnagar, M. Troggio, D. Pruss et al. (2010) The genome of the domesticated apple (Malus × domestica Borkh.). Nat. Genet. 42: 833–839.
- Xu, K., A. Wang and S. Brown (2011) Genetic characterization of the Ma locus with pH and titratable acidity in apple. Mol. Breed. 30: 899–912.
- Xu, S. (2003) Theoretical basis of the Beavis effect. Genetics 165: 2259–2268.
- Yamamoto, T., T. Kimura, M. Shoda, T. Imai, T. Saito, Y. Sawamura, K. Kotobuki, T. Hayashi and N. Matsuta (2002a) Genetic linkage maps constructed by using an interspecific cross between Japanese and European pears. Theor. Appl. Genet. 106: 9–18.
- Yamamoto, T., T. Kimura, M. Shoda, Y. Ban, T. Hayashi and N. Matsuta (2002b) Development of microsatellite markers in the Japanese pear (Pyrus pyrifolia Nakai). Mol. Ecol. Notes 2: 14–16.
- Yamamoto, T., T. Kimura, Y. Sawamura, T. Manabe, K. Kotobuki, T. Hayashi, Y. Ban and N. Matsuta (2002c) Simple sequence repeats for genetic analysis in pear. Euphytica 124: 129–137.
- Yamamoto, T., S. Terakami, S. Moriya, F. Hosaka, K. Kurita, H. Kanamori, Y. Katayose, T. Saito and C. Nishitani (2013) DNA markers developed from genome sequencing analysis in Japanese pear (Pyrus pyrifolia). Acta Hort. 976: 477–483.
- Yang, H.Y. and J. Krüger (1994) Identification of a RAPD marker linked to the Vf gene for scab resistance in apples. Plant Breed. 112: 323–329.