Abstract
Plant breeding programs aim to develop cultivars with high adaptability to the specific conditions in a local region. As a result, unique genes and gene combinations have been accumulated in local elite breeding populations during the long history of plant breeding. Genetic analyses on such genes and combinations may be useful for developing new cultivars with more-desirable agronomic traits. Here, we attempted to detect quantitative trait loci (QTL) for rice blast resistance (BR) using a local breeding rice population from Hokkaido, Japan. Using genotyping data on single nucleotide polymorphisms and simple sequence repeat markers distributed throughout the whole genomic region, we detected genetic regions associated with phenotypic variation in BR by a genome-wide association mapping study (GWAS). An additional association analysis using other breeding cultivars verified the effect and inheritance of the associated region. Furthermore, the existence of a gene for BR in the associated region was confirmed by QTL mapping. The results from these studies enabled us to estimate potential of the Hokkaido rice population as a gene pool for improving BR. The results of this study could be useful for developing novel cultivars with vigorous BR in rice breeding programs.
Introduction
Plant breeding programs aim to develop cultivars with high adaptability to specific conditions, such as climatic conditions, cultivation systems and to meet market demands in each local region. Intensive selection pressures focusing on adaptability to these specific environmental conditions during rice breeding programs using local genetic resources could generate unique genetic structures in each local breeding population (Kaga et al. 2012, Yamasaki et al. 2013, Yonemaru et al. 2012). It has been suggested that unique genes and gene combinations have also accumulated in each local elite breeding population (Fujino et al. 2011, Nagasaki et al. 2010). Genetic analyses of such genes may be useful for developing new cultivars with novel combinations of genes and more-desirable agronomic traits. However, few studies have examined the potential of local breeding populations as genetic resources for the improvement of agronomic traits.
Rice, Oryza sativa L., is one of the most important staple crops in the world. Quantitative trait loci (QTL) mapping has revealed the genetic architecture of complex agronomic traits in rice (Yamamoto et al. 2009). However, genetic diversity among rice breeding materials in each local region is very small. On account of the limited genomic resolution, the detection of QTLs for phenotypic variations in such populations has been difficult. Recent advances in molecular genetics technology, such as genome-wide single nucleotide polymorphism (SNP) typing, has allowed the elucidation of detailed information on genetic polymorphisms even in genetically close rice populations (Nagasaki et al. 2010). The advent of high-density SNP typing has allowed the successful identification of a number of QTLs in such populations by bi-parental QTL mapping (Shinada et al. 2015, Shirasawa et al. 2012). Furthermore, these advances have enabled the detection of QTLs in rice populations with genetic variations in a genome-wide association mapping study (GWAS) (Brachi et al. 2011).
Rice blast, caused by the filamentous ascomycete Magnaporthe oryzae (Herbert Barr), is one of the most severe rice diseases. Development of resistant cultivars has been the most effective and economical method for controlling this disease. To date, more than 80 genes for blast resistance (BR) have been recorded, of which 60 have been mapped genetically (Gramene database: http://www.gramene.org/). Most of these BR genes relate to race-specific resistance. Although race-specific resistance induces strong resistance (hypersensitive reaction), this can be overcome by pathogens (Bonman et al. 1992). On the other hand, several QTLs for BR were also detected (Fukuoka et al. 2009, 2014, Hayashi et al. 2010, Sato et al. 2006, Zenbayashi-Sawata et al. 2007). In general, although their individual phenotypic effect is small, cultivars carrying QTLs for BR maintain their resistance for a long time. Three QTLs, Pb1, pi21, and Pi35, were cloned as genes for BR (Fukuoka et al. 2009, 2014, Hayashi et al. 2010), and QTL pyramiding enhances durable BR in rice (Fukuoka et al. 2015). However, their phenotypic effects are limited and sometimes vary with the blast race (Yasuda et al. 2008). The identifications of various QTLs for BR will be important for the development the rice cultivars with vigorous and durable BR in rice breeding programs.
Hokkaido (41–45°N) is the northern-most region of Japan, and it is one of the northern limits of rice cultivation in the world. Phylogenetic analysis revealed that the Hokkaido rice population had differentiated clearly into six genetic sub-groups (groups I, II, IIIa, IIIb, IV, and V) during the long history of Hokkaido rice breeding programs (Shinada et al. 2014). Significant phenotypic differences were detected in important agronomic traits for rice cultivation between sub-groups in Hokkaido. A number of QTLs for heading date, cold tolerance, and eating quality have been detected using a mapping population derived from a cross between Hokkaido rice cultivars (Ando et al. 2010, Kuroki et al. 2007, Nonoue et al. 2008, Saito et al. 1995, Shinada et al. 2013). However, despite phenotypic variations in some important agronomic traits, such as BR and yield components, QTLs for these traits in Hokkaido rice cultivars have yet to be identified.
Here, we report the detection of regions associated with BR in elite rice population from Hokkaido (the Hokkaido Rice Core Panel [HRCP]). Using genotyping data of 545 SNPs and 89 simple sequence repeat (SSR) markers distributed throughout the whole genome, we detected a genetic region associated with phenotypic variation in BR by GWAS. An additional analysis verified the effect and the inheritance of the most-strongly associated region on chromosome 11 for BR. The existence of a gene for BR in this region was subsequently validated by QTL mapping. A prominent QTL for BR, Pi-cd, was detected. The results from GWAS enabled us not only to detect a probable QTL for BR in the HRCP but also to estimate the number of QTLs and which cultivars have which QTL(s) for BR among the Hokkaido rice population. The results in this study could be useful for developing novel cultivars with vigorous BR in rice breeding programs.
Material and Methods
Plant materials for association mapping of blast resistance
We previously characterized the population structure of 63 rice cultivars evenly covering the full diversity of the Hokkaido rice population. They had a close genetic relationship and were divided into six genetic sub-groups (Shinada et al. 2014). In this study, we used 60 of these rice cultivars as our HRCP for association mapping of BR (Supplemental Table 1). In addition, 13 rice cultivars were used as an additional panel (AP) for examination of the effect and the inheritance of the most-strongly associated region for BR (Supplemental Table 2). They were all breeding lines and related to rice cultivar ‘Kitaake’ from Hokkaido (Supplemental Fig. 1).
Two populations were used for QTL mapping of BR. The first consisted of 88 doubled haploid lines (DHLs), A3, derived from a cross between ‘Joiku No. 462’ (blast resistant) and ‘Jokei06214’ (blast susceptible) developed by Shinada et al. 2015. The second was 120 recombinant inbred lines (RILs), F4, derived from a cross between ‘Kuiku No. 172’ (blast resistant) and ‘Hoshinoyume’ (blast susceptible) and developed by the single-seed descent method. ‘Joiku No. 462’ and ‘Kuiku No. 172’ are in the pedigree of Kitaake with BR included in the AP and have identical haplotype blocks with ‘Kitaake’ in the region associated with BR on chromosome 11.
DNA analysis
Total DNA was isolated from young leaves using the CTAB method (Murray and Thompson 1980). Previously, we obtained an informative set of 768 SNPs evenly distributed across the rice genome to identify the genetic diversity of Japanese rice cultivars (Nagasaki et al. 2010, Yonemaru et al. 2012). This SNP set was used to detect polymorphisms in the HRCP. In total, 223 SNPs that showed high missing data or were detected as heterozygous or with no polymorphism were excluded. This left 545 selected SNPs. All experimental procedures for SNP typing were performed as described by Shinada et al. (2015).
A total of 320 SSR markers over the whole genome from the list of McCouch et al. (2002) and the IRGSP (2005) were used for the prescreening of polymorphisms among six cultivars, Akage, Eiko, Yukara, Ishikari, Kitaibuki, and Hoshinoyume. Among of these, 96 SSR markers showed clear polymorphisms, and they were used for genotyping of the HRCP. Excluding markers exhibiting hyper multiple variation, the genotypes of 89 SSR markers were used for further analysis. In addition, seven SSR markers within the region of Pi-cd were used. Genotyping with these SSR markers was performed as described by Fujino et al. (2004).
The positions of SNPs or SSR markers used for association mapping across 12 rice chromosomes is shown in Supplemental Table 3. The polymorphic information content (PIC) value of each marker was calculated as described by Shinada et al. (2014).
Estimation of linkage disequilibrium in HRCP
Linkage disequilibrium (LD) in HRCP was quantified using two locus method (Gupta et al. 2005). r2 values were calculated using 288 SNPs pairs with similar PIC values for all 12 chromosomes. r2 summarizes recombination and mutation history and is indicative of how markers might be correlated with QTL of interest. To visualize the extent of LD, the pattern of measured r2 decay was plotted.
Evaluation of blast resistance
BR was evaluated using the upland field test at the Kamikawa Experiment Agricultural Station (Hokkaido, Japan) in 2012. Seeds (5 g) of each cultivar were sown 20 cm apart in 30-cm rows at the beginning of July, with two replicates. After seed establishment, fungal race 037, which produced susceptible lesions in the HRCP, was sprayed over the field. After natural infection, disease severity on each cultivar was evaluated when the plants were 40–50 days old. Disease severity was classified into 11 classes, with 0 indicating no susceptible lesions and 10 indicating death, in accordance with the criteria of Asaga (1981). To rectify the effect of a lack of uniformity in the outbreak of blast disease, Nourin No. 20 seeds were sown in every tenth plot as a control. Then, the severity score of each cultivar was normalized to the nearest Nourin No. 20, which was set to 100.
Severity score = (disease severity score of the tested cultivar/disease severity score of nearest Nourin No. 20) × 100
Association mapping for blast resistance
To associate phenotypic data with chromosomal regions, the mean value of BR was annotated by the General Linear Model (GLM) using the percentages of admixture from Structure analysis (Q matrix) and a Mixed Linear Model (MLM) using Q matrix and a kinship matrix implemented in the program TASSEL v. 3.0 (Bradbury et al. 2007). Structural analyses were conducted using Structure software v. 2.3.4 (Pritchard et al. 2000) with the following parameters: K = 6; 10 times run; 10,000 burn-ins and 100,000 iterations. The −log10 (P-value) of each genome position was charted. We used the q value as a measure of statistical significance for GWAS (Storey and Tibshirani 2003). The q value of each SNP or SSR marker was calculated using statistical software R v. 3.1.2 (Package ‘qvalue’) using the BH method and the following parameters: specify lambda range from 0.0 to 0.90 by 0.05; pi_0 method = smoother. In this study, SNP or SSR markers with a q value <0.05 were defined as significantly associated markers. The q value is an extension of a quantity called the false discovery rate. The threshold for significance in linkage analysis is usually chosen so that the probability of any single false positive among all loci tested is <0.05. This strict criterion is used mainly when one or very few loci are expected to show linkage. In this study, it was expected that many more regions for BR were statistically significant. Thus, we validated the q value of each SNP or SSR markers for screening candidate associating regions.
Quantitative trait loci analysis for blast resistance using doubled haploid lines
A linkage map of DHLs constructed in Shinada et al. (2015) was used for QTL analysis. The detection of QTLs was conducted by composite interval mapping with QTL Cartographer 2.5 (http://statgen.nesu.edu/qtlcart/WQTLcart.htem). The threshold to detect QTLs was determined by the 1000 permutation test at a probability level of 0.05: LOD 6.24.
Results
Phenotypic variation in blast resistance in the Hokkaido Rice Core Panel
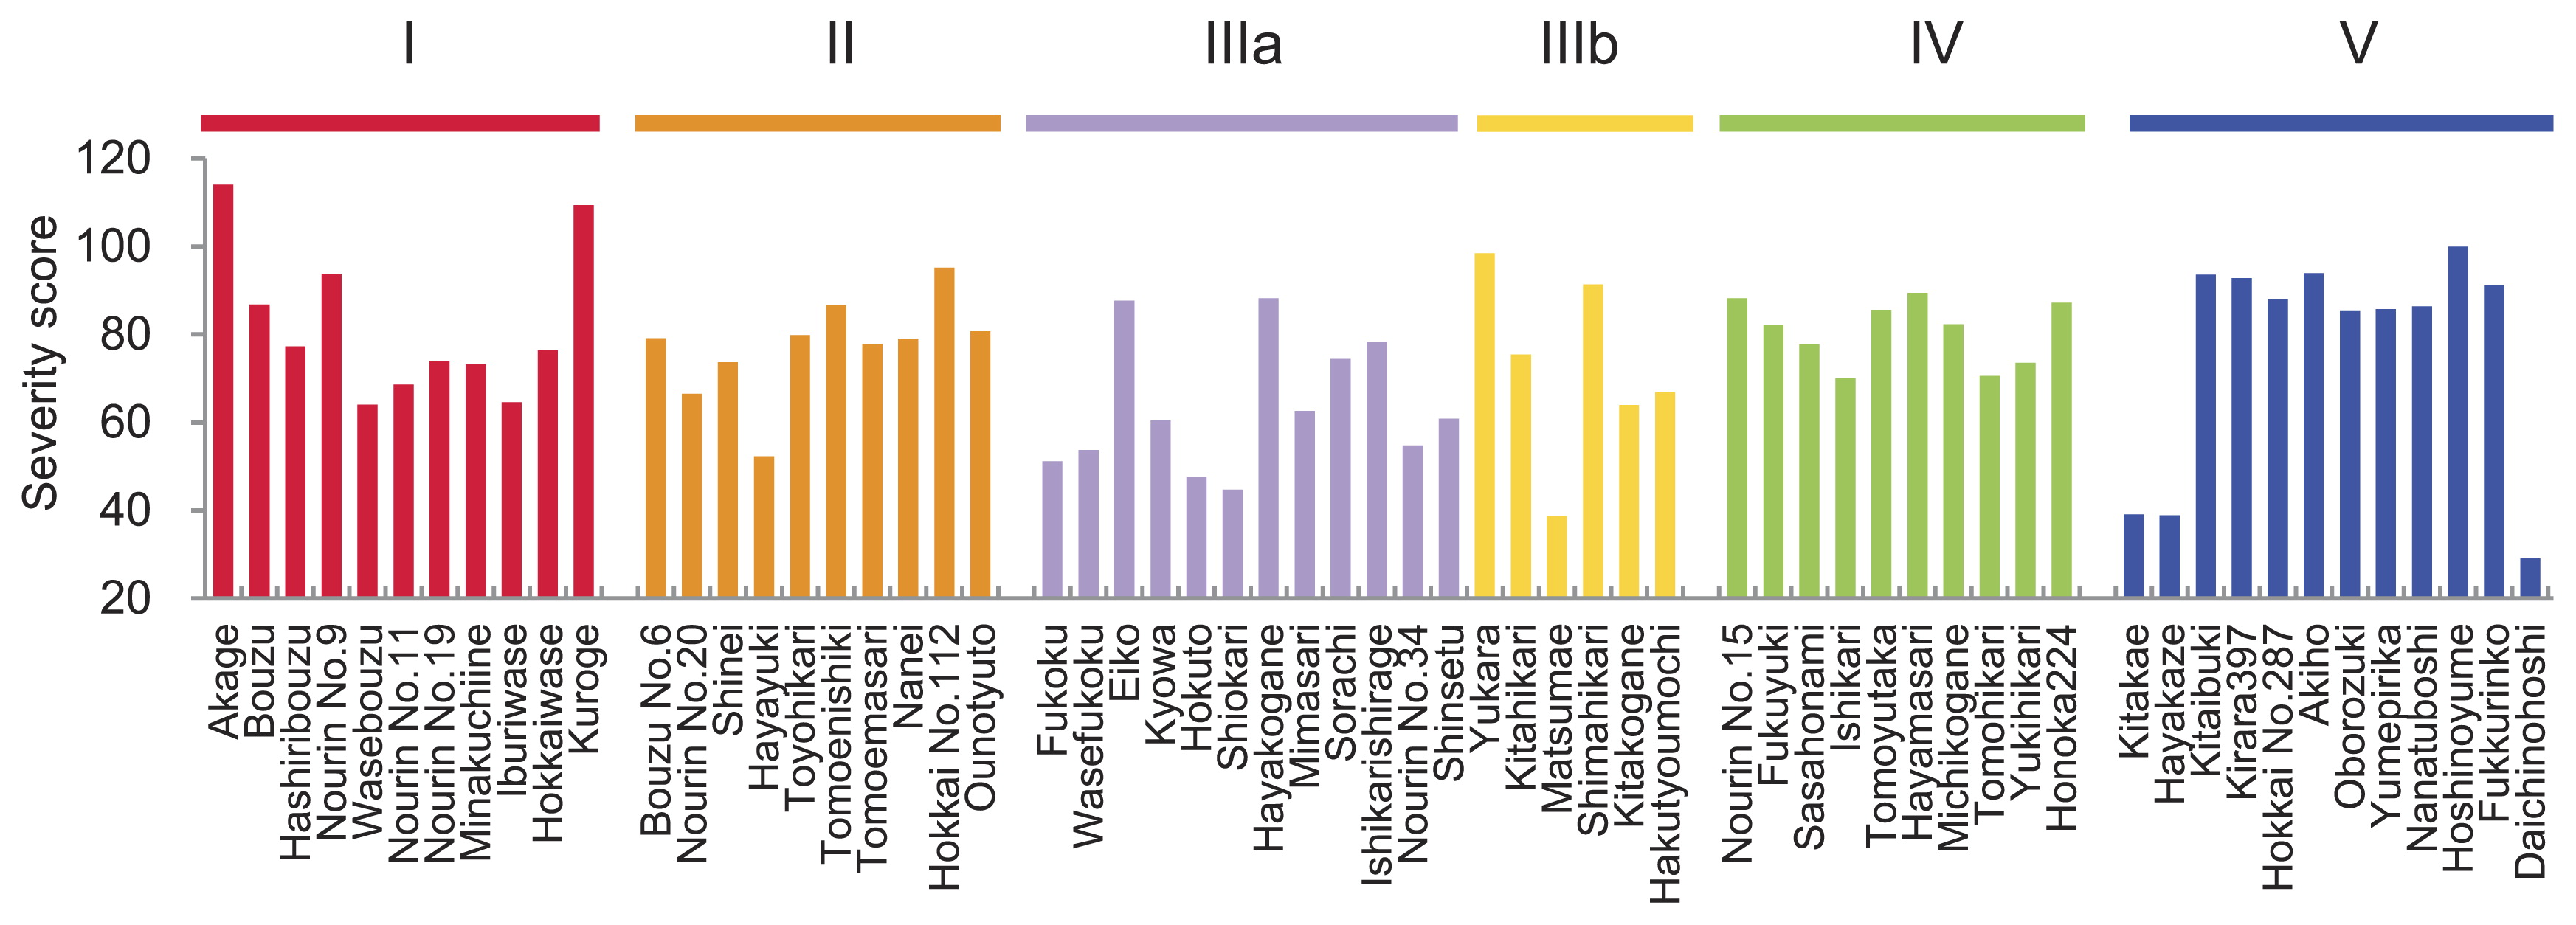
A wide variation in BR was observed in the HRCP, with a severity score of 75.7 on average, ranging from 29.2 to 114.1 (Fig. 1). A different tendency for BR was observed by genetic sub-group, which was defined in Shinada et al. (2014). The cultivars in groups I, II, IIIa, and IIIb showed continuous variation in severity score from 38.7 to 114.1. All cultivars in group IV showed low resistance levels, with a severity score of 82.0 on average, ranging from 70.1 to 95.2. The blast resistance of group V was clearly divided into resistant and sensitive cultivars. Ten cultivars in group V showed high severity scores, ranging from 85.4 to 100.0 indicating sensitivity. On the other hand, three cultivars, ‘Kitaake’, ‘Hayakaze’, and ‘Daichinohosi’, showed low severity scores of 29.2, 38.5 and 39.1, respectively, indicating resistance.
Association mapping of blast resistance
There was a wide variation in BR in the HRCP. However, it was impossible to estimate how many QTLs were included in the HRCP and which cultivars have which QTLs from only pedigree information. To make these questions clear, we conducted GWAS for rough screening of QTL for BR.
A total of 545 SNPs and 89 SSR markers were used for the detection of genetic polymorphisms in the HRCP. The marker intervals between each marker were from 0.05 Mb to 4.48 Mb, with a mean of 0.58 Mb. The PIC value of each marker was from 0.03 to 0.79, with a total mean of 0.36 (Supplemental Table 4). Although there were nine regions with no polymorphic markers for more than 2 Mb, polymorphisms were detected in all other genomic regions (Supplemental Fig. 2).
LD decay plot measured by r2 values is showed in Supplemental Fig. 3. In general, inbreeding and small population size lead to an increase in LD. However rapid decay of LD was observed within 0.4–0.8 Mb. LD of HRCP observed in this study was much shorter than that of Japanese cultivars including Hokkaido rice cultivars reported in Yamamoto et al. 2010. HRCP is the structured population divided into six genetic subgroup. Almost all cultivars included in group IIIa, IIIb, IV or V were pedigrees of the specific cultivars (Shinada et al. 2014). Frequency and pattern of polymorphism in each marker were often different between subgroup (e.g. aa01000201, aa02000854, aa11004494 etc. in Supplemental Table 3). This unique population structure in HRCP might prevent determining the precise extent of LD in HRCP by the two locus methods.
Five SNPs or SSR markers with q values <0.05 were detected by GWAS using the GLM (Fig. 2, Table 1). The most highly associated mapping −log10 (P) values were obtained for SSR marker locus RM5349 on chromosome 11. Two genotypes of RM5349 were identified in the HRCP. One was present in three cultivars, ‘Kitaake’, ‘Hayakaze’, and ‘Daichinohoshi’ in Group V (Supplemental Table 5). These three cultivars showed low severity scores averaging 35.6 and ranging from 29.2 to 39.1. The other genotype was distributed in the remaining 57 cultivars with wide phenotypic variation in severity score, with an average of 77.7 and ranging from 38.7 to 114.1 (Table 1, Supplemental Table 5). Although no markers with q values <0.05 were detected, the highest association mapping −log10 (P) values were also obtained for this RM5349 locus, with a q value = 0.099 in the MLM (Table 1, Fig. 2).
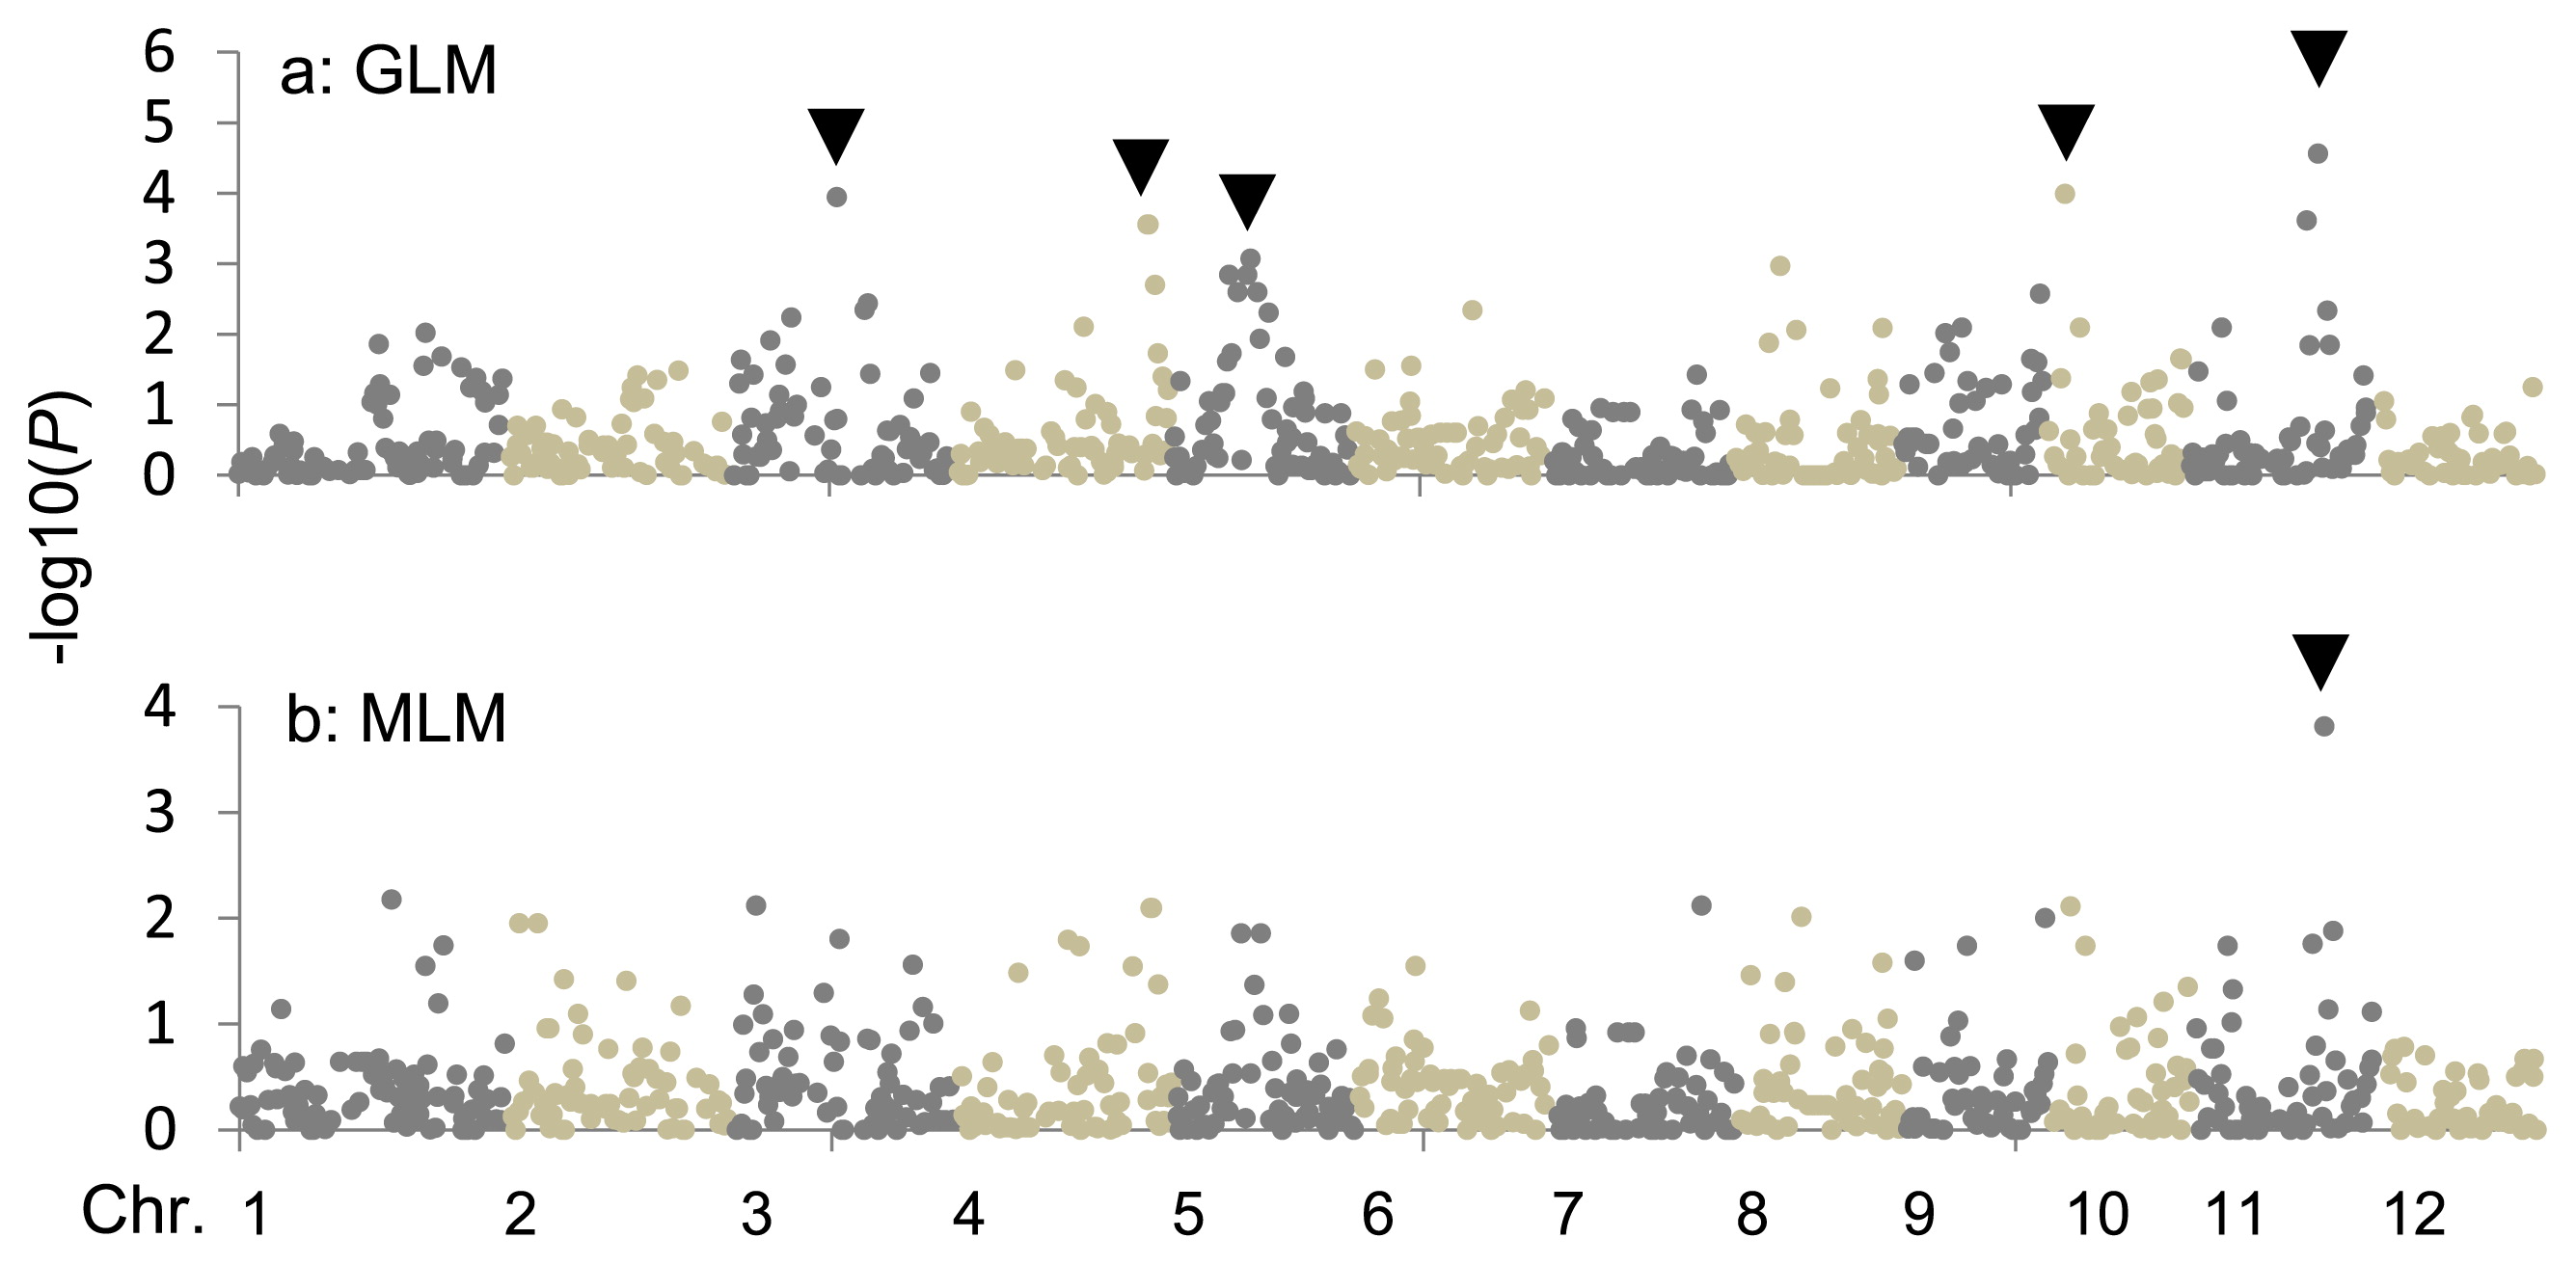
Table 1
Ranked single nucleotide polymorphisms (SNPs) and simple sequence repeat (SSR) markers with
q values <0.05 (General Linear Model [GLM]) and <0.10 (Mixed Linear Model [MLM]) from the genome-wide association mapping strategy (GWAS)
| Model |
Marker |
Chr. |
Position (Mb) |
−log10P |
Permutation P |
q-valuea |
rankb |
Allele No. |
Mean of severity score* |
| Allele A |
Allele B |
| GLM |
ac03000493 |
3 |
17.3 |
3.94 |
0.00011 |
0.022 |
3 |
2 |
71.2 (48) |
92.4 (12) |
| aa04009401 |
4 |
32.1 |
3.55 |
0.00027 |
0.026 |
4 |
2 |
60.1 (13) |
79.7 (47) |
| ab05000132 |
5 |
13.0 |
3.07 |
0.00083 |
0.026 |
5 |
2 |
71.7 (48) |
90.4 (12) |
| aa10000871 |
10 |
2.8 |
3.99 |
0.00010 |
0.022 |
2 |
2 |
69.2 (39) |
87.1 (21) |
| RM5349 |
11 |
19.6 |
4.56 |
0.00002 |
0.015 |
1 |
2 |
35.6 (3) |
77.7 (57) |
| MLM |
RM5349 |
11 |
19.6 |
3.81 |
0.00015 |
0.099 |
1 |
2 |
35.6 (3) |
77.7 (57) |
* The number in parentheses shows the number of cultivars.
a The
q value is a genome-wide adjusted
p value that controls the false discovery rate.
b The rank indicates the genome-wide ordering of the SNP or SSR based on the GWAS.
To verify the effect of the most strongly associated region for BR, we compared the haplotype pattern of 13 markers around the RM5349 locus with the severity score among ‘Kitaake’-related cultivars. A clear correlation between haplotype pattern from RM5349 to aa11004155 and severity score were detected in the AP (Table 2). The haplotype patterns in this region were conserved in ‘Kitaake’ and nine other cultivars with BR in the AP. Among four ancestral cultivars of ‘Kitaake’, ‘Cody’ (derived from USA), ‘Sorachi’, ‘Yukara’, and ‘Fukuyuki’, only ‘Cody’ had vigorous BR. The genomic structure from RM5349 to aa11004155 in ‘Kitaake’ was chimeric with that of ‘Sorachi’ and ‘Cody’. It was suggested that the gene(s) for BR in this region was introgressed in ‘Kitaake’ from ‘Cody’ and distributed to the progeny ‘Kitaake’. In total, 12 progenitors of Kitaake were included in the HRCP. The haplotype pattern of two cultivars, ‘Hayakaze’ and ‘Daichinohoshi’, in this region was coincident with that of ‘Kitaake’ (Supplemental Table 5).
Table 2
Haplotype diversity in associated region for blast resistance (BR) on chromosome 11 in the advanced panel (AP) and ancestors of Kitaake
| Group |
Cultivar* |
Severity score |
Markera |
| aa11003281 |
aa11003294 |
aa11003517 |
aa11004053 |
ac11000499 |
RM5349 |
ac11000537 |
aa11004155 |
aa11004494 |
aa11004500 |
aa11004506 |
aa11005083 |
aa11005455 |
| 11 |
11 |
11 |
11 |
11 |
11 |
11 |
11 |
11 |
11 |
11 |
11 |
11 |
| 14.9 |
15.3 |
17.5 |
18.0 |
18.5 |
19.6 |
19.6 |
20.3 |
21.0 |
21.6 |
21.8 |
23.6 |
23.9 |
| IIIb |
Yukara |
98.5 |
C |
G |
T |
C |
A |
A |
A |
T |
G |
G |
A |
C |
G |
| IV |
Fukuyuki |
82.2 |
C |
A |
C |
T |
G |
A |
G |
T |
G |
G |
A |
C |
A |
| IIIa |
Sorachi |
74.4 |
C |
G |
C |
C |
G |
A |
A |
T |
G |
G |
A |
A |
A |
| AP |
Cody |
0.0 |
T |
A |
T |
C |
A |
B |
G |
T |
A |
A |
G |
C |
A |
| V |
Kitaake |
39.1 |
C |
G |
C |
C |
G |
B |
G |
T |
A |
G |
A |
A |
A |
| AP |
Kuiku No. 162 |
36.8 |
C |
G |
C |
C |
G |
B |
G |
T |
A |
G |
A |
C |
A |
| AP |
Joiku No. 452 |
55.8 |
C |
G |
C |
T |
G |
B |
G |
T |
A |
G |
A |
A |
A |
| AP |
Ginpu |
31.6 |
C |
G |
C |
T |
G |
B |
G |
T |
A |
G |
A |
C |
A |
| AP |
Suisei |
34.0 |
C |
A |
C |
T |
G |
B |
G |
T |
A |
G |
A |
C |
A |
| AP |
Joiku No. 462 |
38.0 |
C |
G |
C |
T |
G |
B |
G |
T |
A |
G |
A |
C |
A |
| AP |
Joiku No. 462 |
38.0 |
C |
G |
C |
T |
G |
B |
G |
T |
A |
G |
A |
C |
A |
| AP |
Joiku No. 463 |
35.2 |
C |
G |
T |
C |
G |
B |
G |
T |
G |
G |
A |
A |
A |
| AP |
Kuiku No. 179 |
49.6 |
C |
G |
T |
C |
G |
B |
G |
T |
G |
G |
A |
A |
A |
| AP |
Kuiku No. 180 |
43.8 |
C |
G |
T |
C |
G |
B |
G |
T |
G |
G |
A |
A |
A |
| AP |
Joiku No. 455 |
86.4 |
C |
G |
C |
T |
A |
A |
G |
T |
A |
A |
G |
A |
A |
| AP |
Kuiku No. 171 |
90.0 |
C |
G |
C |
T |
A |
A |
G |
T |
A |
A |
G |
A |
A |
| AP |
Jokei06214 |
100.1 |
C |
G |
C |
T |
A |
A |
G |
T |
A |
A |
G |
A |
A |
* Red text indicates a ancestor of Kitaake. Blue text indicates cultivars in the pedigree of Kitaake.
a The location of each marker was based on the genomic sequence of the cultivar Nipponbare in IRGSP build 1.0.
Green cells indicate an identical haplotype block derived from Cody. Blue cells indicate an identical haplotype block from Sorachi.
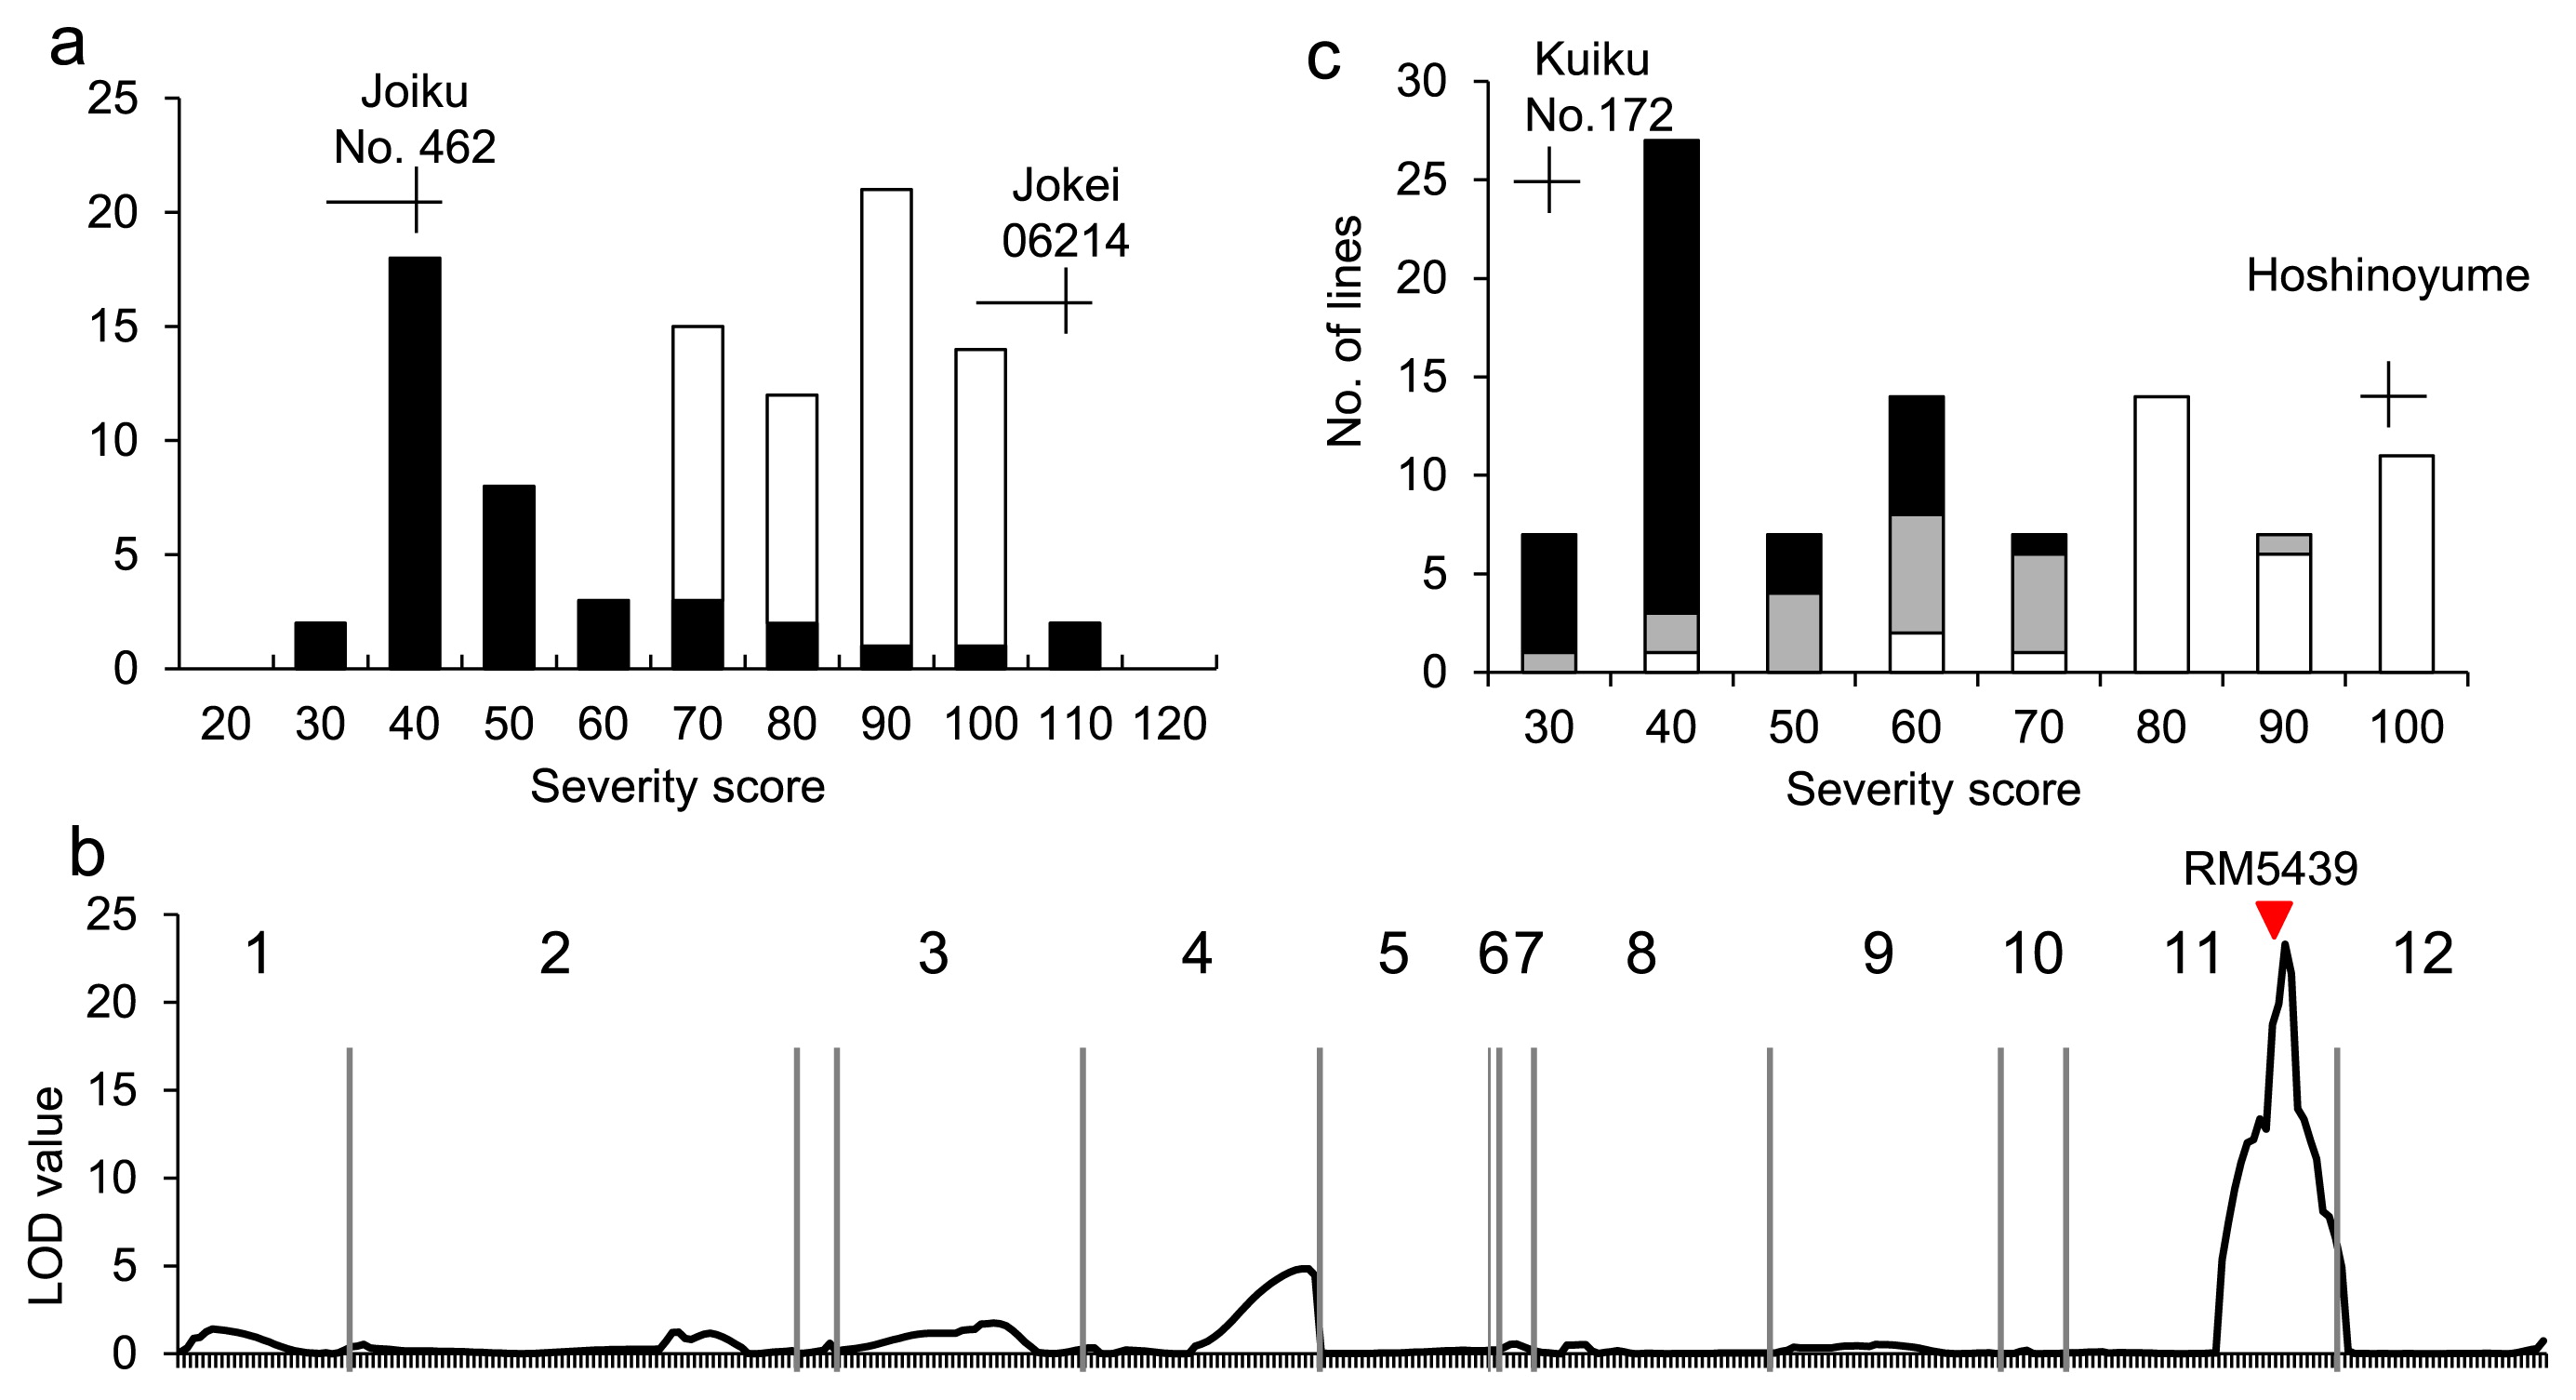
To validate the existence of a gene for BR in the most-highly associated region, QTL analysis was carried out using DHLs derived from the cross between ‘Joiku No. 462’ and ‘Jokei06214’. ‘Joiku No. 462’ has an identical haplotype block to ‘Kitaake’ in the most-highly associated region (Table 2). Clear differences in severity score between parental cultivars were observed; ‘Joiku No. 462’ (38.0) and ‘Jokei06214’ (105.6). The frequency distribution of severity score of DHLs showed continuous variations from 31.0 to 106.0 (Fig. 3a). Only a single QTL for severity score was detected near RM5349 (Fig. 3b, Supplemental Table 6) and accounted for 64.7% of the total phenotypic variation. The ‘Joiku No. 462’ alleles decreased the severity score, as anticipated based on the ‘Joiku No. 462’ phenotype. In addition, a clear correlation between genotype and severity score was detected at RM5349 in RILs derived from the cross between ‘Kuiku No. 172’, cultivars with an identical haplotype block to ‘Kitaake’ in the most-highly associated region, and ‘Hoshinoyume’ (Fig. 3c). Based on the results of genetic analysis, the QTL was named Pi-cd.
To delimit the Pi-cd region, the genotype of seven SSR markers within the 1.16 Mb region and BR were compared using cultivars with BR in the AP. The genotype of three markers, RM26851, RM5349, and RM26871, within a 714 kb region was completely associated with severity score (Table 3).
Table 3
Haplotype diversity of seven simple sequence repeat markers linked to
Pi-cd in cultivars with blast resistance in the advanced panel and four pedigrees of Kitaake
| Cultivar |
Severity score |
RM6680 |
RM26830 |
RM26851 |
RM5349 |
RM26871 |
RM2596 |
RM26890 |
| 19,082,768 |
19,253,156 |
19,624,756 |
19,650,332 |
19,778,593 |
19,967,155 |
20,262,665 |
| Cody |
0 |
a |
a |
a |
a |
a |
a |
a |
| Kitaake |
39.1 |
a |
a |
a |
a |
a |
a |
a |
| Hayakaze |
38.9 |
a |
a |
a |
a |
a |
a |
a |
| Daichinohoshi |
29.2 |
a |
a |
a |
a |
a |
a |
a |
| Suisei |
31.6 |
a |
a |
a |
a |
a |
a |
a |
| Ginpu |
34.9 |
a |
a |
a |
a |
a |
b |
a |
| Kuiku No. 162 |
36.8 |
a |
a |
a |
a |
a |
b |
a |
| Kuiku No. 172 |
32.4 |
b |
c |
a |
a |
a |
e |
a |
| Kuiku No. 179 |
49.6 |
a |
a |
a |
a |
a |
a |
a |
| Kuiku No. 180 |
43.8 |
a |
a |
a |
a |
a |
a |
a |
| Joiku No. 452 |
55.8 |
a |
b |
a |
a |
a |
d |
a |
| Joiku No. 462 |
38.0 |
a |
b |
a |
a |
a |
d |
a |
| Joiku No. 463 |
35.2 |
a |
b |
a |
a |
a |
c |
b |
| Akiho |
93.9 |
b |
d |
b |
b |
b |
f |
b |
| Fukkurinko |
91.1 |
b |
d |
b |
b |
b |
c |
b |
| Hoshinoyume |
100.0 |
b |
d |
b |
b |
b |
c |
b |
| Kirara397 |
92.8 |
b |
g |
b |
b |
b |
c |
b |
Gray cells indicate an identical haplotype with Kitaake.
The location of each marker was based on the genomic sequence of cultivar Nipponbare in IRGSP build 1.0.
Discussion
Several agronomic traits, such as cold tolerance, eating quality, and yield components, in Hokkaido rice population have been improved during the long history of Hokkaido rice breeding programs (Shinada et al. 2014). On the other hand, BR has not been improved continuously. Thus, development of new cultivars with BR will be an important target in Hokkaido rice breeding programs. Relatively wide phenotypic variation of BR in the HRCP was identified in this study. The cultivars with high BR in the HRCP are important genetic resources for the development of novel cultivars with BR. Understanding of the genomic potential (number of QTLs, magnitude of each QTL, and which cultivars have which QTL[s]) for BR in the HRCP will be useful for improving BR in rice breeding programs.
Traditional QTL mapping using bi-parental populations has revealed the genetic architecture of complex agronomic traits in rice (Yamamoto et al. 2009). However, the QTL approach is not always suitable for the estimation of whole genomic potential in a local population. On the other hand, GWAS is becoming a powerful strategy to dissect the broad genetic variability of complex traits in a population. A number of QTLs have been detected successfully by GWAS in plants (Brachi et al. 2011). In this study, firstly, GWAS using a local breeding population was carried out for rough screening of associated regions for BR. Next, the inheritance of the most-highly associated region for BR among the HRCP and AP was investigated. A set of these analyses enabled us not only to detect a useful QTL for BR, Pi-cd, but also to estimate the genomic potential for BR among the HRCP.
Pi-cd was introgressed in ‘Kitaake’ from exotic germplasm, ‘Cody’, and distributed to the progenies of ‘Kitaake’. On the other hand, no cultivars in Groups I, II, IIIa, or IIIb had an identical haplotype pattern to ‘Kitaake’ in the Pi-cd region. Other genes were related to the variation in BR among these genetic sub-groups. Significant associations were also detected at four SNP marker loci, ac03000493, aa040009401, ab05000132, and aa10000871 on chromosomes 3, 4, 5, and 10, respectively (Table 1) by GWAS using results from the GLM (Table 1). These regions may also contribute to the variation in BR among the HRCP. This information will give us an opportunity to detect other QTLs for BR in the HRCP and be useful for improving BR in Hokkaido rice breeding programs efficiently.
In general, GWAS is conducted using samples from previously well-studied populations with a substantial level of genetic variation. Thus, a genomic map in which the marker density is higher than the extent of LD is required (Brachi et al. 2011). In this study, the extent of LD in HRCP was estimated by two-locus method. However, because of unique population structure of HRCP, it was not clear whether the precise extent of LD was measured. On the other hands, we detected a region associated with BR using only 634 markers in practice. The process of crossing and selection during plant breeding has resulted in the recombination and shuffling of ancestral pedigree haplotype blocks to create new variations (Yamamoto et al. 2010, Yonemaru et al. 2014). It was suggested that a pedigree haplotype block with gene(s) for desirable phenotypes is well conserved in a number of cultivars in this local breeding population because of their narrow genetic relationship. In this study, the Pi-cd region derived from ‘Cody’ was well conserved as a haplotype block among the progenitors of ‘Cody’ with BR. This characteristic in genomic structure of local breeding populations might enable us to identify genes using a population with a genetically close relationship and a limited set of markers. Additional analysis to clarify detail of genomic structure in HRCP would be necessary.
To introduce vigorous BR into a new cultivar, accumulations of multiple QTLs for BR are effective (Fukuoka et al. 2015). Furthermore, enhancing resistance by combining multiple genes may also confer more durable resistance. Identification of various QTLs for BR is important for the development of rice cultivars with vigorous and durable BR. Pi-cd was located in a 714 kb region between RM26830 and RM2596 on chromosome 11. Two QTLs for BR were located in the same region, qBFR11 and Pi34, found in the Japanese breeding lines ‘Norin No. 12’ and ‘Chubu No. 32’ (Sato et al. 2006, Zenbayashi-Sawata et al. 2007). The results of inoculation assays with blast race 003.0 suggested that the function of qBFR 11 was distinct from that of Pi34 (Sato et al. 2006). The pedigree relationship between ‘Cody’ and these two cultivars is not clear. Detailed comparison of the genome sequence in this region among these three cultivars ‘Cody’, ‘Norin No. 12’, and ‘Chubu No. 32’, will be useful for understanding important variations in the genes for rice BR.
Acknowledgement
This work was supported in part by a grant from the Ministry of Agriculture, Forestry and Fisheries of Japan (Science and Technology Research Promotion Program for Agriculture, Forestry, Fisheries and Food Industry 25014A).
References
- Ando, I., H. Sato, N. Aoki, Y. Suzuki, H. Hirabayashi, M. Kuroki, H. Shimizu, T. Ando and Y. Takeuchi (2010) Genetic analysis of the low-amylose characteristics of rice cultivars Oborozuki and Hokkai-PL9. Breed. Sci. 60: 187–194.
- Asaga, K. (1981) A procedure for evaluating field resistance to blast in rice varieties. J. Cent. Agric. Exp. Stn. 35: 51–138.
- Bonman, J.M., G.S. Khush and R.J. Nelson (1992) Breeding rice for resistance to pests. Annu. Rev. Phytopathol. 30: 507–528.
- Brachi, B., G.P. Morris and J.O. Borevitz (2011) Genome-wide association studies in plants: the missing heritability is in the field. Genome Biol. 12: 232.
- Bradbury, P.J., Z. Zhang, D.E. Kroon, T.M. Casstevens, Y. Ramdoss and E.S. Buckler (2007) TASSEL: software for association mapping of complex traits in diverse samples. Bioinformatics 23: 2633–2635.
- Fujino, K., H. Sekiguchi, T. Sato, H. Kiuchi, Y. Nonoue, Y. Takeuchi, T. Ando, S.Y. Lin and M. Yano (2004) Mapping of quantitative trait loci controlling low-temperature germinability in rice (Oryza sativa L.). Theor. Appl. Genet. 108: 794–799.
- Fujino, K. and N. Iwata (2011) Selection for low-temperature germinability on the short arm of chromosome 3 in rice cultivars adapted to Hokkaido, Japan. Theor. Appl. Genet. 123: 1089–1097.
- Fukuoka, S., N. Saka, H. Koga, K. Ono, T. Shimizu, K. Ebana, N. Hayashi, A. Takahashi, H. Hirochika, K. Okuno et al. (2009) Loss of function of a proline-containing protein confers durable disease resistance in rice. Science 325: 998–1001.
- Fukuoka, S., S. Yamamoto, R. Mizobuchi, U. Yamanouchi, K. Ono, N. Kitazawa, N. Yasuda, Y. Fujita, T.T.T. Nguyen, S. Koizumi et al. (2014) Multiple functional polymorphisms in a single disease resistance gene in rice enhance durable resistance to blast. Scientific Rep. 4: 4550.
- Fukuoka, S., N. Saka, Y. Mizukami, H. Koga, U. Yamanouchi, Y. Yoshioka, N. Hayashi, K. Ebana, R. Mizobuchi and M. Yano (2015) Gene pyramiding enhances durable blast disease resistance in rice. Scientific Rep. 5: 7773.
- Gupta, P.K., S. Rustgi and P.L. Kulwal (2005) Linkage disequilibrium and association studies in higher plants: Present status and future prospects. Plant Mol. Biol. 57: 461–485.
- Hayashi, N., H. Inoue, T. Kato, T. Funao, M. Shirota, T. Shimizu, H. Kanamori, H. Yamane, Y. Hayano-Saito, T. Matsumoto et al. (2010) Durable panicle blast-resistance gene Pb1 encodes an atypical CC-NBS-LRR protein and was generated by acquiring a promoter through local genome duplication. Plant J. 64: 498–510.
- IRGSP (2005) The map-based sequence of the rice genome. Nature 436: 793–800.
- Kaga, A., T. Shimizu, S. Watanabe, Y. Tsubokura, Y. Katayose, K. Harada, D.A. Vaughan and N. Tomooka (2012) Evaluation of soybean germplasm conserved in NIAS genebank and development of mini core collections. Breed. Sci. 61: 566–592.
- Kuroki, M., K. Saito, S. Matsuba, N. Yokogami, H. Shimizu, I. Ando and Y. Sato (2007) A quantitative trait locus for cold tolerance at the booting stage on rice chromosome 8. Theor. Appl. Genet. 115: 593–600.
- McCouch, S.R., L. Teytelman, Y. Xu, K.B. Lobos, K. Clare, M. Walton, B. Fu, R. Maghirang, Z. Li, Y. Xing et al. (2002) Development and mapping of 2240 new SSR markers for rice (Oryza sativa L.). DNA Res. 9: 199–207.
- Murray, M.G. and W.F. Thompson (1980) Rapid isolation of high molecular weight plant DNA. Nucleic Acids Res. 8: 4321–4326.
- Nagasaki, H., K. Ebana, T. Shibaya, J. Yonemaru and M. Yano (2010) Core single-nucleotide polymorphisms—a tool for genetic analysis of the Japanese rice population. Breed. Sci. 60: 648–655.
- Nonoue, Y., K. Fujino, Y. Hirayama, U. Yamanouchi, S.Y. Lin and M. Yano (2008) Detection of quantitative trait loci controlling extremely early heading in rice. Theor. Appl. Genet. 116: 715–722.
- Pritchard, J.K., M. Stephens and P. Donnelly (2000) Inference of population structure using multilocus genotype data. Genetics 155: 945–959.
- Saito, K., K. Miura, K. Nagano, Y. Hayano-Saito, A. Saito, H. Araki and A. Kato (1995) Chromosomal location of quantitative trait loci for cool tolerance at the booting stage in rice variety ‘Norin-PL8’. Breed. Sci. 45: 337–340.
- Sato, H., Y. Takeuchi, H. Hirabayashi, H. Nemoto, M. Hirayama, H. Kato, T. Imbe and I. Ando (2006) Mapping QTLs for field resistance to rice blast in Japanese upland rice variety Norin 12. Breed. Sci. 56: 415–418.
- Shinada, H., N. Iwata, T. Sato and K. Fujino (2013) Genetical and morphological characterization of cold tolerance at fertilization stage in rice. Breed. Sci. 63: 197–204.
- Shinada, H., T. Yamamoto, E. Yamamoto, K. Hori, J. Yonemaru, S. Matsuba and K. Fujino (2014) Historical changes in population structure during rice breeding programs in the northern limits of rice cultivation. Theor. Appl. Genet. 127: 995–1004.
- Shinada, H., T. Yamamoto, E. Yamamoto, K. Hori, Y. Hirayama, T. Maekawa, H. Kiuchi, H. Sato and T. Sato (2015) Quantitative trait loci for whiteness of cooked rice detected in improved rice cultivars in Hokkaido. Breed. Sci. 65: 201–207.
- Shirasawa, S., T. Endo, K. Nakagomi, M. Yamaguchi and T. Nishio (2012) Delimitation of a QTL region controlling cold tolerance at booting stage of a cultivar, ‘Lijiangxintuanheigu’, in rice, Oryza sativa L. Theor. Appl. Genet. 124: 937–946.
- Storey, J.D. and R. Tibshirani (2003) Statistical significance for genomewide studies. Proc. Natl. Acad. Sci. USA 100: 9440–9445.
- Yamamoto, T., J. Yonemaru and M. Yano (2009) Towards the understanding of complex traits in rice: Substantially or superficially? DNA Res. 16: 141–154.
- Yamamoto, T., H. Nagasaki, J. Yonemaru, K. Ebana, M. Nakajima, T. Shibaya and M. Yano (2010) Fine definition of the pedigree haplotypes of closely related rice cultivars by means of genome-wide discovery of single-nucleotide polymorphisms. BMC Genomics 11: 267.
- Yamasaki, M. and O. Ideta (2013) Population structure in Japanese rice population. Breed. Sci. 63: 49–57.
- Yasuda, N., K. Zenbayashi and K. Fujita (2008) Identification of an avirulence gene in Magnaporthe oryzae which controls avirulence to the resistance rice cultivar ‘Hokkai188’. Jpn. J. Phytopathol. 74: 191.
- Yonemaru, J., T. Yamamoto, K. Ebana, E. Yamamoto, H. Nagasaki, T. Shibaya and M. Yano (2012) Genome-wide haplotype changed produced by artificial selection during modern rice breeding in Japan. PLoS One 7: e32982.
- Yonemaru, J., R. Mizobuchi, H. Kato, T. Yamamoto, E. Yamamoto, K. Matsubara, H. Hirabayashi, Y. Takeuchi, H. Tsunematsu, T. Ishi et al. (2014) Genomic regions involved in yield potential detected by genome-wide association analysis in Japanese high-yielding rice cultivars. BMC Genomics 15: 346.
- Zenbayashi-Sawata, K., S. Fukuoka, S. Katagiri, M. Fujisawa, T. Matsumoto, T. Ashizawa and S. Koizumi (2007) Genetic and physical mapping of the partial resistance gene, Pi34, to blast in rice. Phytopathology 97: 598–602.