Abstract
A total of 448 samples in five natural populations of wild rice (Oryza rufipogon) were collected in Cambodia. They were examined using 12 SSR and two chloroplast markers to evaluate the degree of variation among populations and the genetic structure within populations. In the two annual populations, the number of plants with homozygous alleles at all 12 SSR loci were high (66.3% and 79.5%), suggesting that these plants propagate mainly through self-pollination. In the three perennial populations, no individuals had all homozygous genotypes, but redundant genotypes resulted from clonal propagation were observed. Percentages of the redundant genotypes were highly varied (3.6%, 29.2% and 86.0%). This may be due to the different stable levels of environmental conditions. As for chloroplast genome, most of the wild plants showed the same chloroplast types as most Indica-type cultivars have. However, plants with different chloroplast types were maintained, even in the same population. In tropical Asian countries, many wild rice populations were observed under similar ecological conditions examined in this study. Therefore, the present results concerning population structure will be important to further elucidate genetic features of wild rice, and will also give strong clues to utilize and conserve wild natural genetic resources.
Introduction
Most existing crop plants have been domesticated from wild forms. In rice, cultivated rice of Oryza sativa L. was originated from Asian wild rice, Oryza rufipogon Griff. (Oka 1988). In the early stage of domestication, people selected rice plants with desirable morphological traits, such as non-seed-shattering habit, no seed dormancy and high seed production (Tanksley and McCouch 1997). Subsequently, local varieties were established according to different natural and cultural environments. More recently, modern breeding techniques have been applied to produce elite genetic lineages of rice. However, artificial selection and breeding have rapidly reduced genetic variation in cultivated rice. Although wild rice is inferior in terms of production quantities, it may retain beneficial genes that have been lost in cultivated rice through artificial selection and breeding. In fact, there is considerable evidence that wild rice genes can improve the yield of cultivated rice and its resistance to diseases (Brar and Khush 1997, Xiao et al. 1996, 1998). However, to utilize these beneficial genes, we must further understand the degree of genetic variation in wild rice species.
Molecular markers are powerful tools for determining genetic diversity among crop species, and microsatellite or simple sequence repeat (SSR) markers can detect variation among related species (McCouch et al. 1997). Although genetic variation in wild rice has been previously studied, most of them have been seed-derived materials acquired from germplasm institutes or seed banks, but these materials do not wholly reflect the real figure of wild rice, as they are artificially maintained by seed propagation from single plants. Under natural conditions, wild rice generally forms a population to adapt to marked environmental changes. These indicate that studies using seed-derived materials from germplasm institutes can not provide information on natural wild plants with no or less seed production, and also can not reveal genetic variation at the population level.
Several studies have evaluated genetic variation among wild natural populations in China, Laos, Myanmar, Vietnam and Thailand (Gao 2004, Ishii et al. 2011, Kuroda et al. 2007, Pusadee et al. 2013, Wang et al. 2012, Zhou et al. 2003). They estimated observed and expected heterozygosity values, gene diversity values and genetic distances based on the allelic variation at SSR loci. However, the wild rice populations were maintained through various propagation methods, such as seed (self-pollination and cross-pollination) and clonal propagation, and their mixture. Therefore, we should also clarify population structure by determining the identical genotypes at the individual level in each population.
Cambodia has many diverse ecosystems including regions subject to drought, flooding and low soil nutrient availability (Javier 1997). Cambodia has an area of 181,035 km2, bordering on Thailand, Laos and Vietnam, with the large central plain containing Mekong River complex and Tonle Sap Lake in the center (Nesbitt 1997). In the rainy season, the central plain is flooded with water associated with Mekong River. Rice is cultivated in a wide range of agroclimatic conditions, including areas that are irrigated, rain-fed or flood-prone (Nesbitt and Phaloeun 1997), and accordingly, many rice cultivars and wild forms are grown throughout the country. An early study of Cambodian rice diversity analyzed about 300 local varieties, focusing on seed morphology (Hamada 1965). Decades later, Orn et al. (2014) analyzed genetic variation in the same seed samples using 12 SSR markers, and found that these varieties had considerable genetic variation. However, despite the prominence of wild rice throughout Cambodia, little is known about its genetic structure.
To address this knowledge gap, this study examined a large number of DNA samples in wild rice populations in Cambodia using the 12 SSR markers, aiming to reveal genetic structure and temporal changes in genetic diversity among wild rice populations. The population structure was further revealed at the individual level by determining the identical genotypes across all the SSR markers in each population. This novel information with population ecological data will be important to utilize and conserve wild natural genetic resources.
Materials and Methods
Wild rice populations in Cambodia
In November 2007, we surveyed wild rice in Cambodia, and five research sites (CB61, CB63, CB64, CB66 and CB68) were selected to cover various growing conditions (Fig. 1, Table 1). In CB61 and CB68, all the wild rice plants withered and dried in the dry season according to the local people, and the plant morphology was the same as the typical annual form described by Vaughan (1994). Therefore, we classified them as annual populations, and the rest (CB63, CB64 and CB66) as perennial ones. At each site, leaves were collected from the different plants at 1–4 m intervals according to the population size. Leaves were crashed with a wooden hammer, and the extract was fixed on an FTA card (GE Healthcare). These sample sets represented existing wild plants grown under natural conditions. In November 2014, we visited the same sites to record temporal changes in the wild rice populations. However, at two sites (CB61 and CB66), the plants no longer existed because of infrastructure development. At the remaining three sites, sample collection and leaf extract fixation were performed as in 2007.

Table 1
Geographical and ecological information on five wild rice populations in Cambodia
| Site |
Ecotype |
Habitat |
Shape (approximate size) |
Paddy field |
Condition in dry season |
Latitude |
Longitude |
No. samples |
| 2007 |
2014 |
| CB61 |
Annual |
Roadside |
Rectangle blook (20 × 100 m) |
Not around |
Dry up |
11º33′03.4″ |
104º50′29.3″ |
92 |
– |
| CB63 |
Perennial |
Pond |
Oval circumference (200 m) |
Not around |
Partially dry |
13º24′19.6″ |
103º47′50.0″ |
92 |
48 |
| CB64 |
Perennial |
Deep water |
Discontiuous patches (200 × 800 m) |
Beside (or on) |
Paddy field |
13º15′41.4″ |
103º50′08.1″ |
64 |
64 |
| CB66 |
Perennial |
Paddy ditch |
Linear (3 × 100 m) |
Beside |
Partially dry |
11º35′01.6″ |
104º51′37.5″ |
100 |
– |
| CB68 |
Annual |
Paddy ditch |
Linear (2 × 200 m) |
Beside |
Dry up |
13º23′34.7″ |
103º55′35.0″ |
100 |
100 |
A total of 12 SSR markers (RM2, RM31, RM44, RM60, RM201, RM208, RM225, RM229, RM231, RM237, RM247 and RM258) across the 12 rice chromosomes were used in this study. These markers were developed by Chen et al. (1997). Two chloroplast DNA markers, ORF29 and ORF100, were also used to analyze cytoplasmic variation in wild rice populations. They were previously used to detect mutations between Japonica-type and Indica-type cultivars: most Indica-type cultivars have a 69 base pair (bp) deletion and a 32-bp insertion in ORF100 and ORF29 flanking regions, respectively (Ishii et al. 1988, Tang et al. 2004). PCR was performed in a 20 μL mixture containing 0.5 μM of each primer, 10 μL of 2X PCR buffer (TOYOBO), 0.1 U KOD FX Neo polymerase, and a small disk (1.25 mm in diameter; punched out from the FTA card) as a template. Before PCR, a small FTA disk was washed with FTA purification reagent (GE Healthcare). The amplification profile was as follows: 2 min at 95ºC for initial denaturation, followed by 35 cycles of 30 sec at 94ºC, 30 sec at 60ºC, 2 min at 68ºC, and ending with 2 min at 68ºC for final extension. The PCR products were electrophoresed in 4% polyacrylamide gel, and the band pattern was visualized using silver staining method as described by Panaud et al. (1996).
Evaluation of genetic variation in Cambodian wild rice
Genetic variation within wild rice populations was examined based on the gene diversity value (Nei 1987), which corresponds to expected heterozygosity for a random mating population. Averages were used as overall gene diversity values to compare the genetic variation within populations. For three populations, temporal changes were further examined based on overall gene diversity values and individual genotypes. Genetic differentiation among wild rice populations was evaluated based on Nei’s genetic distances (Nei 1972). These values were calculated using POPGENE ver. 1.31 (Yeh et al. 1999), and an unrooted dendrogram was constructed using UPGMA with the TreeView program (Page 1996).
Data on local and modern rice varieties in Cambodia
Previously, we surveyed genetic variation among 311 local and modern varieties of rice in Cambodia (Orn et al. 2014). Of these, 276 were collected by the late Prof. Hamada, Hyogo University of Agriculture, Japan in 1957 and 1958. Hamada (1965) classified them into four groups, “floating rice”, “rice in dry regions”, “common non-glutinous rice” and “glutinous rice” (Supplemental Table 1). The other 35 were modern varieties produced by pure line selection in Cambodia (Supplemental Table 2). Because analyses were based on the same 12 SSR markers used for Cambodian wild rice populations, data were also used to compare genetic variation and differentiation between wild and cultivated rice groups.
Results
Genetic variation within populations in Cambodian wild rice in 2007
A total of 448 leaf samples of wild rice were collected at five research sites in 2007, and leaf extracts were fixed on FTA cards. The electromorph band patterns of 12 SSR markers, and the number of alleles per locus were used to calculate the observed heterozygosity and the gene diversity (corresponding to the expected heterozygosity) for each population (Table 2). On average, observed heterozygosity of the annual populations CB61 (0.05) and CB68 (0.10) was lower than that of the perennial populations CB63 (0.81), CB64 (0.67) and CB66 (0.76). This indicates that annual populations were fixed as homozygotes. In addition, the gene diversity values of the annual populations, CB61 (0.60) and CB68 (0.22), were relatively low compared to the perennial populations, which ranged from 0.58 in CB63 to 0.79 in CB64. The overall gene diversity value of Cambodian wild rice was 0.81. These indicate high genetic variation in Cambodian wild rice was mainly due to that in perennial populations.
Table 2
Number of alleles per locus (A), observed heterozygosity (Ho), and gene diversity (D) found in five Cambodian wild rice populations in 2007
| Marker |
Chr. |
CB61 |
CB63 |
CB64 |
CB66 |
CB68 |
Overall |
| A |
HO |
D |
A |
HO |
D |
A |
HO |
D |
A |
HO |
D |
A |
HO |
D |
A |
Ho |
D |
| RM237 |
1 |
7 |
0.08 |
0.74 |
3 |
0.76 |
0.49 |
13 |
0.72 |
0.86 |
11 |
0.67 |
0.80 |
4 |
0.12 |
0.25 |
20 |
0.44 |
0.83 |
| RM208 |
2 |
5 |
0.05 |
0.63 |
3 |
0.76 |
0.52 |
10 |
0.69 |
0.79 |
10 |
0.82 |
0.71 |
6 |
0.09 |
0.23 |
11 |
0.46 |
0.79 |
| RM60 |
3 |
6 |
0.05 |
0.68 |
3 |
0.93 |
0.52 |
4 |
0.61 |
0.59 |
4 |
0.71 |
0.59 |
2 |
0.05 |
0.05 |
7 |
0.45 |
0.64 |
| RM241 |
4 |
10 |
0.02 |
0.73 |
6 |
0.99 |
0.62 |
16 |
0.55 |
0.90 |
15 |
0.82 |
0.80 |
5 |
0.07 |
0.22 |
28 |
0.47 |
0.85 |
| RM31 |
5 |
3 |
0.02 |
0.29 |
4 |
0.99 |
0.67 |
15 |
0.61 |
0.90 |
13 |
0.89 |
0.86 |
7 |
0.10 |
0.24 |
15 |
0.51 |
0.85 |
| RM225 |
6 |
5 |
0.05 |
0.52 |
2 |
0.82 |
0.48 |
13 |
0.70 |
0.87 |
15 |
0.85 |
0.86 |
4 |
0.11 |
0.11 |
18 |
0.50 |
0.69 |
| RM2 |
7 |
8 |
0.05 |
0.76 |
6 |
0.47 |
0.60 |
7 |
0.52 |
0.65 |
10 |
0.31 |
0.75 |
7 |
0.15 |
0.25 |
13 |
0.29 |
0.83 |
| RM44 |
8 |
4 |
0.02 |
0.44 |
4 |
0.29 |
0.39 |
12 |
0.81 |
0.83 |
8 |
0.88 |
0.76 |
7 |
0.12 |
0.27 |
17 |
0.40 |
0.81 |
| RM201 |
9 |
9 |
0.09 |
0.74 |
3 |
0.99 |
0.61 |
11 |
0.72 |
0.88 |
10 |
0.72 |
0.71 |
5 |
0.12 |
0.22 |
20 |
0.51 |
0.87 |
| RM258 |
10 |
8 |
0.07 |
0.75 |
4 |
0.97 |
0.88 |
9 |
0.61 |
0.71 |
12 |
0.94 |
0.75 |
5 |
0.13 |
0.25 |
24 |
0.53 |
0.88 |
| RM229 |
11 |
6 |
0.05 |
0.57 |
3 |
0.90 |
0.58 |
13 |
0.79 |
0.81 |
10 |
0.86 |
0.76 |
5 |
0.06 |
0.33 |
18 |
0.52 |
0.76 |
| RM247 |
12 |
6 |
0.03 |
0.35 |
4 |
0.82 |
0.54 |
8 |
0.69 |
0.72 |
8 |
0.70 |
0.79 |
5 |
0.08 |
0.19 |
14 |
0.45 |
0.86 |
| Average |
|
6.4 |
0.05 |
0.60 |
3.8 |
0.81 |
0.58 |
10.9 |
0.67 |
0.79 |
10.5 |
0.76 |
0.76 |
5.2 |
0.10 |
0.22 |
17.1 |
0.46 |
0.81 |
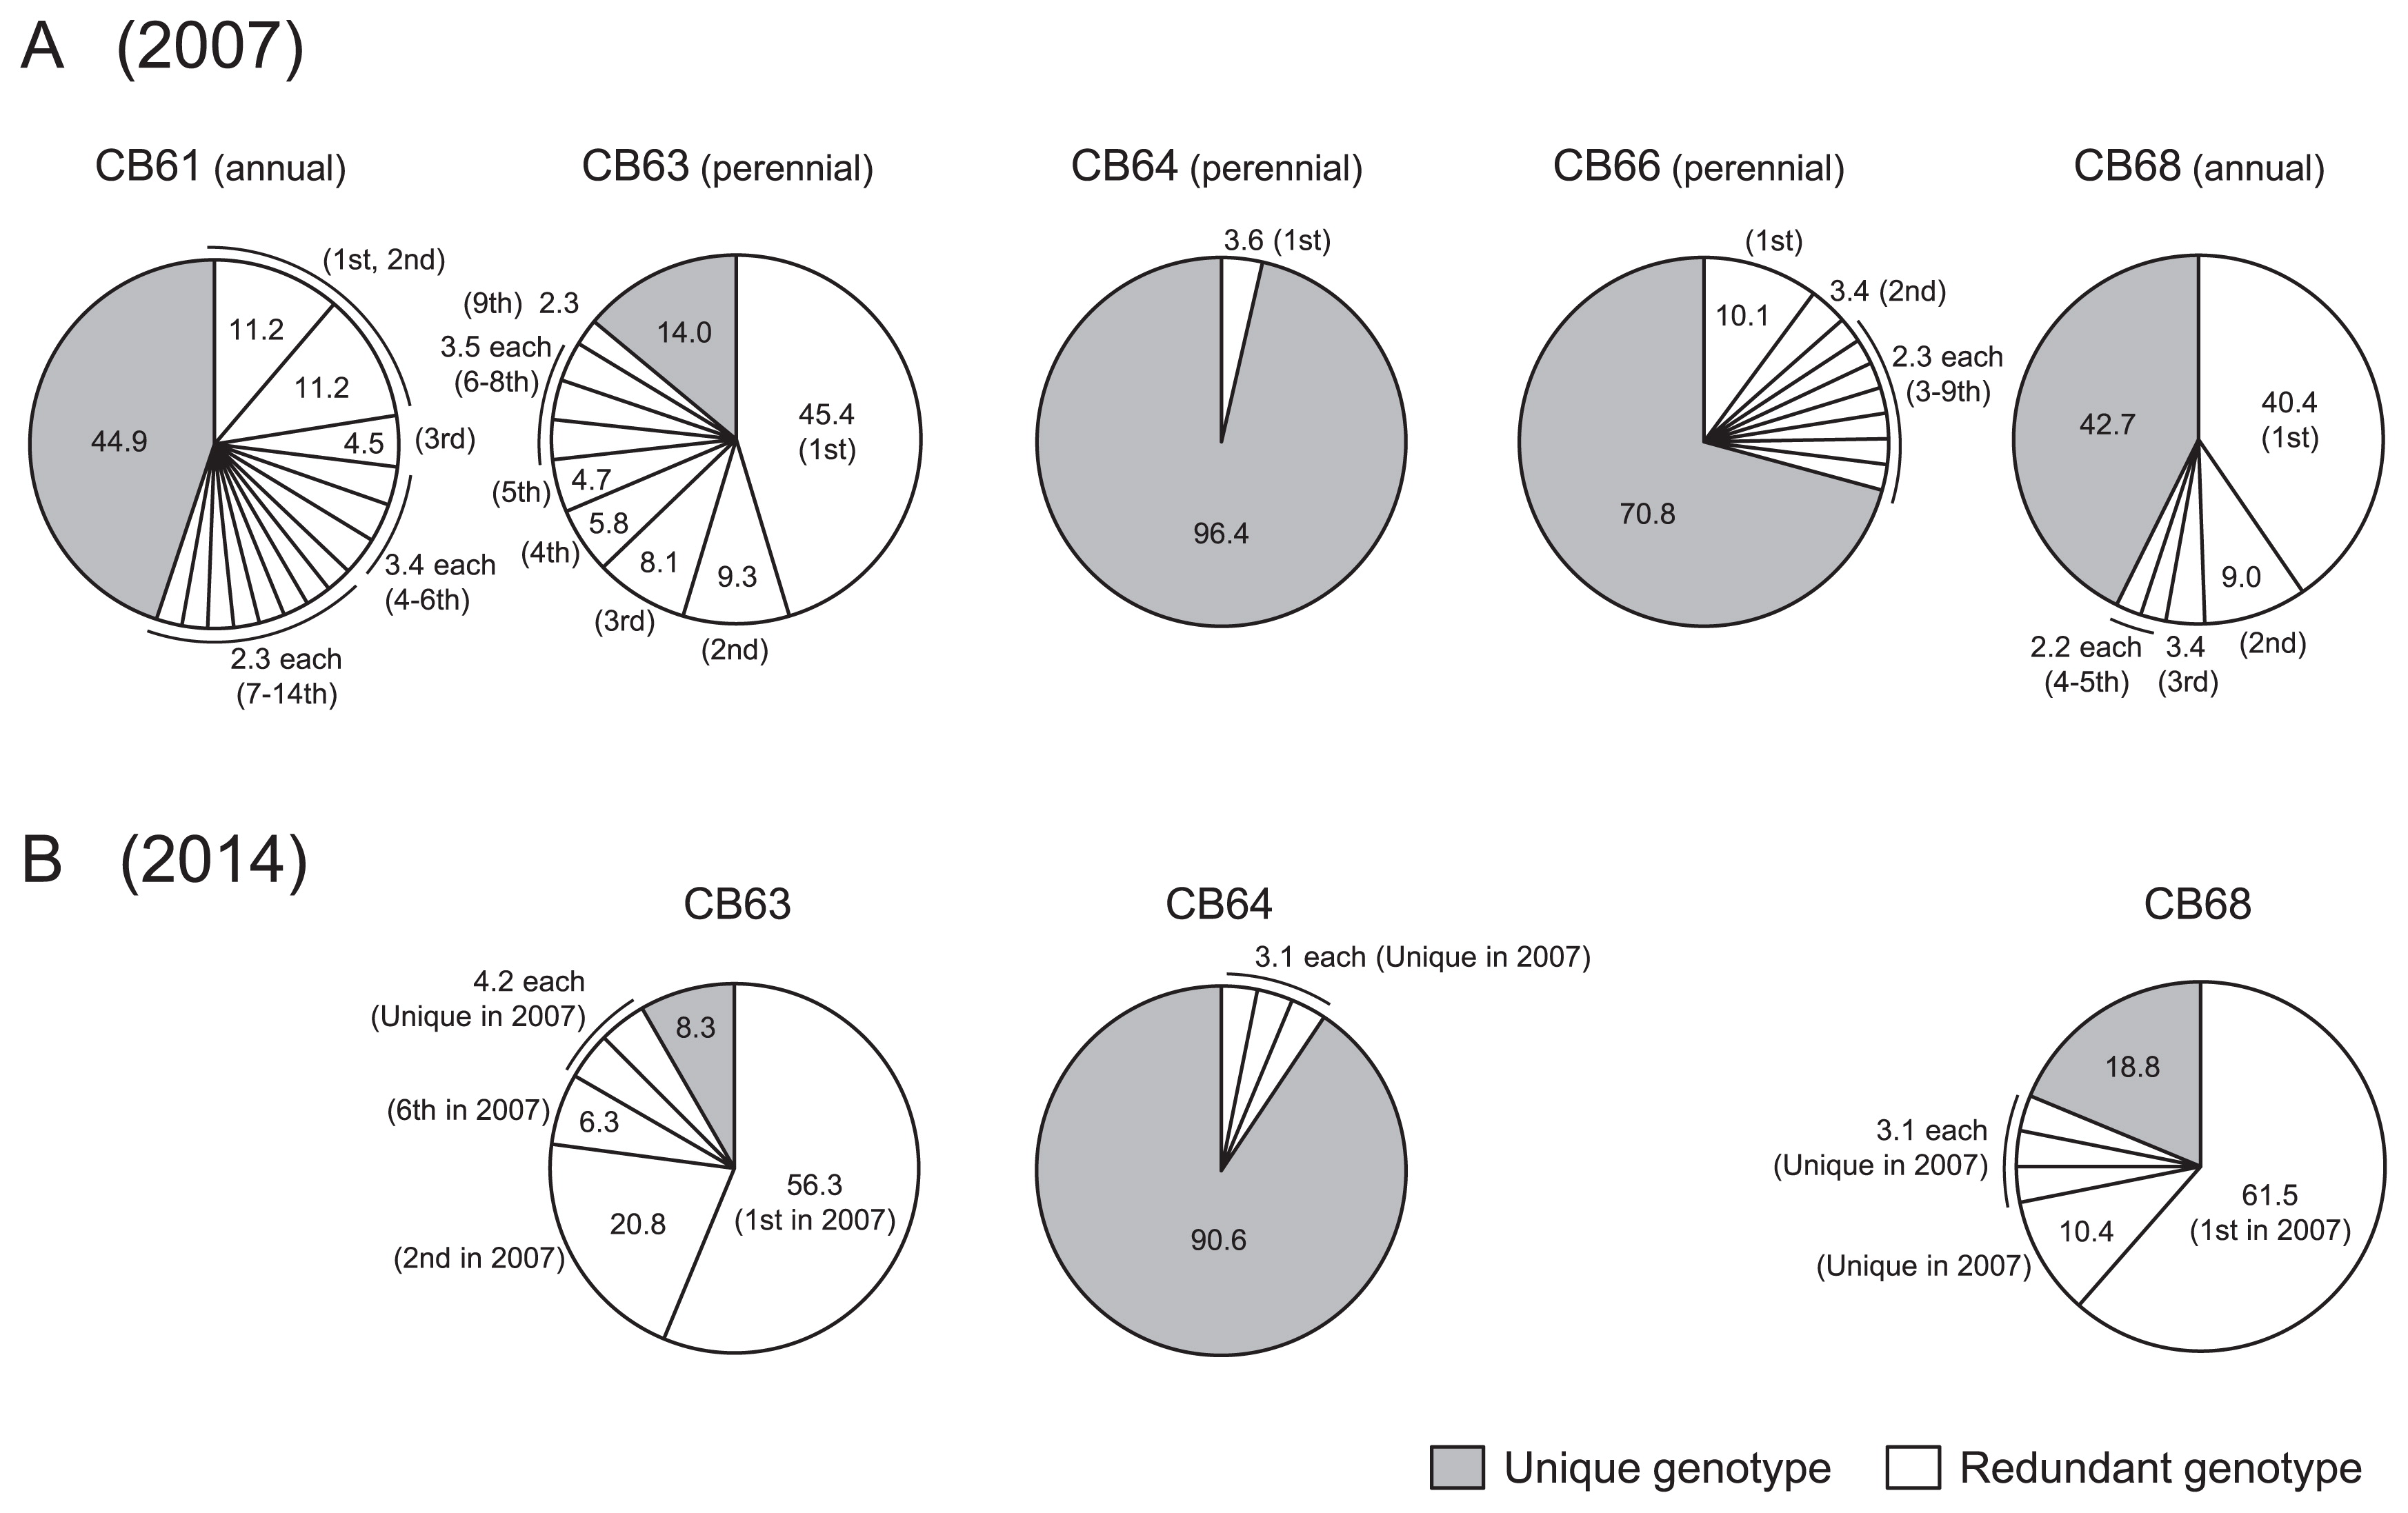
The observed heterozygosity and gene diversity were calculated using only the overall allele frequency at each locus. In order to investigate the population structure, individual genotypes across the 12 SSR marker loci were surveyed. Fig. 2 shows percentages of genotypes shared with more than two plants (hereafter redundant genotypes) in the order of frequency. In 2007, 14, 9, 1, 9 and 5 redundant genotypes were detected in CB61, CB63, CB64, CB66 and CB68, respectively (Fig. 2A). The rest were deemed unique genotypes and were only observed in a single plant. In CB63 and CB68 populations, the most frequent genotypes constituted 45.4% and 40.4% of plants, respectively. Conversely, in CB61 and CB66, about 10% of plants shared the most frequent genotype, whereas only 3.6% in CB64 had identical genotypes while the rest were unique. The overall percentages of redundant genotypes in CB61, CB63, CB64, CB66 and CB68 were 55.1%, 86.0%, 3.6%, 29.2% and 57.3%, respectively. With regard to homozygous fixation, no individuals had all homozygous genotypes at the 12 SSR loci in perennial populations. On the other hand, in the annual populations, fixed homozygous genotypes were found in 79.5% (CB61) and 66.3% (CB68) of plants. These results suggest that identical genotypes were generated through clonal and seed propagation in perennial and annual populations, respectively.
Two chloroplast DNA markers, ORF29 and ORF100, detect a 69-bp deletion and a 32-bp insertion, respectively. These mutations were found in most Indica-type cultivars, while Japonica-type cultivars and the distantly-related species shared the same type without mutations (Ishii and Tsunewaki 1991, Ishii et al. 1993). They were named as A (original type) and B (mutant type). Among four possible chloroplast types, A/A, A/B and B/B (indicating ORF100/ORF29 chloroplast types) were observed in five wild rice populations in 2007 (Table 3). In CB63 and CB68, the chloroplast types were fixed as B/B. In other populations, B/B type occurred as a majority. This suggests that the chloroplast genome of most Cambodian wild rice is the same as that of ancestral wild rice of Indica-type cultivars. In addition, because the B/A type was not detected, the mutation at ORF29 might occur ahead of the mutation at ORF100. Although the chloroplast genome is conservative, plants with different chloroplast types were maintained even in the same population.
Table 3
Number of plants having different genotypes of chloroplast markers (ORF100 and ORF29) found among five wild rice populations in Cambodia
| Site |
Year |
ORF100/ORF29a |
| A/Ab |
A/Bb |
B/Bb |
| CB61 |
2007 |
5 |
10 |
77 |
| CB63 |
2007 |
0 |
0 |
92 |
|
2014 |
0 |
0 |
48 |
| CB64 |
2007 |
1 |
11 |
52 |
|
2014 |
1 |
17 |
46 |
| CB66 |
2007 |
15 |
22 |
63 |
| CB68 |
2007 |
0 |
0 |
100 |
|
2014 |
0 |
0 |
100 |
a ORF100 genotype/ORF29 genotype.
b A and B: Original and Indica specific genotypes, respectively.
In 2014, wild rice plants were surveyed at three research sites (CB63, CB64 and CB68) that were previously sampled in 2007. In total, 212 samples were analyzed using the same set of 12 SSR markers and two chloroplast markers (Supplemental Table 3). The average observed heterozygosity values of the 12 SSR markers for CB63, CB64 and CB68 populations were 0.82, 0.62 and 0.07, respectively. These values were very similar to the values determined in the 2007 survey (0.81, 0.67 and 0.10, respectively) (Table 2, Fig. 3A). In addition, the average values of gene diversity for CB63 (0.59), CB64 (0.78) and CB68 (0.31) were also similar to those found in 2007 (Fig. 3B). These results indicate that heterozygosity and allele frequency in these three populations were maintained from 2007 to 2014. Moreover, chloroplast genome variation was also conserved in these populations (Table 3). Fig. 2B illustrates redundant and unique genotypes in three populations. Although the genotype frequencies differed slightly between 2007 and 2014, the most frequent genotypes were retained in CB63 and CB68.

The genetic differentiation among five wild rice populations in Cambodia was evaluated based on the Nei’s genetic distances in 2007 (Table 4). These values ranged from 0.78 to 1.46, with an average of 1.09, showing an almost equal level of genetic differentiation among populations. Previously, Orn et al. (2014) analyzed Cambodian local and modern rice varieties with the same set of 12 SSR markers used in this study, and found genetic distances between five cultivar groups ranging from 0.09 (between non-glutinous and modern rice groups) to 0.51 (between floating and dry region rice groups). Their average genetic distance of 0.25 was about 1/4 of that for wild rice, illustrating the greater genetic differentiation in Cambodian wild rice. A phylogenetic tree was constructed based on genetic distances (Fig. 4), which showed two major groups: one group consisted of CB61 and CB68, and the other contained the rest. These groups corresponded to the annual and perennial populations, respectively, and ecological factors likely influenced this genetic differentiation among wild rice populations.
Table 4
Nei’s genetic distances between Cambodian wild populations based on the data in 2007
| Population |
CB61 |
CB63 |
CB64 |
CB66 |
CB68 |
| CB61 |
– |
|
|
|
|
| CB63 |
1.29 |
– |
|
|
|
| CB64 |
1.46 |
0.93 |
– |
|
|
| CB66 |
1.01 |
0.91 |
0.78 |
– |
|
| CB68 |
0.88 |
1.06 |
1.31 |
1.26 |
– |
Regarding the gene diversity value, we examined Cambodian cultivated rice varieties using the same set of markers (Orn et al. 2014). The overall gene diversity values for 276 local varieties and 35 modern varieties were 0.55 and 0.46, respectively. The lower genetic variation in the modern varieties may be caused by modern plant breeding (pure line selection). The overall value for wild rice was 0.81, which was much higher than those in cultivars (Fig. 5). These results exemplify that artificial selection and breeding activities can reduce genetic variation in crop species.
Discussion
Five research sites were selected to represent various ecological conditions in which wild rice naturally grows (Table 1). In CB61 and CB68, the land completely dried during the dry season, so populations were maintained with seed propagation of annual plants. The average observed heterozygosity values in 2007 were quite low in CB61 (0.05) and CB68 (0.10), suggesting that these annual plants propagate mainly through self-pollination (Table 2). The number of plants homozygous at all 12 SSR loci were high in CB61 (79.5%) and CB68 (66.3%). In CB61, all 14 redundant genotypes (55.1% in total) and more than half of the unique genotypes (24.4%) were homozygous at 12 SSR loci, indicating that this population consists of many kinds of homozygous plants through self-pollinated seed propagation. This mixed genetic structure may have occurred due to a wide distribution area (ca. 20 × 100 m) and less human disturbance, as CB61 was located in open vacant land between National Road and the airport fence in Phnom Penh, with no adjacent paddy fields. In 2014, this population no longer existed because of the expansion of the airport. In CB68, annual plants grew along the paddy ditch in a narrow long strip (2 × 200 m). Furthermore, the population was beside a paddy field, and farmers may have periodically cut the plants to clean the ditch. Under such severe human disturbance, some annual genotypes would survive through seed propagation, and in 2007, almost half the population was occupied by two redundant genotypes (40.4% and 9.0%). In the same population, 42.7% of genotypes were unique, but most of them had at least one heterozygous allele at the 12 loci. This suggests that there may be some gene flow from the cultivars in the nearby paddy field.
In 2007, the perennial plants were observed in three sites (CB63, CB64 and CB66) where water and humidity remained throughout the dry season (Table 1). The wild plants in CB63 grew along the water’s edge of the pond at an elementary school and may have been periodically cut but not removed, and the site was not near the paddy field. This may have allowed clonal propagation in the population, and considering the high average observed heterozygosity (0.81) in the population (Table 2), the redundant genotypes (86.0%) could not have been produced through seed propagation. In addition, most of the unique genotypes (14.0%) may have been generated through clonal propagation. This was strongly supported by the highly observed heterozygosity (0.99) with only three alleles at RM201 (Table 2). Wild plants in CB66 grew under similar condition as in CB63 except that CB66 was near the paddy field and therefore may have suffered disturbances by farmers. This kind of human activity may lead to decreased redundant genotypes (29.2% in total) in CB66 (Fig. 2A). Much less redundancy (3.6%) was observed in the CB64 population. In this site, samples were collected from wild rice floating on the floodwater (2–3 m in depth) covering the paddy fields in the expanded Tonle Sap Lake. In CB64 and CB66 populations, high allele numbers and gene diversity values were observed (Table 2), and the populations mainly consisted of unique genotypes (96.4% in CB64 and 70.8% in CB66). Especially in CB64, seeds and stems may have been relocated and mixed along with the flood flow. Their high genetic variation may have been maintained by both seed (self-pollination and cross-pollination) and clonal propagation.
Temporal changes in genetic variation were examined in three populations (CB63, CB64 and CB68) between 2007 and 2014. Population genetics parameters of observed heterozygosity and gene diversity were found to be similar in three populations (Fig. 3). Regarding the redundant genotypes, the most frequent types were retained in CB63 and CB68 (Fig. 2B). In 2014, we found that the distribution area of wild rice decreased because of the size reduction of the pond at population CB63 and the road expansion at population CB68. These changes likely caused different frequencies for the genotypes at the individual level. Furthermore, chloroplast type variation was maintained in the three populations (Table 3). These results suggest that allele frequency and chloroplast genome types were mostly maintained between 2007 and 2014, but genotype frequencies varied depending on the population size change.
In 2014, the wild plants disappeared at two sites (CB61 and CB66) because of infrastructure development. Such rural industrialization is common in tropical Asian countries, and wild rice habitat is gradually decreasing. Since wild rice is one of important natural genetic resources, we should consider its conservation. The present results indicate that wild rice in annual populations can be preserved as seeds because they mainly consist of homozygous plants through self-pollinated seed propagation. However, perennial populations keep many types of heterozygous plants through both seed and clonal propagation, suggesting that they should be maintained by in situ conservation to keep genetic variation in the populations.
The genetic differentiation among five wild rice populations was evaluated based on Nei’s genetic distances. Although ecological conditions and allelic variation were different, almost equal levels of genetic differentiation were observed among the five populations (Table 4). In the phylogenetic tree, annual and perennial populations were mostly divided (Fig. 4), suggesting that genetic differentiation was influenced by ecological, rather than geographical, factors. Using the same set of SSR markers, gene diversity values for wild rice, local varieties and modern varieties were compared (Fig. 5) (Orn et al. 2014). This clearly shows that domestication and modern breeding activities have reduced genetic variation in Cambodian rice.
Our research group has conducted wild rice surveys in Cambodia, Vietnam, Myanmar, Thailand and Laos for 10 years, and has observed more than 150 wild rice populations. In this study, five wild populations in Cambodia were selected, as they were typical wild forms; annual types growing beside paddy field and in open area, perennial types beside paddy field, around the water reservoir and in deep-water area. Based on our experience, many wild rice populations in tropical Asian countries could be classified into the five forms mentioned above. In addition, we previously found that ecological factors had a much greater influence on genetic differentiation among the wild rice populations than did geographical factors (Ishii et al. 2011). Therefore, the present results concerning population structure and genetics will be important to further elucidate genetic features of wild rice in Asia, and will also give strong clues to utilize and conserve wild natural genetic resources.
Acknowledgements
We thank Hiroki Kageyama, Kobe University, for his kind help in genotyping SSR and chloroplast markers. This work was supported in part by a Grant-in-Aid (Nos. 18405017 and 26304020 to T.I.) from Japanese Society for Promotion of Science (JSPS).
Literature Cited
- Brar, D.S. and G.S. Khush (1997) Alien introgression in rice. Plant Mol. Biol. 35: 35–47.
- Chen, X., S. Temnykh, Y. Xu, Y.G. Cho and S.R. McCouch (1997) Development of a microsatellite framework map providing genome-wide coverage in rice (Oryza sativa L.). Theor. Appl. Genet. 95: 553–567.
- Gao, L. (2004) Population structure and conservation genetics of wild rice Oryza rufipogon (Poaceae): a region-wide perspective from microsatellite variation. Mol. Ecol. 13: 1009–1024.
- Hamada, H. (1965) Rice in mekong valleys. In: Matsumoto, N. (ed.) Indo-Chinese Studies: Synthetic Research of the Culture of Rice-cultivating Races in Southeast Asian Countries (I), Japanese Society of Ethnology, Tokyo, pp. 505–586.
- Ishii, T., T. Terachi and K. Tsunewaki (1988) Restriction endonuclease analysis of chloroplast DNA from A-genome diploid species of rice. Jpn. J. Genet. 63: 523–536.
- Ishii, T. and K. Tsunewaki (1991) Chloroplast genome differentiation in Asian cultivated rice. Genome 34: 818–826.
- Ishii, T., T. Terachi, N. Mori and K. Tsunewaki (1993) Comparative study on the chloroplast, mitochondrial and nuclear genome differentiation in two cultivated rice species, Oryza sativa and O. glaberrima, by RFLP analyses. Theor. Appl. Genet. 86: 88–96.
- Ishii, T., T. Hiraoka, T. Kanzaki, M. Akimoto, R. Shishido and R. Ishikawa (2011) Evaluation of genetic variation among wild populations and local varieties of rice. Rice 4: 170–177.
- Javier, E.L. (1997) Rice ecosystems and varieties. In: Nesbitt, H.J. (ed.) Rice Production in Cambodia, Cambodia-IRRI-Australia Project, International Rice Research Institute, Manila, pp. 39–81.
- Kuroda, Y., Y.I. Sato, C. Bounphanousay, Y. Kono and K. Tanaka (2007) Genetic structure of three Oryza AA genome species (O. rufipogon, O. nivara and O. sativa) as assessed by SSR analysis on the Vientiane Plain of Laos. Conserv. Genet. 8: 149–158.
- McCouch, S.R., X. Chen, O. Panaud, S. Temnykh, Y. Xu, Y.G. Cho, N. Huang, T. Ishii and M. Blair (1997) Microsatellite marker development, mapping and applications in rice genetics and breeding. Plant Mol. Biol. 35: 89–99.
- Nei, M. (1972) Genetic distance between populations. Am. Nat. 106: 283–292.
- Nei, M. (1987) Molecular evolutionary genetics. Columbia University Press, New York, p. 512.
- Nesbitt, H.J. (1997) Topography, climate, and rice production. In: Nesbitt, H.J. (ed.) Rice Production in Cambodia, Cambodia-IRRI-Australia Project, International Rice Research Institute, Manila, pp. 15–20.
- Nesbitt, H.J. and C. Phaloeun (1997) Rice-based farming systems. In: Nesbitt, H.J. (ed.) Rice Production in Cambodia, Cambodia-IRRI-Australia Project, International Rice Research Institute, Manila, pp. 31–38.
- Oka, H.I. (1988) Origin of cultivated rice. Japan Scientific Societies Press, Tokyo, p. 254.
- Orn, C., R. Ishikawa, S. Sophany, O. Makara and T. Ishii (2014) Evaluation of genetic variation among rice local and modern varieties in Cambodia. J. Crop Res. 59: 37–41.
- Page, R.D.M. (1996) TREEVIEW: An application to display phylogenic trees on personal computers. Comput. Appl. Biosci. 12: 357–358.
- Panaud, O., X. Chen and S.R. McCouch (1996) Development of microsatellite markers and characterization of simple sequence length polymorphism (SSLP) in rice (Oryza sativa L.). Mol. Gen. Genet. 252: 597–607.
- Pusadee, T., B.A. Schaal, B. Rerkasem and S. Jamjod (2013) Population structure of the primary gene pool of Oryza sativa in Thailand. Genet. Resour. Crop Evol. 60: 335–353.
- Tang, J., H. Xia, M. Cao, X. Zhang, W. Zeng, S. Hu, W. Tong, J. Wang, J. Wang, J. Yu et al. (2004) A comparison of rice chloroplast genomes. Plant Physiol. 135: 412–420.
- Tanksley, S.D. and S.R. McCouch (1997) Seed banks and molecular maps: Unlocking genetic potential from the wild. Science 277: 1063–1066.
- Vaughan, D.A. (1994) The wild relatives of rice. International Rice Research Institute, Manila, Philippines, p. 137.
- Wang, Y.P., C. Bounphanousay, K. Kanyavong, I. Nakamura, Y.I. Sato, T. Sato, H.S. Zhang, L. Tang and R. Ishikawa (2012) Population structural analysis of an in-situ conservation site for wild rice in Laos. Genes Genet. Syst. 87: 311–322.
- Xiao, J., S. Grandillo, S.N. Ahn, S.R. McCouch, S.D. Tanksley, J. Li and L. Yuan (1996) Genes from wild rice improve yield. Nature 384: 223–224.
- Xiao, J., J. Li, S. Grandillo, S.N. Ahn, L. Yuan, S.D. Tanksley and S.R. McCouch (1998) Identification of trait-improving quantitative trait loci alleles from a wild rice relative, Oryza rufipogon. Genetics 150: 899–909.
- Yeh, F.C., R.C. Yang and T. Boyle (1999) POPGENE. Microsoft windows-based freeware for population genetic analysis. Release 1.31 University of Alberta, Edmonton.
- Zhou, H., X. Zhong and S. Ge (2003) Microsatellite analysis of genetic diversity and population genetic structure of a wild rice (Oryza rufipogon Griff.) in China. Theor. Appl. Genet. 107: 332–339.

