Abstract
Tolerance to low-phosphorus soil is a desirable trait in soybean cultivars. Previous quantitative trait locus (QTL) studies for phosphorus-deficiency tolerance were mainly derived from bi-parental segregating populations and few reports from natural population. The objective of this study was to detect QTLs that regulate phosphorus-deficiency tolerance in soybean using association mapping approach. Phosphorus-deficiency tolerance was evaluated according to five traits (plant shoot height, shoot dry weight, phosphorus concentration, phosphorus acquisition efficiency and use efficiency) comprising a conditional phenotype at the seedling stage. Association mapping of the conditional phenotype detected 19 SNPs including 13 SNPs that were significantly associated with the five traits across two years. A novel cluster of SNPs, including three SNPs that consistently showed significant effects over two years, that associated with more than one trait was detected on chromosome 3. All favorable alleles, which were determined based on the mean of conditional phenotypic values of each trait over the two years, could be pyramided into one cultivar through parental cross combination. The best three cross combinations were predicted with the aim of simultaneously improving phosphorus acquisition efficiency and use efficiency. These results will provide a thorough understanding of the genetic basis of phosphorus deficiency tolerance in soybean.
Introduction
Phosphorus (P) is an essential macronutrient required for plant growth and development. However, P availability is limited in most soils worldwide due to P fixation by Fe and Al oxides and the formation of organic P complexes, especially in tropical and subtropical areas (Vance et al. 2003, Wang et al. 2010). Soybean, one of the most important food and oil crops in the world, is generally considered to have a high P requirement for optimal seed yield and quality. Thus, a lack of available phosphate in soil is one of the primary stresses that reduce soybean productivity. Application of P fertilizers can alleviate this problem, but excess P application leads to water source contamination and reduction of limited P resources (Cordell et al. 2009). Therefore, breeding soybean cultivars with improved ability to access soil-bound P and/or efficiently utilize endogenous P is a sustainable and economical approach to solve this problem.
Phosphorus deficiency affects soybean development and physiology throughout its ontogeny, e.g., by reducing the biomass and P concentration of seedlings, decreasing the leaf area (Fredeen et al. 1990), and changing the balance of diurnal starch accumulation and utilization (Qiu et al. 1992). In general terms, early developmental stages are more vulnerable to phosphorus deficiency than mature stages. Phosphorus deficiency during early developmental stages results in a large reduction in the number of soybean nodes and kernels, and recovery cannot occur even if sufficient P is supplied at later stages (Wang 1963, Wu et al. 2012). A similar phenomenon has been reported for wheat and barley (Brenchley 1929, Gericke 1924): P deficiency during the first 4–6 weeks of growth decreases the development of the tiller and the formation of the head in barley and wheat. These results indicate that rapid and vigorous plant seedling growth under P deficient conditions may be an important prerequisite for optimal soybean yield. Therefore, variation in certain traits at the seedling stage might be of importance in breeding for phosphorus-deficiency tolerance. Further, determination of the genetic control of phosphorus-deficiency tolerance during early vegetative development is necessary for developing P-efficient varieties.
However, the genetic basis of phosphorus-deficiency tolerance is complex and controlled by multiple genes. Quantitative trait locus (QTL) analysis is often used to dissect phosphorus-deficiency tolerance-related complex traits. In recent years, several QTL mapping studies have been conducted to better understand P efficiency in rice (Wissuwa et al. 1998), wheat (Su et al. 2009), maize (Zhu et al. 2006), Brassica napus (Yang et al. 2010), and common bean (Beebe et al. 2006). Nevertheless, to our knowledge, the genetic analysis of phosphorus efficiency in soybean is only in the early stages compared with that in other crops. Currently, some QTLs underlying phosphorus-deficiency tolerance at the seedling stage in soybean have been detected using bi-parental segregating populations. Three QTLs for fresh shoot weight at the seedling stage were mapped on the F linkage group by Li et al. (2005). Zhang et al. (2009) identified 34 additive QTLs for five parameters related to phosphorus-deficiency tolerance at the seedling stage by using a RIL population derived from Nannong 94–156 and Bogao. Liang et al. (2010) detected 31 QTLs for twelve phosphorus-deficiency tolerance-related traits, which were distributed on five linkage groups. However, classical marker development methodologies for trait dissection can be inefficient and expensive because bi-parental design suffers from two main limitations, namely, limited allelic diversity and poor mapping solution, due to limited recombination events during population creation.
Fortunately, association analysis studies can overcome these limitations. Association analysis is another analytical approach for QTL detection that exploits linkage disequilibrium (LD) between markers and closely linked QTLs in irregular population structures. This powerful technique enables researchers to exploit natural diversity and locate candidate genes in the genome (Korte and Farlow 2013). With the development of assay-based high-throughput marker systems, association mapping for QTL discovery has gained popularity in a range of plants (Atwell et al. 2010, Huang et al. 2012, Kump et al. 2011, Sukumaran et al. 2015). Association mapping has been successfully used for soybean to identify favorable alleles for various traits, including yield-related traits (Sonah et al. 2014), quality-related traits (Hwang et al. 2014), and resistance traits (Mamidi et al. 2011). Recently, a genome-wide association study was conducted to accelerate molecular breeding for the improvement of phosphorus efficiency related traits during the reproductive stage in a natural population. GmACP1, which is an important gene related to P efficiency in soybean, was identified by combining genome-wide association analysis, linkage analysis, and other analyses (Zhang et al. 2014b). GmACP1 encodes an acid phosphatase which was assessed by expression in Escherichia coli (BL21). When GmACP1 was over-expressed in soybean roots, the hairy roots of transgenic plants secreted more acid phosphatase to catalyze the hydrolysis of ρ-nitrophenyl phosphate and release inorganic phosphate for soybean absorption (Zhang et al. 2014b). These results demonstrate that association mapping can also be used to identify favorable alleles for phosphorus efficiency in soybean.
In this study, 219 soybean accessions were used to conduct an association analysis by combining information on 1142 single nucleotide polymorphism (SNP) markers. Five traits of soybean seedlings, including plant shoot height (PH), shoot dry weight (SDW), phosphorus concentration (PC), phosphorus acquisition efficiency (PAE) and use efficiency (PUE), were phenotyped in 2012 and 2013 under two different P conditions. The aims of this study were to determine the genetics of phosphorus-deficiency tolerance at the soybean seedling stage and to detect SNPs associated with phosphorus-deficiency tolerance with the aim of improving soybean stress resistance using marker-assisted selection (MAS).
Materials and Methods
Plant materials and culture
A set of 219 soybean landraces with diverse geographic origins and variant phenotypes were phenotyped to perform association mapping. For all accessions, the germplasm name, origin and the probability of being classified into each subpopulation are listed in Supplemental Table 1. This experimental population, which included landraces, cultivars and breeding lines, originated from 26 different provinces and six ecological regions of soybean cultivation in China (latitude 53 to 24ºN and longitude 134 to 97ºE). The experimental population was used to identify quantitative trait nucleotides (QTN) associated with yield (Hao et al. 2012a), SC7 resistance (Yan et al. 2015), and protein content (Zhang et al. 2014a). These accessions were selected because they display diverse genetic variation in their phosphorus efficiency.
Two independent pot trials at the soybean seedling stage were carried out in 2012 and 2013. The soil used in the pot trials was collected from the Jiangpu Experimental Station of Nanjing Agricultural University (32º12′ N, 118º37′ E), Nanjing, China. According to previous studies, soil is considered phosphorus deficient if the concentration of soil available P is less than 10 mg kg−1, whereas an ideal soil for plant growth has an available P concentration higher than 20 mg kg−1 (Bray and Kurtz 1945, Colwell and Esdaile 1968). The total and available P in the soil used in this study were 942 and 8.51 mg kg−1, respectively; therefore, this soil was considered phosphorus-deficient. The experiment was performed using a completely randomized design with a split-plot restriction according to Furlani et al. (2002). The main plots were defined by their P treatment (plus P and minus P), while the subplots were the 219 genotypes. The genotypes were sown in a pot (two plants per pot) containing 4 kg of dry soil. There were three replicates with six plants in each trial. The soil for the plus P treatment received 60 mg kg−1 of N (as urea) and 20 mg kg−1 of K (as potassium chloride) and 20 mg kg−1 of P (as potassium dihydrogen phosphate). The soil for the minus P treatment contained the same amounts of N and K but no P. Chemical fertilizer was applied as a basal dressing before sowing using a broadcast application. Tap water was used for irrigation when the growth conditions were consistent with drought.
Evaluation of plant performance and phenotypic analysis
Plant shoot height (PH) was measured before harvest as the length of the cotyledon node to the top of the growing point. The aerial parts of the plant from the cotyledon node were harvested after 35 days of growth. Shoot dry weight (SDW) was determined by incubating the sample at 105ºC for 60 min and then oven-drying at 65ºC for 72 hours. The phosphorus concentration (PC) was determined using nitric acid digestion and ICP emission spectroscopy as described by Li et al. (2005). The phosphorus acquisition efficiency (PAE) was calculated as the total amount of phosphorus in each shoot, and shoot P use efficiency (PUE) was calculated as the shoot dry weight produced per unit of phosphorus (g dry weight/mg phosphorus) (Gourley et al. 1994). We analyzed the phenotypes of five traits measured under the plus P and minus P conditions, as well as the modified phenotype calculated from the phenotypes under the two P conditions. The modified phenotype was obtained as the residual in regressing the phenotypic value under the minus P condition on that under the plus P condition. This modified phenotype is referred to as the conditional phenotype and is considered to be a suitable index for phosphorus-deficiency tolerance. The conditional phenotype was calculated using QGAStation 2.0 software (Zhu 1995).
Statistical analysis
Statistical analysis for all traits was conducted using SAS 8.1 (SAS Institute, Cary, NC, USA). Analysis of variance (ANOVA) for all phenotypic data was performed using PROC GLM. Correlation analyses were conducted using PROC CORR for each trait based on the mean values measured over two years. Trait measurements were averaged based on the replications prior to association analysis. The broad-sense heritability estimate (h2) was calculated for each trait across different P environments according to the approach described by Shi et al. (2009).
Association analysis
In the present experimental population, 192 of 219 soybean landraces were genotyped for 1536 SNPs described by Hao et al. (2012a). To reduce the risk of false-positive marker-trait associations, SNPs showing residual allelic heterogeneity in the accession were considered missing data as well as SNPs with minor allele frequencies of 10% or less. Thus, a total of 1142 SNPs were utilized for the association analysis study. Association analysis based on conditional phenotypes is termed conditional association analysis (Cui et al. 2011, Zhang and Wang 2015, Zhu 1995), whereas analysis using the original phenotype is referred to as unconditional association analysis. TASSEL 4.0 (Bradbury et al. 2007) software was used to conduct association mapping. Association mapping was performed using the mixed linear model (Q+K), which greatly reduces false positive rates (Yu et al. 2006). The population structure (Q), inferred using the software program STRUCTURE 2.2 (Pritchard et al. 2000), was previously described by Hao et al. (2012a). The kinship matrix (K) was estimated using TASSEL 4.0 software. Only those markers that met the criterion of −log (P) > 2.0 for their P values in both years were considered to be significant SNPs. A Manhattan plot of the P values for all traits examined in the association analyses was constructed using Origin 8.0 (Origin. ver.8.0 for Windows 7, OriginLab., 2008, USA).
Prediction of novel parental combinations
To identify novel elite combinations of parents from the experimental population, we evaluated the novel parental combinations according to the predicted phenotypic values of the hypothetical offspring from the crosses between parental cultivars. First, we selected the elite accessions, which were with relatively higher mean values of phosphorus efficiency-related traits in both years, and contained more than one favorable allele of stable SNPs determined by t-test, for crossing to generate hypothetical progenies. To predict the phenotypic values of the hypothetical offspring, we assumed that the markers that were significantly associated with traits co-segregated with the loci controlling the traits, and that the alleles at different loci were in accordance with the law of independent assortment. Then, the phenotypic values of CPAE and CPUE were predicted for the hypothetical crossed offspring as the sums of the QTL effects that were estimated based on their QTL genotypes and the mean values of the experimental population over two years for the conditional phenotypes. The hypothetical offspring of a parental combination is termed the elite offspring, which was with highest phenotypic values of CPAE and CPUE in all the hypothetical progenies. Finally, the best three cross combinations were selected for breeding in future according to relatively higher predicted phenotypic values of CPAE and CPUE of those elite offspring.
BLAST analysis
A number of candidate genes and pathways that may be involved in the evolution of phosphorus-deficiency tolerance have been obtained in Arabidopsis thaliana (Fang et al. 2009, Plaxton et al. 2011, Zhang et al. 2014c). These genes were used as a query in a BLASTP analysis against soybean proteins in Phytozome v10.2 (http://www.phytozome.net). Genes were selected based on the top 40 hits with an E-value cut-off of 10−20 (Mamidi et al. 2011).
Results
Significant variation among soybean accessions with respect to phosphorus-efficiency traits
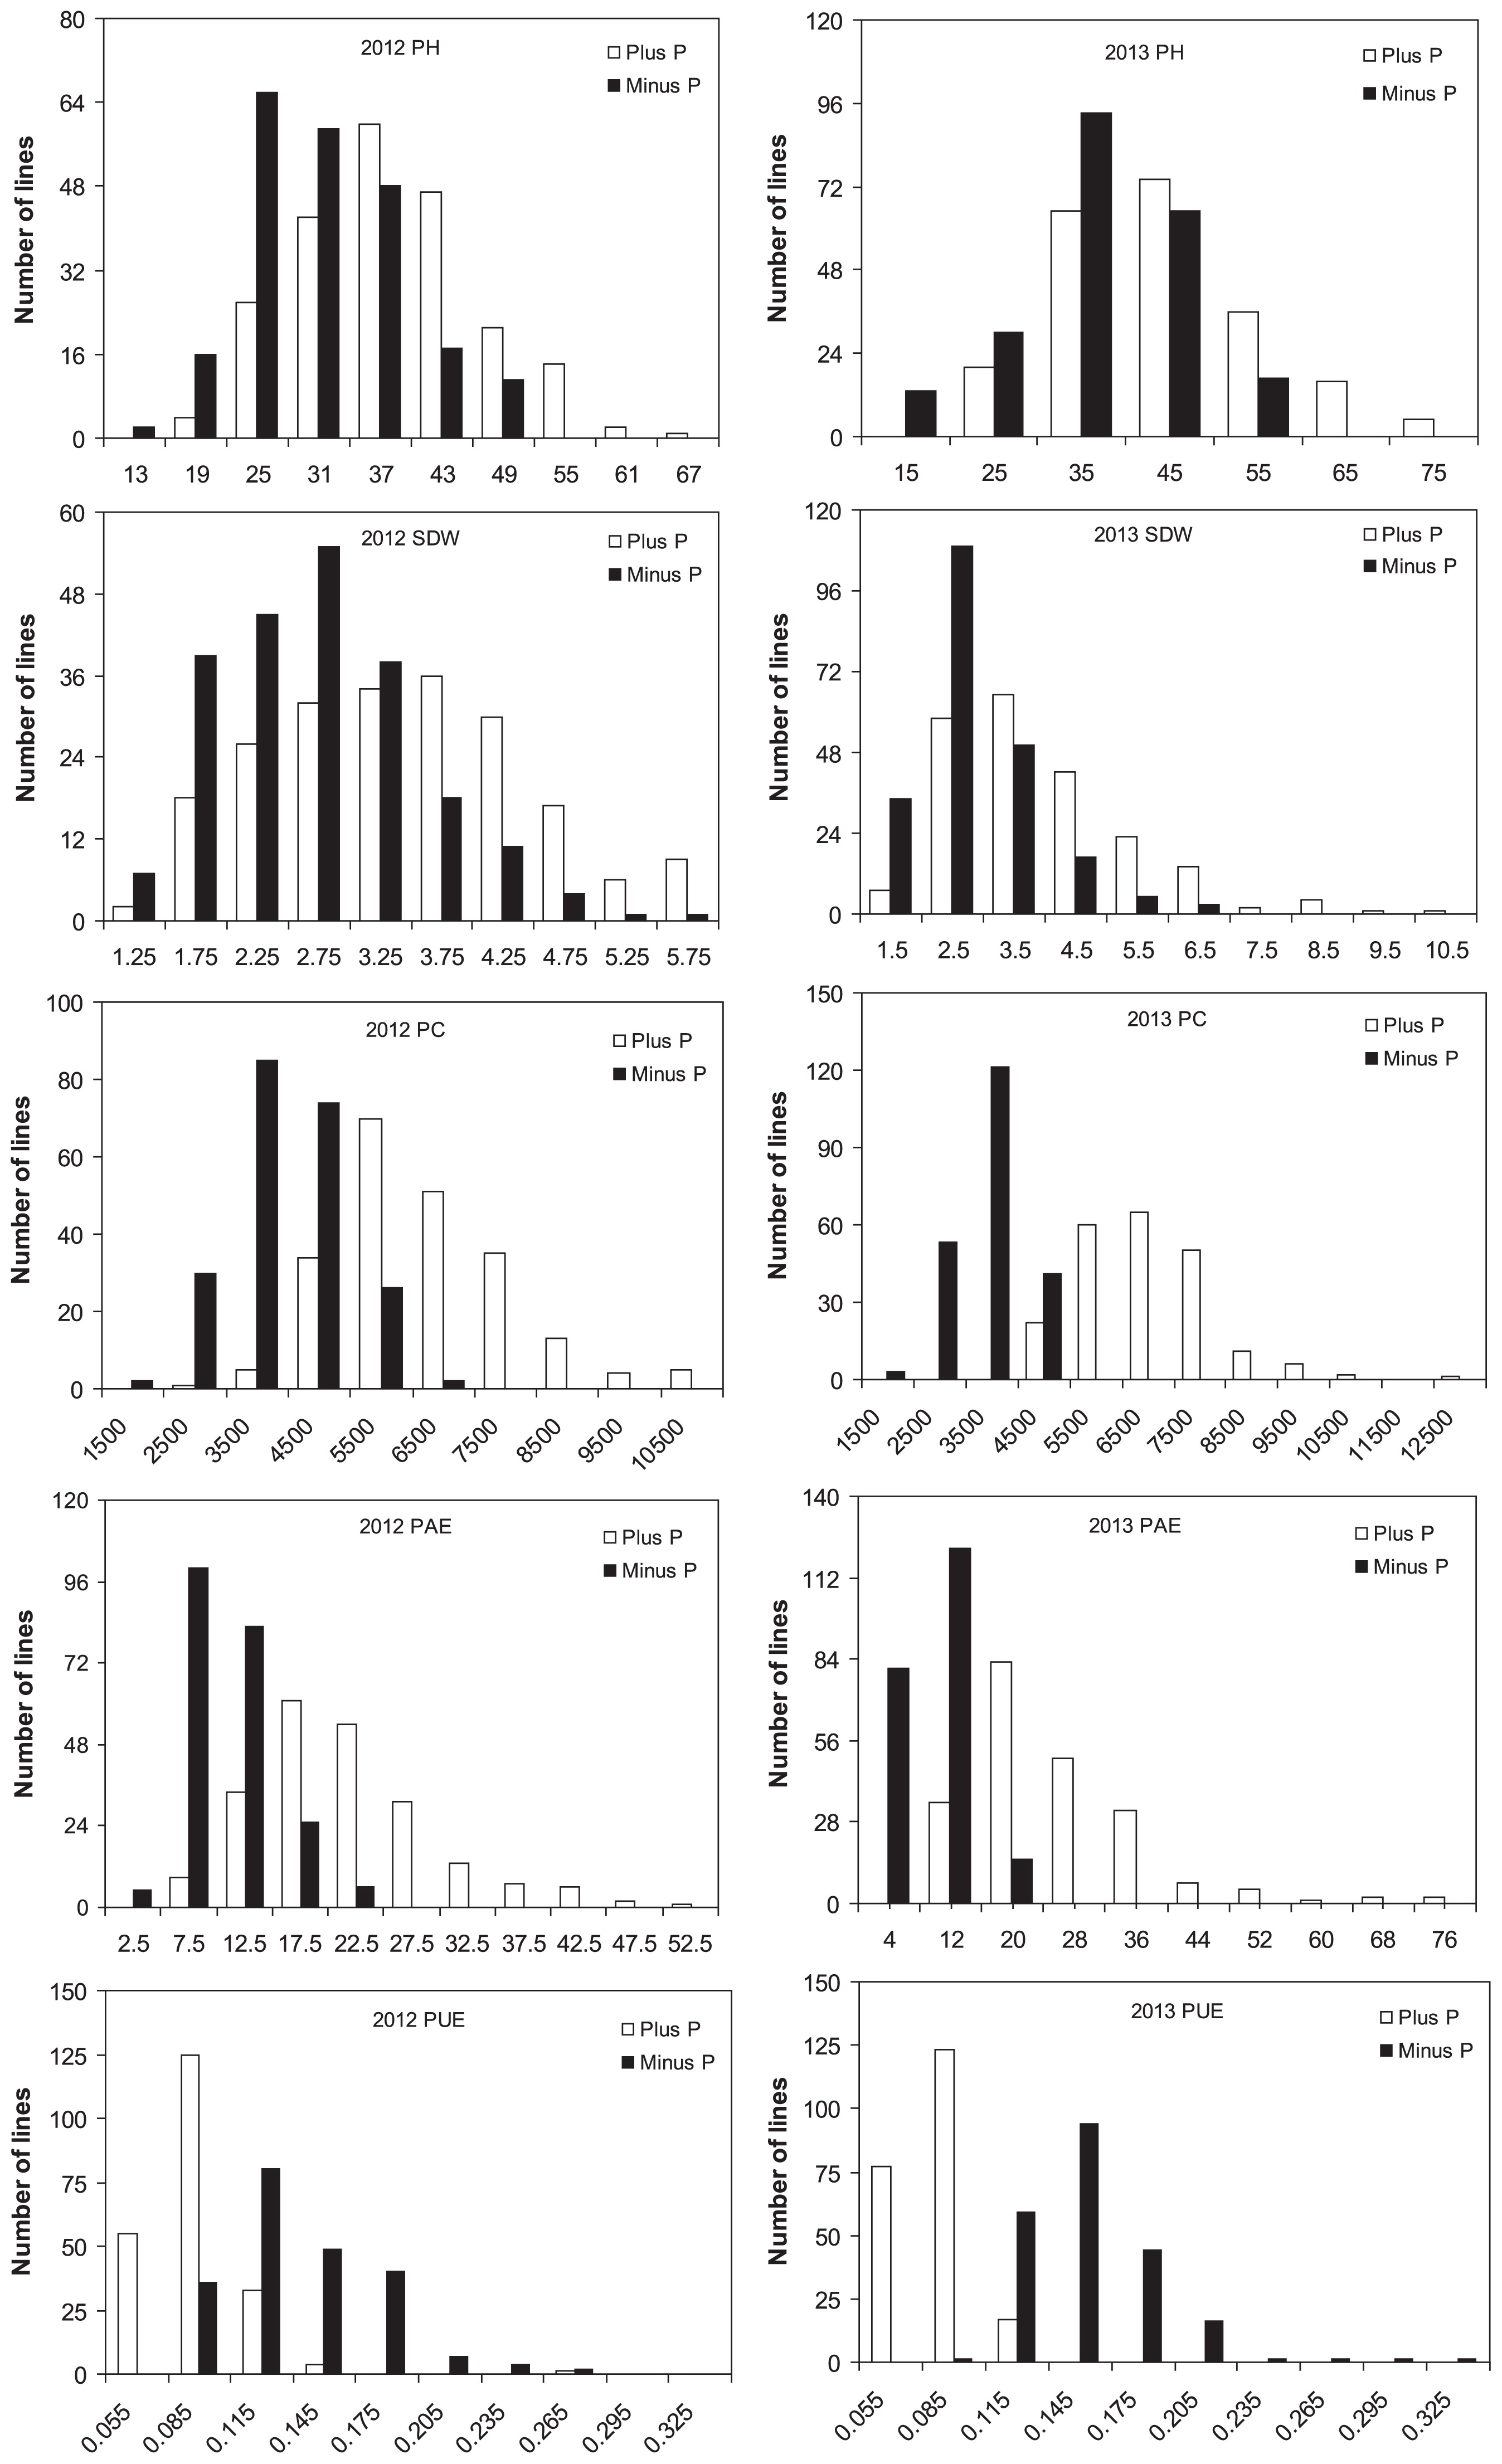
The mean values, standard deviations, ranges, and broad-sense heritability of the five traits related to seedling growth under the two P conditions are shown in Table 1. The phenotypic values of these five traits showed large variation among the association panel in the two years of experiments, with coefficients of variation (CVs = SD/Mean × 100%) ranging from 17.43% for PC in the minus P condition in 2013 to 57.14% for PUE in the minus P condition in 2012. The CVs of most traits exceeded 20%. Phosphorus was significantly correlated with soybean growth in all the accessions in the field. Under the minus P condition, the mean phenotypic values for PH, SDW, PC and PAE significantly decreased, but PUE significantly increased in both years. Analysis of variance showed that genotype, P level, and P level × genotype had significant effects on the five traits in the experimental population, suggesting that the treatments and genetic background were very important in explaining the overall phenotypic variation. The distribution of the trait values among all individual lines fell into the expected normal continuous distributions (Fig. 1), indicating polygenic control.
Table 1
Means, range, variation, ANOVA, and broad-sense heritability results of five phosphorus efficiency traits from the association population
| Trait |
Year |
Treatment |
Mean ± SD |
CV% |
Range |
ANOVA |
h2 |
| Pa |
Gb |
P × G |
| PH (cm) |
2012 |
Minus-P |
31.72 ± 6.74 |
21.25 |
14.00–48.67 |
** |
** |
** |
0.63 |
|
|
Plus-P |
38.20 ± 9.39 |
24.58 |
19.67–65.33 |
|
|
|
|
|
2013 |
Minus-P |
37.17 ± 8.14 |
21.9 |
18.50–58.00 |
* |
** |
** |
|
|
|
Plus-P |
43.97 ± 11.95 |
27.18 |
21.33–76.5 |
|
|
|
|
| SDW (g) |
2012 |
Minus-P |
2.74 ± 0.83 |
30.29 |
1.16–5.79 |
** |
** |
** |
0.47 |
|
|
Plus-P |
3.55 ± 1.19 |
33.52 |
1.39–8.00 |
|
|
|
|
|
2013 |
Minus-P |
2.84 ± 0.99 |
34.86 |
1.15–6.62 |
** |
** |
** |
|
|
|
Plus-P |
3.95 ± 1.53 |
38.73 |
1.36–10.21 |
|
|
|
|
| PC (μg/g) |
2012 |
Minus-P |
3968 ± 861.21 |
21.7 |
1720–6055 |
* |
** |
** |
0.53 |
|
|
Plus-P |
6165 ± 1398 |
22.68 |
2547–10644 |
|
|
|
|
|
2013 |
Minus-P |
3417 ± 595.65 |
17.43 |
1512–4971 |
** |
** |
** |
|
|
|
Plus-P |
6476 ± 1245 |
19.22 |
4107–12159 |
|
|
|
|
| PAE |
2012 |
Minus-P |
10.82 ± 3.91 |
36.14 |
2.95–24.41 |
** |
** |
** |
0.39 |
|
|
Plus-P |
21.63 ± 8.14 |
37.63 |
6.28–50.30 |
|
|
|
|
|
2013 |
Minus-P |
9.67 ± 3.63 |
37.54 |
3.44–22.70 |
* |
** |
** |
|
|
|
Plus-P |
25.48 ± 11.24 |
44.11 |
9.47–79.20 |
|
|
|
|
| PUE |
2012 |
Minus-P |
0.14 ± 0.08 |
57.14 |
0.08–0.35 |
** |
** |
** |
0.51 |
|
|
Plus-P |
0.09 ± 0.05 |
55.56 |
0.04–0.27 |
|
|
|
|
|
2013 |
Minus-P |
0.15 ± 0.06 |
40 |
0.10–0.33 |
** |
** |
** |
|
|
|
Plus-P |
0.08 ± 0.03 |
37.5 |
0.04–0.12 |
|
|
|
|
PH: plant shoot height; SDW: shoot dry weight; PC: phosphorus concentration; PAE: phosphorus acquisition efficiency; PUE: phosphorus use efficiency.
Simple correlations among the five traits were calculated based on the means of two years of continuous data from 219 accessions (Table 2). With the exception of SDW and PUE, which were not significantly correlated, both positive and negative correlations were detected between the other traits under both the minus and plus P conditions. PAE was strongly positively correlated with SDW and moderately positively correlated with PH and PC at both P levels, which implies that PAE and other traits may share related genetic determinants or mechanisms. However, PAE was moderately negatively correlated with PUE, which is consistent with observations from previous studies (Cui et al. 2007, Geng et al. 2007). The highest significant negative correlation (r = −0.94) was found between PUE and PC for the minus P condition. PUE and PAE were significantly negatively correlated under both P levels. PC showed a low but significant correlation with SDW under both P conditions, which suggests that shoot biomass may have exerted a “dilution effect” on the shoot phosphorus concentration in the experimental population.
Table 2
Sample correlation coefficients between different phosphorus traits in the association population under minus P (below diagonal) and plus P (above diagonal) conditions
*, **, and *** indicate significance at the 0.05, 0.01, and 0.001 levels, respectively.
PH: plant shoot height; SDW: shoot dry weight; PC: phosphorus concentration; PAE: phosphorus acquisition efficiency; PUE: phosphorus use efficiency.
The conditional and unconditional phenotypes of the five traits from the experimental population were used for association analysis. We only selected those markers that were significant in both years and met the criteria of having a significant association threshold (P < 0.01). The SNPs associated with the conditional phenotypes were referred to as conditional SNPs, whereas the SNPs associated with the original phenotypes were termed unconditional SNPs. For unconditional association analysis, a total of 39 significant unconditional SNPs-trait associations involving 23 SNPs were mapped to nine chromosomes for the five traits under the plus and minus P conditions (Supplemental Table 2). Of these 39 unconditional SNP-trait associations, 19 were identified based on the phenotype data from the plus P condition, and 20 were detected based on the minus P condition values. Chromosome 3 had the largest number of SNPs (a total of 11 SNPs), whereas only one SNP was observed on chromosome 13.
Nineteen conditional SNP-trait associations involving 13 SNPs met the significance criteria for conditional association analysis (Fig. 2, Table 3). These SNPs were distributed on nine chromosomes, including Chr1–Chr4, Chr8, Chr13, Chr15, Chr17, and Chr19. Interestingly, almost half of the SNPs were mapped to chromosome 3 (9 SNPs).

Table 3
Significant SNPs detected using the conditional trait values for the five phosphorus efficiency traits in two years
| Trait |
Marker |
CHRa |
Position (bp) |
2012 |
2013 |
| −log (P) |
R2 (%) |
−log (P) |
R2 (%) |
| CPH |
BARC-028709-05992 |
3 |
40654334 |
2.01 |
3.61 |
2.31 |
4.28 |
| CPH |
BARC-029599-06229 |
15 |
5897144 |
2.12 |
5.30 |
2.08 |
5.18 |
| CSDW |
BARC-030665-06919 |
2 |
10233524 |
2.11 |
3.87 |
2.95 |
5.86 |
| CSDW |
BARC-028205-05792 |
3 |
40462124 |
3.02 |
7.67 |
3.28 |
8.31 |
| CSDW |
BARC-028709-05992 |
3 |
40654334 |
2.48 |
4.70 |
2.50 |
4.73 |
| CSDW |
BARC-028671-05985 |
4 |
48121001 |
2.17 |
5.46 |
2.14 |
5.35 |
| CPC |
BARC-024477-04900 |
1 |
2699256 |
3.70 |
10.12 |
3.58 |
9.01 |
| CPC |
BARC-030965-06980 |
3 |
2785339 |
2.78 |
6.90 |
3.49 |
8.69 |
| CPC |
BARC-018809-03022 |
3 |
41074807 |
5.23 |
13.37 |
2.38 |
5.85 |
| CPC |
BARC-045047-08867 |
8 |
8109865 |
2.67 |
5.04 |
2.11 |
3.76 |
| CPC |
BARC-013257-00462 |
13 |
32207135 |
2.48 |
4.60 |
2.42 |
4.46 |
| CPAE |
BARC-028205-05792 |
3 |
40462124 |
2.21 |
5.50 |
2.55 |
6.32 |
| CPAE |
BARC-028709-05992 |
3 |
40654334 |
2.09 |
4.57 |
2.40 |
4.54 |
| CPAE |
BARC-018809-03022 |
3 |
41074807 |
5.00 |
12.88 |
2.03 |
5.01 |
| CPAE |
BARC-031827-07220 |
17 |
1785893 |
2.80 |
7.03 |
3.30 |
8.29 |
| CPAE |
BARC-013481-00498 |
19 |
42334572 |
2.97 |
7.47 |
2.96 |
7.38 |
| CPAE |
BARC-014509-01564 |
19 |
48637997 |
2.22 |
5.52 |
3.06 |
7.65 |
| CPUE |
BARC-024477-04900 |
1 |
2699256 |
3.70 |
10.12 |
2.78 |
9.16 |
| CPUE |
BARC-030965-06980 |
3 |
2785339 |
4.59 |
12.68 |
3.17 |
10.48 |
CPH: conditional phenotype of plant shoot height; CSDW: conditional phenotype of shoot dry weight; CPC: conditional phenotype of phosphorus concentration; CPAE: conditional phenotype of phosphorus acquisition efficiency; CPUE: conditional phenotype of phosphorus use efficiency.
BARC-028709-05992 on chromosome 3 and BARC-029599-06229 on chromosome 15, which were detected using the data from 2012 and 2013, were significantly associated with the conditional phenotype of plant shoot height (CPH). Four significant SNPs (BARC-030665-06919, BARC-028205-05792, BARC-028709-05992 and BARC-028671-05985) for the conditional phenotype of shoot dry weight (CSDW) accounted for 7.38–10.48% of the phenotypic variance. BARC-028205-05792 and BARC-028709-05992 were both located on chromosome 3. BARC-030665-06919 and BARC-028671-05985 were distributed on chromosome 2 and chromosome 4, respectively (Table 3). A total of five significant SNPs with a phenotypic variance explained (PVE) of 3.76–9.01% were found to control the conditional phenotype of phosphorus concentration (CPC) over the two years. Six SNPs that were significantly associated with the conditional phenotype of phosphorus acquisition efficiency (CPAE), and had PVE values ranging from 4.28% to 8.31%, were repeatedly found in two years. BARC-024477-04900 and BARC-030965-06980, which were located on chromosomes 1 and 3, respectively, were two coincident SNPs associated with the conditional phenotype of phosphorus use efficiency (CPUE) across different years.
It is worth noting that a novel SNP cluster with three significantly associated SNPs (BARC-028205-05792, BARC-028709-05992, and BARC-018809-03022) was observed using the conditional phenotype values. The three SNPs that showed significant conditional SNP-trait associations were located within the same genomic region of chromosome 3 and were significantly co-associated with more than one trait. Among the three significant SNPs, BARC-028205-05792 (SNP position: 40462434 bp) was associated with CSDW and CPAE and was located near SNP BARC-018809-03022 (SNP position: 41075023 bp), which was co-associated with CPC and CPAE. In addition, the distance between BARC-028205-05792 and BARC-028709-05992 (SNP position: 40654716 bp), which was associated with controlling CPH, CSDW, and CPAE, was only 0.19 Mb. The coincidence of the SNPs in one chromosomal region across separate years not only indicated the reliability of the SNPs reported above but also implied that these markers may exhibit high efficiency in MAS.
Mining favorable alleles
We determined the favorable alleles of the SNP associated markers for phosphorus efficiency based on the means of conditional phenotypic values of each trait over the two years. A t-test revealed that out of 19 significantly associated SNPs, the phenotypic effects of the alleles of 14 SNPs were significantly different for the corresponding associated traits (Fig. 3, Table 4). Interestingly, the 14 distinct associated markers were included in the components of the novel SNP cluster. For BARC-028709-05992, which was co-associated with CPH, CSDW and CPAE, a comparison of 80 A-type and 111 G-type soybean accessions demonstrated that allele A of BARC-028709-05992 was the favorable allele for the three traits. Two significant SNPs, BARC-024477-04900 and BARC-030965-06980, which were associated with CPC and CPUE, showed different alleles as favorable for these two traits. It was found that allele G of the two SNPs was the favorable allele for CPUE, whereas allele A was the favorable allele for CPC. Each of the remaining seven SNPs have their own separate favorable alleles for each trait. For example, the significant SNP BARC-028205-05792, associated with CSDW across the two years, was identified in 79 A-type and 112 C-type soybean accessions. The CSDW of A-type soybean accessions was significantly increased by 0.07 relative to that of the C-type soybean accessions (t-test, P < 0.001). For the significant SNP BARC-014509-01564, which was associated with CPAE, 155 C-type soybean accessions showed significantly higher CPAE than the 36 A-type accessions, with an average increase of 0.08 per C allele (t-test, P < 0.001). The results of the t-test confirmed that these loci might be responsible for the genetic variation in phosphorus efficiency between the genotypes.
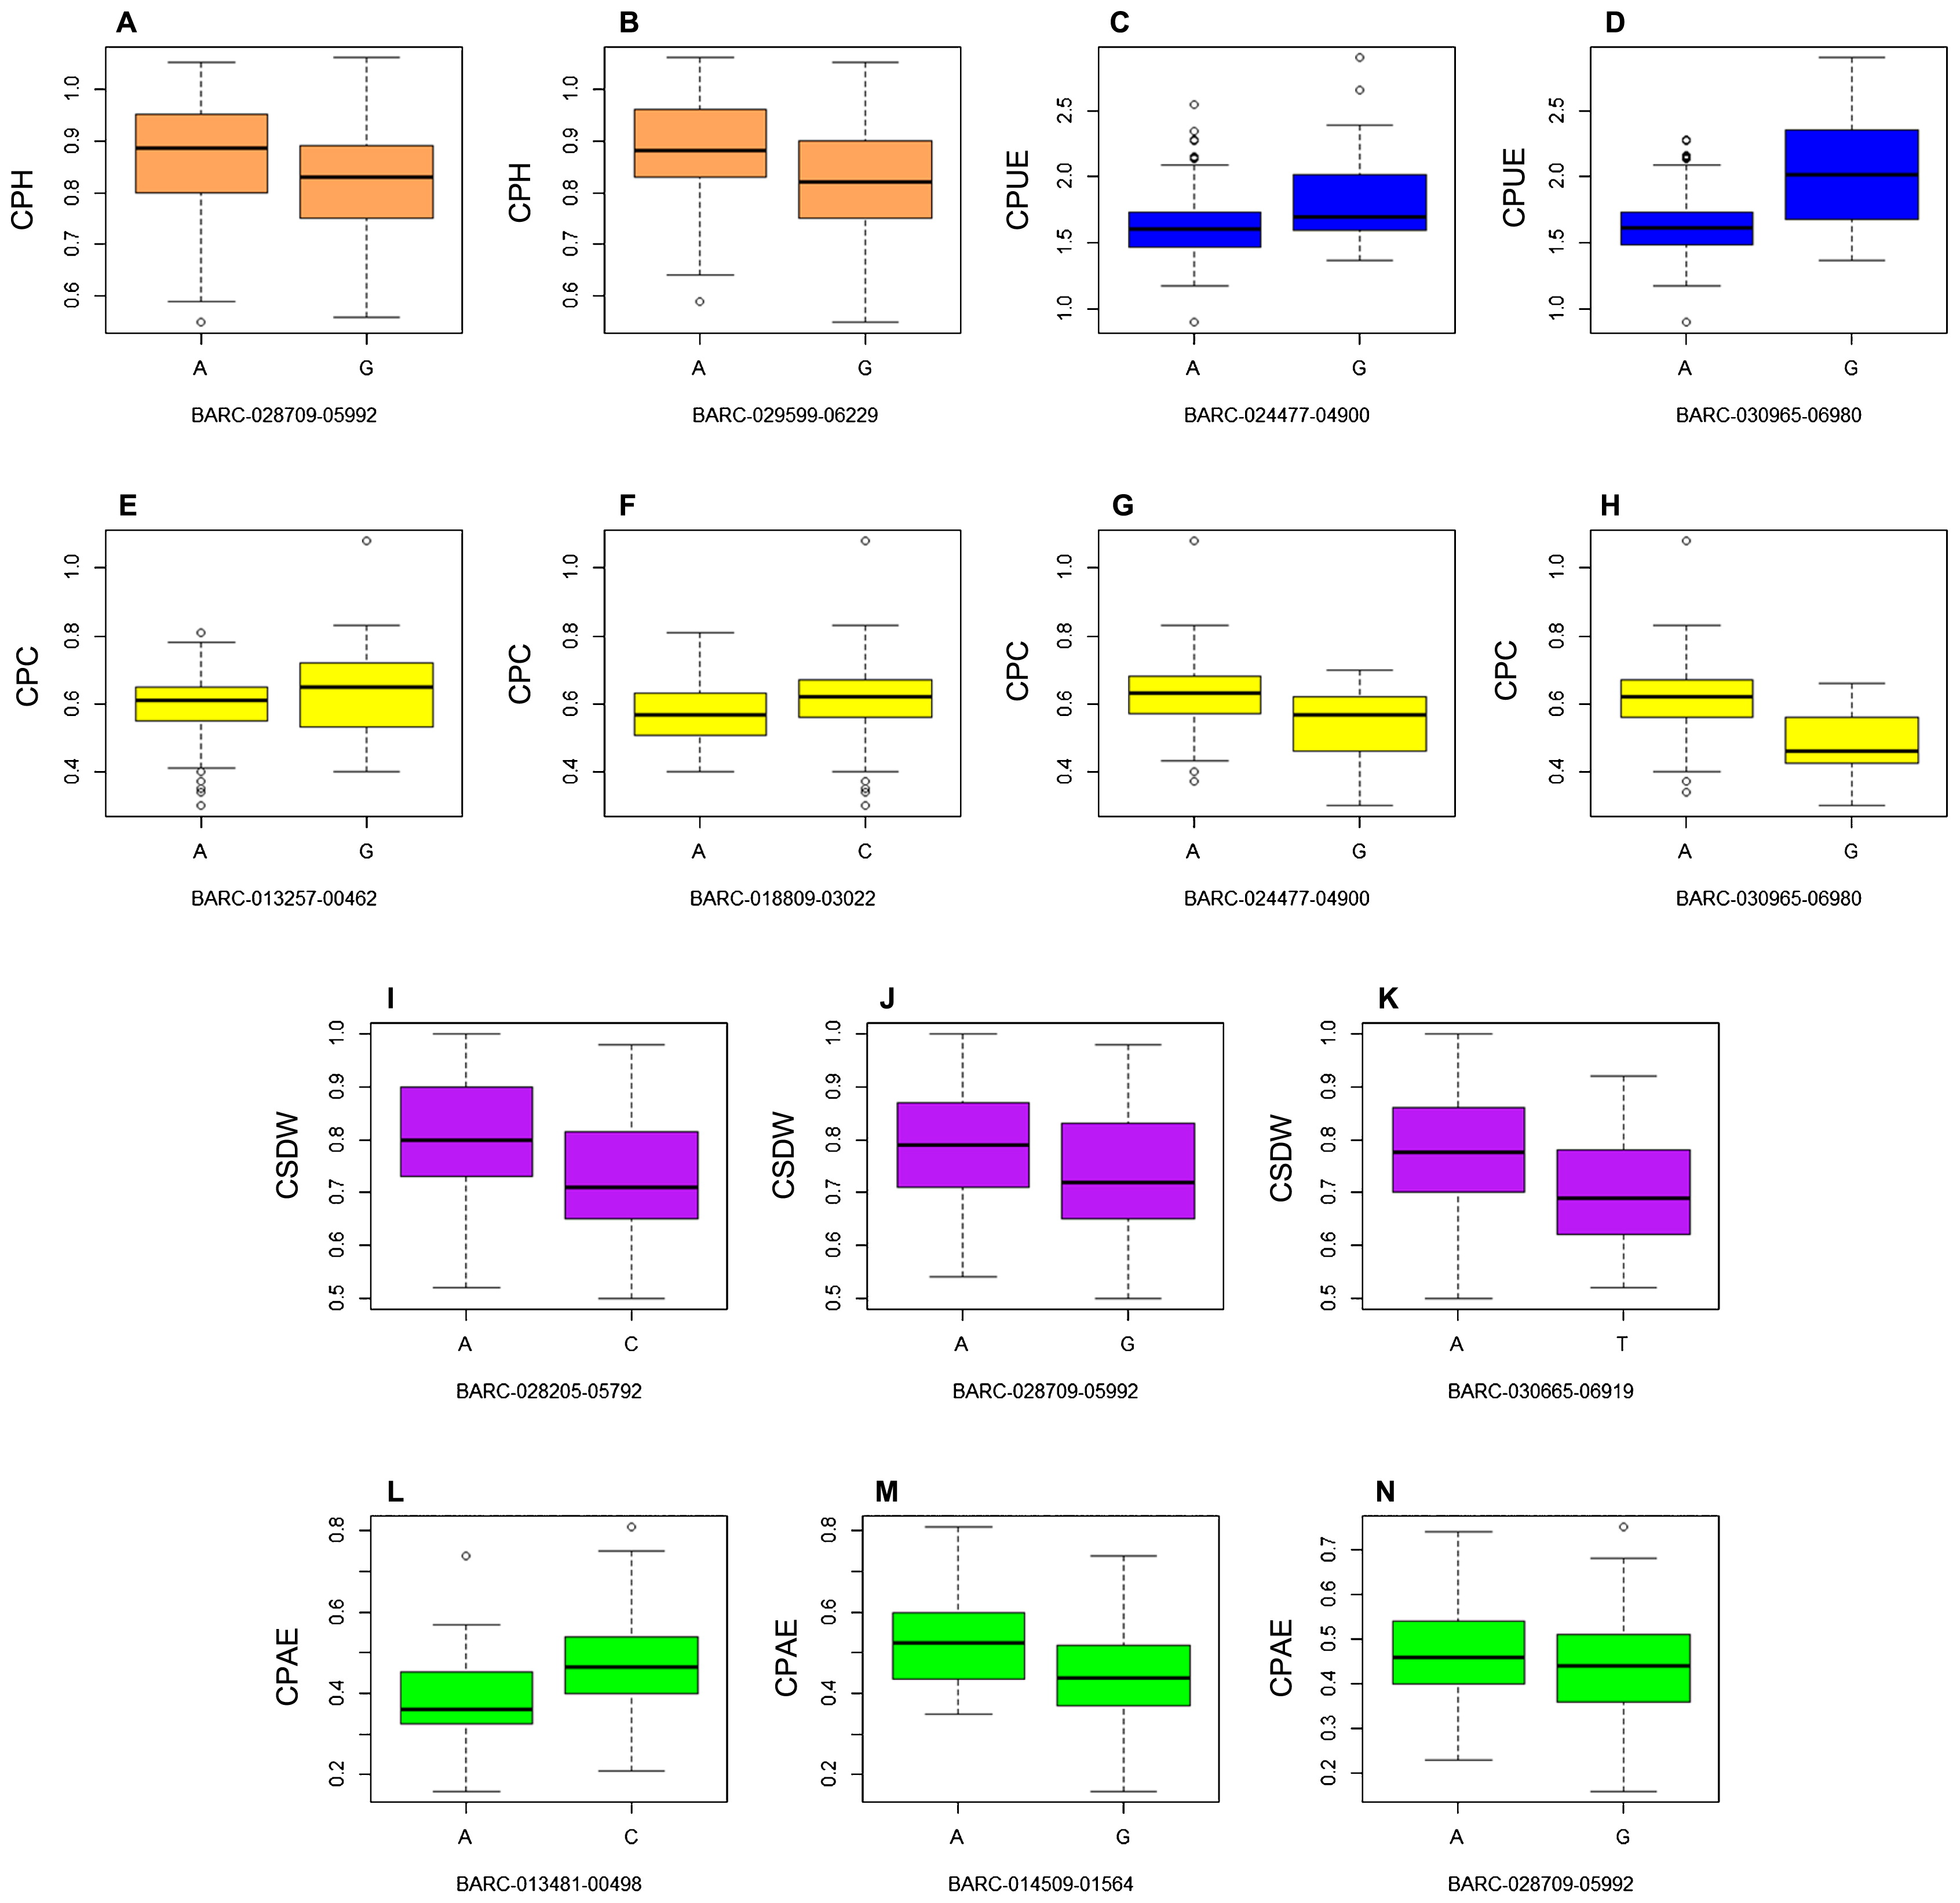
Table 4
T-test of five phosphorus efficiency traits among accessions grouped by the alleles of association SNPs across two years
| Trait |
Marker |
CHRa |
Position (bp) |
Alleles |
Number |
Mean |
T-test |
| CPH |
BARC-028709-05992 |
3 |
40654334 |
A |
80 |
0.87 |
P < 0.01 |
|
|
|
|
G |
111 |
0.82 |
|
| CPH |
BARC-029599-06229 |
15 |
5897144 |
A |
73 |
0.88 |
P < 0.001 |
|
|
|
|
G |
118 |
0.82 |
|
| CSDW |
BARC-030665-06919 |
2 |
10233524 |
A |
147 |
0.77 |
P < 0.001 |
|
|
|
|
T |
44 |
0.7 |
|
| CSDW |
BARC-028205-05792 |
3 |
40462124 |
A |
79 |
0.8 |
P < 0.001 |
|
|
|
|
C |
112 |
0.73 |
|
| CSDW |
BARC-028709-05992 |
3 |
40654334 |
A |
80 |
0.79 |
P < 0.01 |
|
|
|
|
G |
111 |
0.73 |
|
| CPC |
BARC-024477-04900 |
1 |
2699256 |
A |
137 |
0.63 |
P < 0.001 |
|
|
|
|
G |
54 |
0.54 |
|
| CPC |
BARC-030965-06980 |
3 |
2785339 |
A |
170 |
0.61 |
P < 0.001 |
|
|
|
|
G |
21 |
0.49 |
|
| CPC |
BARC-018809-03022 |
3 |
41074807 |
A |
46 |
0.58 |
P < 0.05 |
|
|
|
|
C |
145 |
0.61 |
|
| CPC |
BARC-013257-00462 |
13 |
32207135 |
A |
148 |
0.62 |
P < 0.001 |
|
|
|
|
G |
43 |
0.55 |
|
| CPAE |
BARC-028709-05992 |
3 |
40654334 |
A |
80 |
0.47 |
P < 0.05 |
|
|
|
|
G |
111 |
0.44 |
|
| CPAE |
BARC-013481-00498 |
19 |
42334572 |
A |
77 |
0.5 |
P < 0.001 |
|
|
|
|
T |
114 |
0.42 |
|
| CPAE |
BARC-014509-01564 |
19 |
48637997 |
A |
36 |
0.39 |
P < 0.001 |
|
|
|
|
C |
155 |
0.47 |
|
| CPUE |
BARC-024477-04900 |
1 |
2699256 |
A |
137 |
1.63 |
P < 0.01 |
|
|
|
|
G |
54 |
1.81 |
|
| CPUE |
BARC-030965-06980 |
3 |
2785339 |
A |
170 |
1.63 |
P < 0.001 |
|
|
|
|
G |
21 |
2.05 |
|
CPH: conditional phenotype of plant shoot height; CSDW: conditional phenotype of shoot dry weight; CPC: conditional phenotype of phosphorus concentration; CPAE: conditional phenotype of phosphorus acquisition efficiency; CPUE: conditional phenotype of phosphorus use efficiency.
The typical carrier variety containing favorable alleles with the best phenotypic value might be used to design parental combinations for crop breeding (Niu et al. 2013). PAE and PUE are two components of phosphorus efficiency. To simultaneously improve P uptake and P utilization efficiency in soybean, we might aggregate all the favorable alleles for the traits into one cultivar to the greatest degree possible in the following way. First, the favorable alleles of stable SNPs were selected using a t-test, and the elite accessions containing more than one favorable allele and with a relatively high mean value of phosphorus efficiency-related traits in both years were selected from the experimental population. Then the phenotypic values of CPAE and CPUE were predicted for the hypothetical crossed offspring of elite accessions as the sums of the QTL effects that were estimated based on their QTL genotypes and the mean values of the experimental population over two years for the conditional phenotypes. Finally, we selected the elite parental combinations for crossing to generate high phosphorus-efficiency progenies according to the elite offspring with higher phenotypic values of CPAE and CPUE. To simultaneously improve P uptake and P utilization efficiency five favorable alleles could be pyramided by the parental combinations of Y8D6002 × Y8D6051, Y8D6002 × Y8D6096, and Y8D6096 × Y8D6179 (Tables 5, 6).
Table 5
Significant SNPs with favorable alleles among the selected accessions
| Locus |
Selected accessions |
| Y8D6002 |
Y8D6051 |
Y8D6096 |
Y8D6179 |
| BARC-028709-05992 |
A |
/ |
/ |
A |
| BARC-024477-04900 |
/ |
A |
A |
/ |
| BARC-030965-06980 |
A |
A |
A |
A |
| BARC-013481-00498 |
A |
/ |
A |
/ |
| BARC-014509-01564 |
C |
C |
C |
C |
Table 6
Top three superior crosses for phosphorus efficiency improvement
| P1 |
P2 |
RILs |
| Taxa |
CPAE |
CPUE |
Pa-CPAE |
P-CPUE |
Taxa |
CPAE |
CPUE |
P-CPAE |
P-CPUE |
Mb-CPAE |
M-CPUE |
| Y8D6002 |
0.62 |
1.52 |
0.49 |
1.96 |
Y8D6051 |
0.48 |
1.57 |
0.44 |
2.13 |
0.49 |
2.13 |
| Y8D6002 |
0.62 |
1.52 |
0.49 |
1.96 |
Y8D6096 |
0.38 |
2.00 |
0.47 |
2.13 |
0.49 |
2.13 |
| Y8D6096 |
0.38 |
2.00 |
0.47 |
2.13 |
Y8D6179 |
0.49 |
1.86 |
0.46 |
1.96 |
0.49 |
2.13 |
P1 and P2: the two parental lines of the cross; RILs: the recombinant inbred lines from the parental cross; CPAE: conditional phenotype of phosphorus acquisition efficiency; CPUE: conditional phenotype of phosphorus use efficiency;
a the phenotypic values of CPAE and CPUE were predicted as the sums of the QTL effects that were estimated based on their QTL genotypes and the mean values of the experimental population over two years for the conditional phenotypes;
b the maximum predicted phenotypic value.
Discussion
Effect of phosphorus deficiency on seedling growth
In the present study, five morphological and physiological traits at the seedling stage were used as indicators to identify the genomic regions that control phosphorus efficiency. A strong influence of the traits was observed under the minus P condition (Table 1). PAE was more severely reduced by phosphorus deficiency than PH and SDW under the minus P condition. Among other components of phosphorus efficiency, PUE was increased, which is in agreement with a previous study (Su et al. 2009). Therefore, this result implied that PAE may be the limiting factor for shoot development at the seedling stage under phosphorus deficient conditions. This was verified by correlation analysis (Table 2). Higher positive correlations were observed between PAE and agronomic traits than those observed with PUE, PH and SDW. These results indicate the importance and complexity of understanding the genetic basis of phosphorus-deficiency tolerance in soybean breeding.
Conditional association analysis for phosphorus-deficiency tolerance
Phosphorus-deficiency tolerance in plants is a complex trait represented by different phenotypic traits in different growth periods. The aim of the QTL analysis of conventional phosphorus-deficiency tolerance is to analyze the expression of phenotypic traits at different P levels (Li et al. 2005, Liang et al. 2010, Zhang et al. 2009). However, it is extremely difficult to discover the genetic relationship between these phenotypic traits and phosphorus-deficiency tolerance and to identify the loci concerned with phosphorus-deficiency tolerance because of the difference in trait expression under different P levels. Most unconditional QTLs for traits of soybean seedling under phosphorus-deficiency stress did not contribute directly to phosphorus-deficiency tolerance but only to the development of those traits. Conditional genetic analysis can effectively eliminate genetic inter-relationships among individual QTLs at different P levels and reveal QTLs that cannot be identified under unconditional analysis. This is because this method can exclude the influence of trait expression itself and isolate the variations that were only caused by different phosphorus treatments (Cui et al. 2011, Zhang and Wang 2015, Zhu 1995). In the present study, association analysis based on conditional phenotypes was defined as conditional association analysis, whereas that based on the original phenotypes was defined as unconditional association analysis. Less than one-third of the significantly associated conditional SNPs (five SNPs) were identified by unconditional analysis, after comparing of the results of conditional and unconditional analysis (Fig. 2, Table 3, Supplemental Table 2). The inconsistency in SNPs detected using conditional and unconditional analyses is in agreement with earlier reports (Cui et al. 2011, Zhang and Wang 2015, Zhang et al. 2014c). These findings imply that some significant SNPs that are associated specifically with phosphorus-deficiency tolerance could be identified only by eliminating the influence of the trait expressed under plus P conditions. In addition, these findings also imply that trait expression itself may suppress the expression of most conditional SNPs associated with phosphorus-deficiency tolerance. Hence, conditional association analysis is more viable and effective for phosphorus-deficiency-tolerance related traits.
Quantitative trait nucleotides (QTNs) for phosphorus efficiency and important SNP clusters
Previous reports have descried the determination of the genetic basis of phosphorus efficiency in soybean using bi-parental segregating populations and/or association panels (Li et al. 2005, Liang et al. 2010, Zhang et al. 2009, 2014b). It is very difficult to compare the results of different studies due to the use of different genetic maps, especially when marker density is very low. Therefore, we determined whether the conditional SNPs detected in our study were located at or near the same locations as those identified in previous reports by comparing the chromosomal positions of these QTLs (http://www.soybase.org/). Zhang et al. (2009) performed QTL mapping and detected a total of 34 significant QTLs for five phosphorus efficiency-related traits at the soybean seedling stage in a RIL population. In our study, only BARC-029599-06229 for CPH and BARC-013481-00498 for CPAE were located near or in the region of the confidence interval for the two QTLs detected by Zhang et al. (2009). This result confirmed that a certain causal gene or genes for P homeostasis might exist in this genomic region. Li et al. (2005) identified seven QTLs for three traits: fresh shoot weight, leaf phosphorus content, and root phosphorus content. Liang et al. (2010) mapped three clusters of QTLs associated with root-related traits and P efficiency traits under a low P condition and one cluster under a high P condition. However, no SNPs were detected at or near these locations in the present study. The different mapping populations and experimental environments that were used in the studies mentioned above may lead to some inconsistency in the QTLs mapped in different studies. In a recent study, a number of QTLs/QTNs for phosphorus efficiency-related traits during the reproductive stage in a soybean RIL population and natural population were mapped (Zhang et al. 2014b). However, only a small number of our QTNs (BARC-013481-00498 and BARC-014509-01564) were near the QTLs/QTNs detected by Zhang et al. (2014b) because different soybean growth stages were used in the two studies. This difference is not surprising given that plant growth and development during different growth stages is controlled by different genes.
According to genomic sequencing, most identified genes are distributed in the euchromatic regions, whereas a few genes are found in the heterochromatic regions (Schmutz et al. 2010). Hence, it is common that QTLs for different traits are clustered in particular genetic regions, and this phenomenon has been reported in different species (Hu et al. 2013, Obara et al. 2011). In our study, three SNPs that were significantly associated with more than one trait were located in close proximity to each other on chromosome 3. An interesting SNP, BARC-028709-05992, which was detected for CPH, CSDW, CPAE, PlusPH (plant shoot height under the plus P condition), PlusSDW (shoot dry weight under the plus P condition), and MinusSDW (shoot dry weight under the minus P condition) in our study, was coincident with a QTL for phosphorus efficiency in soybean (Hang et al. 2011). This QTL region has also been mapped in several different studies for 100-seed weight, seed yield, seed size, seed phosphorus concentration and chlorophyll fluorescence parameters (Hao et al. 2012a, 2012b, Hu et al. 2013, Ning et al. 2015). Another significant SNP, BARC-028205-05792, which is co-associated with PlusSDW, MinusPAE (phosphorus acquisition efficiency under the minus P condition), CSDW and CPAE, is also associated with chlorophyll and chlorophyll fluorescence parameters (Hao et al. 2012b). Moreover, GmPT2 (Glyma.03g162800), a Pht1 family gene, is located near BARC-028205-05792 (Supplemental Table 3). The expression of GmPT2 can complement the yeast P-uptake mutant (MB192) under P-limiting conditions (Qin et al. 2012). The region of BARC-028709-05992 was located 168124 bp away from Glyma.03g194200, which is orthologous to the purple acid phosphatase gene (PAPs) (Supplemental Table 3). PAPs play a vital role in the adaptive strategies of leguminous plants to phosphorus deficiency (Liang et al. 2012, Zhang et al. 2014b). These findings suggest that the genetic regions of the SNP cluster mentioned above are important for increasing genotype selection intensity by MAS and should be given more attention in pyramiding breeding.
Predicted novel parental combination for molecular design breeding
Peleman and van der Voort (2003) first introduced the concept of “Breeding by Design” based on the extensive study of the technology and potential of marker-assisted selection. Breeders can design their crosses such that superior alleles are combined in one individual using a “menu” listing the superior alleles of breeding materials. PAE and PUE are two components of phosphorus efficiency. However, it is difficult to improve PAE and PUE simultaneously because of their negative correlation. Pyramiding more positive favorable alleles for PAE and PUE into one cultivar, as far as possible, may solve this problem. In our study, three parental combinations (Y8D6002 × Y8D6051, Y8D6002 × Y8D6096, and Y8D6179 × Y8D6096) using four selected accessions with high a P value in the t-test and more than one favorable allele could be used in soybean phosphorus-deficiency tolerance breeding programs (Tables 5, 6). For the parental cross combination of Y8D6179 × Y8D6096, the maximum predicted CPAE phenotypic value of the progeny (0.49) was higher than the predicted CPAE values of its two parents (0.47 and 0.46) because the favorable alleles that controlled CPAE were pyramided into the best progeny. Therefore, the best RIL of Y8D6096 × Y8D6179 with maximum CPAE and CPUE values may be selected as a more phosphorus efficient cultivar by breeders. The results of predicted parental cross combinations can be used for future molecular design breeding. According to previous reports (Wan 2006, Wang et al. 2006), we know that the predicted results can be confirmed by further crop breeding. Wang et al. (2006) selected three chromosome segment substitution lines (CSSL5, 16, and 19) as parental cross combinations from 65 CSSLs on the basis of the effects of the detected loci for rice grain length and width. Wang et al. (2006) reported that the predicted length and width of the best offspring line were 6.21 mm and 3.07 mm, respectively. Recently, a japonica cultivar carrying a target genotype of indica genome fragments (>8.5 mm length × 3.2 mm width), derived from the designed target genotypes for large grain, was bred using molecular design breeding (Niu et al. 2013, Wang et al. 2006). Hence, the predicted combinations in the present study will be valuable for guiding breeders in future soybean phosphorus-deficiency tolerance breeding programs.
Function of putative phosphorus efficiency-related genes
QTNs should be sufficiently robust for further fine mapping or for use in a phosphorus deficiency stress-breeding scheme. It is important to identify the key genes responsible for these phenotypic traits. A previous study determined that soybean and Arabidopsis diverged from a common ancestor approximately 90 million years ago (Grant et al. 2000). The presence of homologs of partial genomic sequences and the conserved nature of certain residues of most genes suggest that many genes are likely to be functionally conserved across soybean and Arabidopsis (Grant et al. 2000). These factors make comparative genome mapping/homology cloning possible between the two species. Thus far, hundreds of genes involved in P acquisition, transport, translocation and homeostasis have been reported in Arabidopsis (Fang et al. 2009, Plaxton et al. 2011, Zhang et al. 2014c). Therefore, we predicted specific candidate genes involved in phosphate metabolism by performing a BLASTP analysis and synteny comparisons between soybean and Arabidopsis according to Mamidi et al. (2011). Briefly, gene prediction in the target genomic region was performed based on soybean genome information and bioinformatics. Genes that were not only related to phosphorus efficiency (annotated as such or orthologous to genes of Arabidopsis) but also located in the decay distance of LD were considered candidate genes. The decay distance of LD is approximately 500 kb according to Hao et al. (2012a). In total, 17 genes involved in phosphate homeostasis in Arabidopsis were mapped to the soybean LD regions of QTNs, including transporter genes, PAP family members and others (Supplemental Table 3). The approach of associating QTNs with functional genes in Arabidopsis by synteny comparisons will not only provide more information for dissecting the genetics of the mechanisms of phosphorus-deficiency tolerance in soybean but will also facilitate the utilization of phosphorus-deficiency stress or responsive genes in soybean breeding.
Acknowledgments
This work was supported in part by the National Natural Science Foundation of China (no. 31171573 and no. 31370034), the Jiangsu Provincial Support Program (no. BE2012328), the Program for Changjiang Scholars and Innovative Research Team in University (PCSIRT13073), and the Jiangsu Collaborative Innovation Center for Modern Crop Production (JCIC-MCP).
Literature Cited
- Atwell, S., Y. Huang, B.J. Vilhjálmsson, G. Willems, M. Horton, Y. Li, D. Meng, A. Platt, A.M. Tarone, T. Hu et al. (2010) Genome-wide association study of 107 phenotypes in Arabidopsis thaliana inbred lines. Nature 465: 627–631.
- Beebe, S.E., R.P. Marcela, X. Yan, M.W. Blair, F. Pedraza, F. Muñoz, J. Tohme and J.P. Lynch (2006) Quantitative trait loci for root architecture traits correlated with phosphorus acquisition in common bean. Crop Sci. 46: 413–423.
- Bradbury, P., Z. Zhang, D. Kroon, T. Casstevens, Y. Ramdoss and E. Buckler (2007) TASSEL: software for association mapping of complex traits in diverse samples. Bioinformatics 23: 2633–2635.
- Bray, R.H. and L. Kurtz (1945) Determination of total, organic, and available forms of phosphorus in soils. Soil Sci. 59: 39–46.
- Brenchley, W.E. (1929) The phosphate requirement of barley at different periods of growth. Ann. Bot. 43: 89–108.
- Colwell, J. and R. Esdaile (1968) The calibration, interpretation, and evaluation of tests for the phosphorus fertilizer requirements of wheat in northern New South Wales. Soil Research 6: 105–120.
- Cordell, D., J.O. Drangert and S. White (2009) The story of phosphorus: global food security and food for thought. Global Environ. Chang. 19: 292–305.
- Cui, F., J. Li, A. Ding, C. Zhao, L. Wang, S. Li, Y. Bao, X. Li, D. Feng, L. Kong et al. (2011) Conditional QTL mapping for plant height with respect to the length of the spike and internode in two mapping populations of wheat. Theor. Appl. Genet. 122: 1517–1536.
- Cui, S., L. Geng, Q. Meng and D. Yu (2007) QTL mapping of phosphorus deficiency tolerance in soybean (Glycine max L.) during seedling stage. Acta Agron. Sin. 33: 378–383.
- Fang, Z., C. Shao, Y. Meng, P. Wu and M. Chen (2009) Phosphate signaling in Arabidopsis and Oryza sativa. Plant Sci. 176: 170–180.
- Fredeen, A.L., T.K. Raab, I.M. Rao and N. Terry (1990) Effects of phosphorus nutrition on photosynthesis in Glycine max (L.) Merr. Planta 181: 399–405.
- Furlani, A.M.C., P.R. Furlani, R.T. Tanaka, H.A.A. Mascarenhas and M.D.P. Delgado (2002) Variability of soybean germplasm in relation to phosphotus uptake and use efficiency. 2001 Paper presented in the XIV International Plant Nutrition Colloquium, Hannover, Germany, Scientia Agricola 59: 529–536.
- Geng, L., S. Cui, D. Zhang, H. Xing, J. Gai and D. Yu (2007) QTL mapping and epistasis analysis for P-efficiency in soybean. Soybean Sci. 26: 460–466.
- Gericke, W.F. (1924) The beneficial effect to wheat growth due to depletion of available phosphorus in the culture media. Science 60: 297–298.
- Gourley, C.J.P., D.L. Allan and M.P. Russelle (1994) Plant nutrient efficiency: a comparison of definitions and suggested improvement. Plant Soil 158: 29–37.
- Grant, D., P. Cregan and R.C. Shoemaker (2000) Genome organization in dicots: genome duplication in Arabidopsis and synteny between soybean and Arabidopsis. Proc. Natl. Acad. Sci. USA 97: 4168–4173.
- Hang, L., K. Zhong, Q. Ma, H. Nian and C. Yang (2011) Integrated QTLs map of phosphorus efficiency in soybean by Meta-analysis. Chin. J. Oil Crop Sci. 33: 25–32.
- Hao, D., H. Cheng, Z. Yin, S. Cui, D. Zhang, H. Wang and D. Yu (2012a) Identification of single nucleotide polymorphisms and haplotypes associated with yield and yield components in soybean (Glycine max) landraces across multiple environments. Theor. Appl. Genet. 124: 447–458.
- Hao, D., M. Chao, Z. Yin and D. Yu (2012b) Genome-wide association analysis detecting significant single nucleotide polymorphisms for chlorophyll and chlorophyll fluorescence parameters in soybean (Glycine max) landraces. Euphytica 186: 919–931.
- Hu, Z., H. Zhang, G. Kan, D. Ma, D. Zhang, G. Shi, D. Hong, G. Zhang and D. Yu (2013) Determination of the genetic architecture of seed size and shape via linkage and association analysis in soybean (Glycine max L. Merr.). Genetica 141: 247–254.
- Huang, X., Y. Zhao, X. Wei, C. Li, A. Wang, Q. Zhao, W. Li, Y. Guo, L. Deng, C. Zhu et al. (2012) Genome-wide association study of flowering time and grain yield traits in a worldwide collection of rice germplasm. Nat. Genet. 44: 32–39.
- Hwang, E.Y., Q. Song, G. Jia, J.E. Specht, D.L. Hyten, J. Costa and P.B. Cregan (2014) A genome-wide association study of seed protein and oil content in soybean. BMC Genomics 15: 1.
- Korte, A. and A. Farlow (2013) The advantages and limitations of trait analysis with GWAS: a review. Plant Methods 9: 29.
- Kump, K.L., P.J. Bradbury, R.J. Wisser, E.S. Buckler, A.R. Belcher, M.A. Oropeza-Rosas, J.C. Zwonitzer, S. Kresovich, M.D. McMullen, D. Ware et al. (2011) Genome-wide association study of quantitative resistance to southern leaf blight in the maize nested association mapping population. Nat. Genet. 43: 163–168.
- Li, Y., Y. Wang, Y. Tong, J. Gao, J. Zhang and S. Chen (2005) QTL mapping of phosphorus deficiency tolerance in soybean (Glycine max L. Merr.). Euphytica 142: 137–142.
- Liang, C., L. Sun, Z. Yao, H. Liao and J. Tian (2012) Comparative analysis of PvPAP gene family and their functions in response to phosphorus deficiency in common bean. PLoS ONE 7: e38106.
- Liang, Q., X. Cheng, M. Mei, X. Yan and H. Liao (2010) QTL analysis of root traits as related to phosphorus efficiency in soybean. Ann. Bot. 106: 223–234.
- Mamidi, S., S. Chikara, R.J. Goos, D.L. Hyten, D. Annam, S.M. Moghaddam, R.K. Lee, P.B. Cregan and P.E. McClean (2011) Genome-wide association analysis identifies candidate genes associated with iron deficiency chlorosis in soybean. Plant Genome 4: 154–164.
- Ning, L., P. Sun, Q. Wang, D. Ma, Z. Hu, D. Zhang, G. Zhang, H. Cheng and D. Yu (2015) Genetic architecture of biofortification traits in soybean (Glycine max L. Merr.) revealed through association analysis and linkage mapping. Euphytica 204: 353–369.
- Niu, Y., Y. Xu, X. Liu, S. Yang, S. Wei, F. Xie and Y. Zhang (2013) Association mapping for seed size and shape traits in soybean cultivars. Mol. Breed. 31: 785–794.
- Obara, M., T. Takeda, T. Hayakawa and T. Yamaya (2011) Mapping quantitative trait loci controlling root length in rice seedlings grown with low or sufficient NH4 + supply using backcross recombinant lines derived from a cross between Oryza sativa L. and Oryza glaberrima Steud. Soil Sci. Plant Nutr. 57: 80–92.
- Peleman, J.D. and J.R. van der Voort (2003) Breeding by design. Trends Plant Sci. 8: 330–334.
- Plaxton, W.C. and H.T. Tran (2011) Metabolic adaptations of phosphate-starved plants. Plant Physiol. 156: 1006–1015.
- Pritchard, J., M. Stephens and P. Donnelly (2000) Inference of population structure using multilocus genotype data. Genetics 155: 945–959.
- Qin, L., Y. Guo, L. Chen, R. Liang, M. Gu, G. Xu, J. Zhao, T. Walk and H. Liao (2012) Functional characterization of 14 Pht1 family genes in yeast and their expressions in response to nutrient starvation in soybean. PLoS ONE 7: e47726.
- Qiu, J. and D.W. Israel (1992) Diurnal starch accumulation and utilization in phosphorus-deficient soybean plants. Plant Physiol. 98: 316–323.
- Schmutz, J., S.B. Cannon, J. Schlueter, J. Ma, T. Mitros, W. Nelson, D.L. Hyten, Q. Song, J.J. Thelen, J. Cheng et al. (2010) Genome sequence of the paleopolyploid soybean. Nature 463: 178–183.
- Shi, J., R. Li, D. Qiu, C. Jiang, L. Yan, C. Morgan, I. Bancroft, J. Zhao and J. Meng (2009) Unraveling the complex trait of crop yield with QTL mapping in Brassica napus. Genetics 182: 851–861.
- Sonah, H., L. O’Donoughue, E. Cober, I. Rajcan and F. Belzile (2014) Identification of loci governing eight agronomic traits using a GBS-GWAS approach and validation by QTL mapping in soya bean. Plant Biotechnol. J. 13: 211–221.
- Su, J., Q. Zheng, H. Li, B. Li, R. Jing, Y. Tong and Z. Li (2009) Detection of QTLs for phosphorus use efficiency in relation to agronomic performance of wheat grown under phosphorus sufficient and limited conditions. Plant Sci. 176: 824–836.
- Sukumaran, S., S. Dreisigacker, M. Lopes, P. Chavez and M. Reynolds (2015) Genome-wide association study for grain yield and related traits in an elite spring wheat population grown in temperate irrigated environments. Theor. App. Genet. 128: 353–363.
- Vance, C.P., C. Uhde-Stone and D.L. Allan (2003) Phosphorus acquisition and use: critical adaptations by plants for securing a nonrenewable resource. New Phytol. 157: 423–447.
- Wan, J. (2006) Perspectives of molecular design breeding in crops. Acta Agron. Sin. 32: 455–462.
- Wang, J., X. Wan, J. Crossa, J. Crouch, J. Weng, H. Zhai and J. Wan (2006) QTL mapping of grain length in rice (Oryza sativa L.) using chromosome segment substitution lines. Genet. Res. 88: 93–104.
- Wang, W. (1963) Phosphorus nutrition and fertilization of soybean. Sci. Agric. Sin. 11: 41–44.
- Wang, X., J. Shen and H. Liao (2010) Acquisition or utilization, which is more critical for enhancing phosphorus efficiency in modern crops? Plant Sci. 179: 302–306.
- Wissuwa, M., M. Yano and N. Ae (1998) Mapping of QTLs for phosphorus-deficiency tolerance in rice (Oryza sativa L.). Theor. Appl. Genet. 97: 777–783.
- Wu, D., X. Zhang, Z. Gong, C. Ma and L. Zhang (2012) Effects of phosphorus nutrition on P absorption and yields of soybean. Plant Nutri. and Fertilizer Sci. 18: 670–677.
- Yan, H., H. Wang, H. Cheng, Z. Hu, S. Chu, G. Zhang and D. Yu (2015) Detection and fine-mapping of SC7 resistance genes via linkage and association analysis in soybean. J. Integr. Plant Biol. 57: 722–729.
- Yang, M., G. Ding, L. Shi, J. Feng, F. Xu and J. Meng (2010) Quantitative trait loci for root morphology in response to low phosphorus stress in Brassica napus. Theor. Appl. Genet. 121: 181–193.
- Yu, J., G. Pressoir, W.H. Briggs, B.I. Vroh, M. Yamasaki, J.F. Doebley, M.D. McMullen, B.S. Gaut, D.M. Nielsen, J.B. Holland et al. (2006) A unified mixed-model method for association mapping that accounts for multiple levels of relatedness. Nat. Genet. 38: 203–208.
- Zhang, D., H. Cheng, L. Geng, G. Kan, S. Cui, Q. Meng, J. Gai and D. Yu (2009) Detection of quantitative trait loci for phosphorus deficiency tolerance at soybean seedling stage. Euphytica 167: 313–322.
- Zhang, D., G. Kan, Z. Hu, H. Cheng, Y. Zhang, Q. Wang, H. Wang, Y. Yang, H. Li, D. Hao et al. (2014a) Use of single nucleotide polymorphisms and haplotypes to identify genomic regions associated with protein content and water-soluble protein content in soybean. Theor. Appl. Genet. 127: 1905–1915.
- Zhang, D., H. Song, H. Cheng, D. Hao, H. Wang, G. Kan, H. Jin and D. Yu (2014b) The acid phosphatase-encoding gene GmACP1 contributes to soybean tolerance to low-phosphorus stress. PLoS Genet. 10: e1004061.
- Zhang, H. and H. Wang (2015) QTL mapping for traits related to P-deficient tolerance using three related RIL populations in wheat. Euphytica 203:505–520.
- Zhang, Z., H. Liao and W.J. Lucas (2014c) Molecular mechanisms underlying phosphate sensing, signaling, and adaptation in plants. J. Integr. Plant Biol. 56: 192–220.
- Zhu, J. (1995) Analysis of conditional genetic effects and variance components in developmental genetics. Genetics 141: 1633–1639.
- Zhu, J., S.M. Mickelson, S.M. Kaeppler and J.P. Lynch (2006) Detection of quantitative trait loci for seminal root traits in maize (Zea mays L.) seedlings grown under differential phosphorus levels. Theor. Appl. Genet. 113: 1–10.